![[CICC Fixed Income Credit]The scale is stable but the fluctuation is increasing, and the non-standard proportion continues to decline——Comments on the semi-annual report of wealth management in 2022 | Finance_Sina Finance_Sina.com](http://n.sinaimg.cn/front20220823ac/739/w1080h459/20220823/900b-d79e98db9c7906807fbbf6d7f3772a02.jpg "[CICC Fixed Income Credit]The scale is stable but the fluctuation is increasing, and the non-standard proportion continues to decline——Comments on the semi-annual report of wealth management in 2022 | Finance_Sina Finance_Sina.com")
In the first half of 2022, non-principal-guaranteed wealth management showed a slight increase in scale and continued acceleration of net worth transformation, but the fluctuation of scale increased. On the allocation side, the proportion of bonds increased year-on-year, while the proportion of non-standard and equity assets continued to decline. Looking into the future, the net worth transformation has been basically completed. We believe that in the short term, the product innovation of various institutions may still maintain a steady increase in the scale of wealth management, but the fluctuation of the scale may also increase. At the same time, we believe that the structural increase in the allocation of standardized coupon assets will lead to a steady increase in demand for credit bonds, but structurally, its risk and duration preference will remain low.
Summary
event
On August 11, 2022, the 2022 Bank Wealth Management Semi-Annual Report was released. Our comments on the important contents of the report are as follows.
Comment
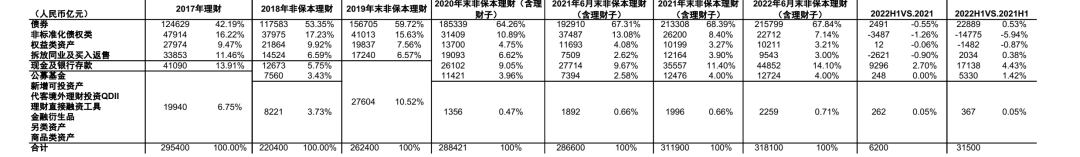
In the first half of 2022, non-principal-guaranteed wealth management will be characterized by sustained growth in scale and steady progress in net worth transformation. Among them, the scale of wealth management companies continued to show growth.The scale of non-principal-guaranteed wealth management increased by about 13% compared with the end of June 2021, and reached 29.15 trillion yuan by the end of June 2022, a slight increase of 0.52% compared with the end of 2021. Except for wealth management companies and rural financial institutions, the existing scale of other institutions has increased compared with the end of 2021. dropped. It is worth noting that the scale of products of wealth management companies has expanded, and the current balance of surviving accounts for more than 65%, and the proportion of their internal self-issued products has continued to rise. The scale of large and medium-sized banks decreased the most month-on-month, and the proportion also decreased the most, which may be related to the transfer of products to wealth management companies. Non-guaranteed wealth management mainly includes fixed income products, open-end products and public offering products. The term of newly issued closed-end products continued to lengthen, and the proportion of closed-end products over one year increased to 71%. In the first half of 2022, the scale and proportion of net worth products continued to increase. As of the end of June 2022, net worth products accounted for 95.09% of the remaining balance of all wealth management products. In terms of yield, the weighted yield of wealth management products at the end of June 2022 was 3.61%, an increase of 9bp over the same period of the previous year and an increase of 6bp over the end of the previous year.In 2022, wealth management products will continue to grow in terms of ESG, social responsibility and pensions.
Asset allocation: The proportion of bonds increased year-on-year, non-standards decreased, and the risk appetite for credit bonds continued to decline.The balance of assets held by wealth management products was 31.81 trillion yuan, and the total liabilities were 2.66 trillion yuan. The leverage ratio of wealth management products was 108.82%, which continued to drop by 1.92 percentage points from the 111.5% level at the end of June 2021, but was 107.37% at the end of 2021. % level edged up by 1.45 percentage points. From the perspective of asset allocation of major categories, 2) the three types of assets with the largest proportion of non-guaranteed wealth management investment are bonds (including interbank certificates of deposit), non-standardized debt assets, and cash and bank deposits. The proportion of deposits, inter-bank lending and repurchase agreements increased, while the proportion of non-standard and equity continued to decline. 2) Among bond assets, credit bonds are still the main investment assets, but the proportion has declined, and the credit bond rating center of wealth management holdings continues to rise. 3) The proportion of non-standard allocations has continued to decline since the second half of 2021.
Looking forward to the future, the net worth transformation has been basically completed. We believe that in the short term, the product innovation of various institutions may still maintain a steady increase in the scale of wealth management, but the fluctuation of the scale may also increase. At the same time, the structural increase in the allocation of standardized coupon assets will lead to a steady increase in demand for credit bonds, but structurally, its risk and duration preference will remain low.Judging from the situation in 2022, the net worth transformation of existing wealth management products has been basically completed, and the proportion of net worth products in the remaining balance of wealth management products has risen sharply to more than 95%. At the same time, we believe that product innovation of banks or wealth management companies has a strong incentive to seize market share, which will help maintain the stability of wealth management scale in the future, and may even continue to grow. Therefore, on the investment side, we believe that the overall demand for credit bonds may remain stable, or even increase in structure. However, we believe that the net worth products are essentially different from the previous capital pool operation mode, and the tolerance for credit defaults and valuation fluctuations may decrease, resulting in the credit risk and duration preference of wealth management may remain low.
The regulatory policies changed beyond expectations, and the scale of wealth management fluctuated greatly.
text
The scale is stable but the fluctuation is increasing, and the non-standard proportion continues to decline
1. The scale of non-guaranteed wealth management in the whole market continued to grow, and the products of wealth management subsidiaries accounted for over 65%
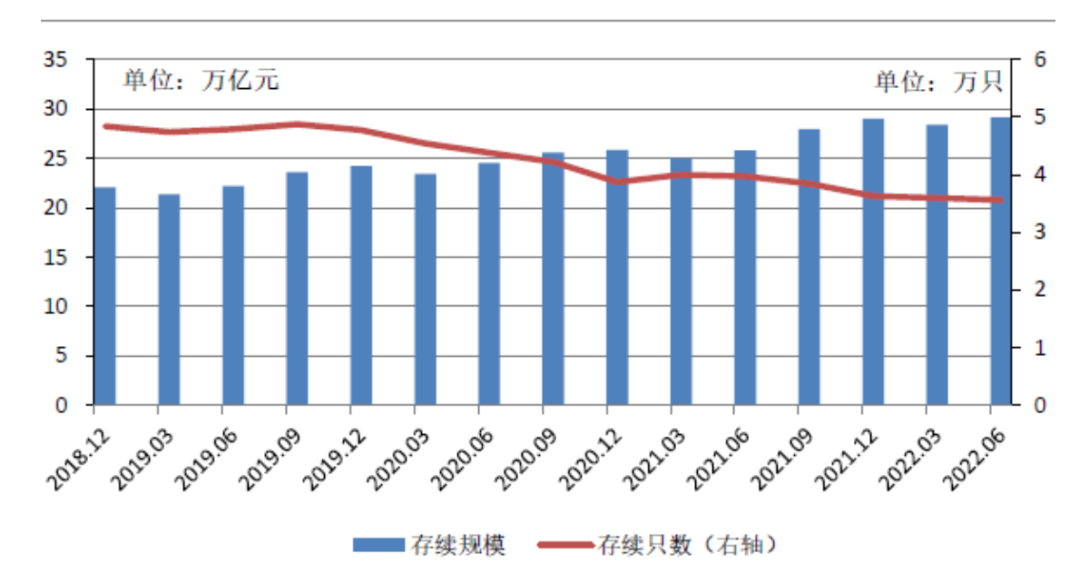
1. The scale of non-principal-guaranteed wealth management increased by about 13% compared with the end of June 2021, and reached 29.15 trillion yuan by the end of June 2022, a slight increase of 0.52% compared with the end of 2021. Except for wealth management companies and rural financial institutions, the existing scale of other institutions is higher than that of 2021. declined at the end of the year. It is worth noting that the scale of products of wealth management companies has expanded, and the current balance of surviving accounts for more than 65%, and the proportion of their internal self-issued products has continued to rise.
According to the 2022 wealth management semi-annual report, as of the end of June 2022, there were 35,600 wealth management products in existence, with a product scale of 29.15 trillion yuan, a year-on-year increase of 12.98%. From the perspective of quarterly changes, the end of June 2022 is slightly up 0.52% from the 29 trillion yuan at the end of 2021, and 2.75% higher than the 28.37 trillion yuan at the end of the first quarter of 2022. From the perspective of changes in the number of products, the number of existing products has continued to decline since June 2021 due to the continuous growth of the scale of single wealth management products.
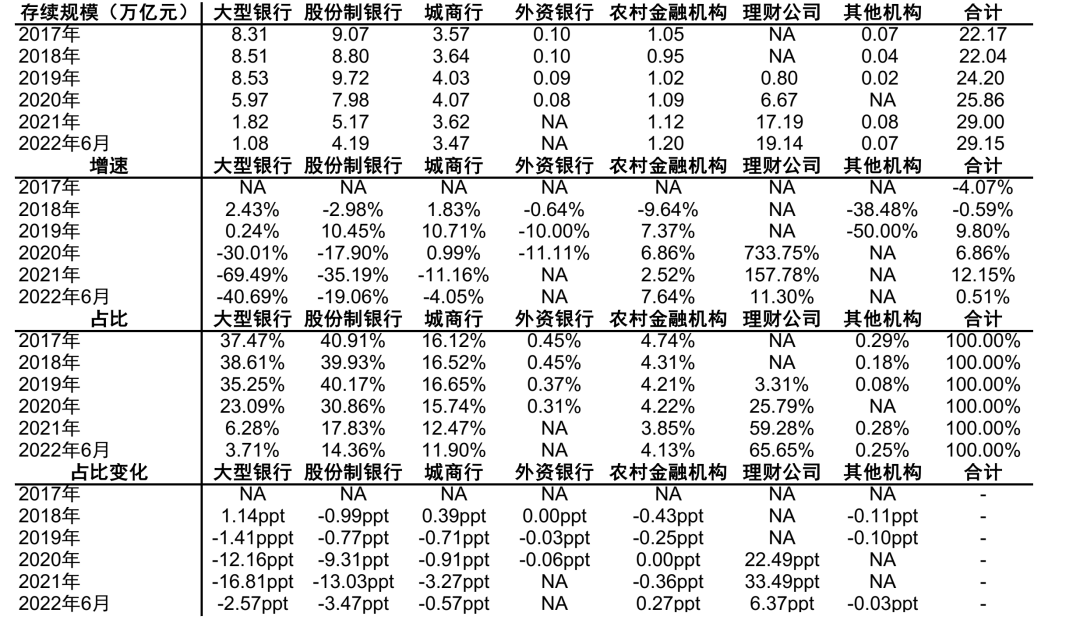
Structurally, the scale of surviving products of banking institutions decreased by 37.1% year-on-year to 9.94 trillion yuan, down 15.25% from the end of 2021, accounting for 34.1%, while the scale of surviving wealth management products of wealth management companies increased by 91.18% year-on-year, up 11.3% from the end of 2021. %, has risen to 19.14 trillion yuan, accounting for 65.65%.With the rapid contraction of the product scale of large banks and joint-stock banks by more than 15%, the current balance of wealth management companies has exceeded 65%.
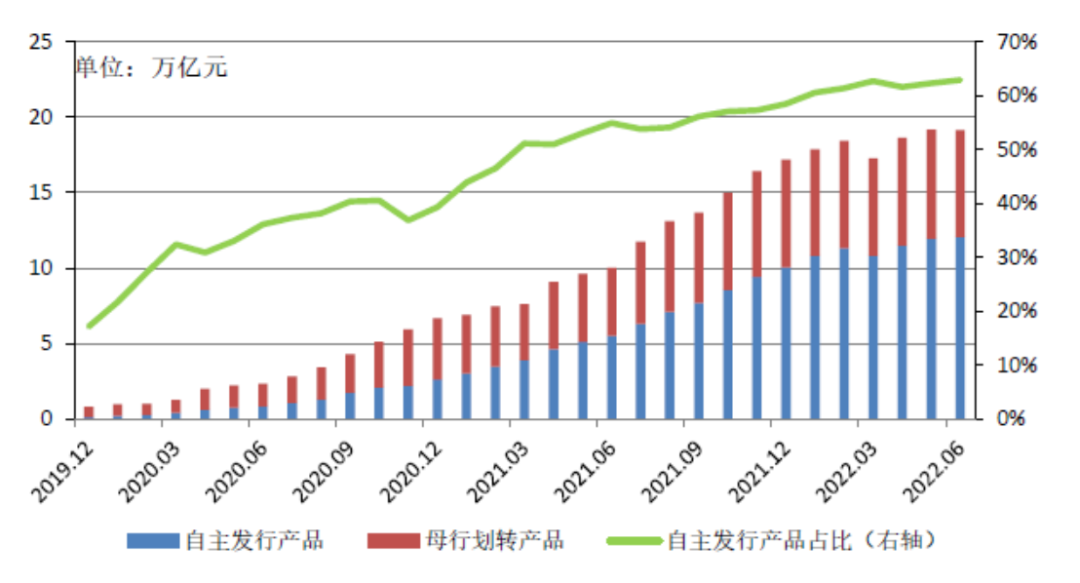
Cumulative amount of new products raised by wealth management companies in the first half of 2022[1]It reached 26.1 trillion yuan, a year-on-year increase of 42.2%, ranking first among all types of institutions, reaching 54.46%. With the expansion of the scale of newly issued products, the proportion of self-issued products of wealth management companies has continued to increase, reaching 62.94% by the end of June 2022, an increase of 8.02 percentage points over the same period of the previous year.
Chart 1: Non-principal guaranteed bank wealth management balance and year-on-year growth rate
Chart 2: Quarterly Balance of Wealth Management of Non-Principal Guaranteed Banks
 Source: China Wealth Management Network, CICC Research
Chart 3: Products issued by wealth management companies and transferred by parent banks
 Source: Wind, CICC Research
2. In the first half of 2022, only the surviving scale of wealth management products of rural financial institutions and wealth management companies will increase, and the scale of medium and large banks will decrease the most, and the proportion will also decline the most, or it may be related to the transfer of products to wealth management companies.
As shown in the figure below, wealth management companies still maintain rapid growth, while among banking institutions, only rural financial institutions have expanded in scale. Specifically, among the institutions that have shrunk in size, the scale of non-principal guaranteed wealth management products of large banks, joint-stock banks and city commercial banks has dropped by 40.69%, 19.06% and 4.05% respectively compared with the end of 2021, and the largest reduction is still large banks. On the whole, due to the low base of large banks, the annualized pressure reduction rate exceeds that of the whole year of 2021, and the pressure reduction rate of other types of banks is basically the same as that of the whole year of 2021. Among the scale-expanding institutions, rural financial institutions continued to expand, with an increase of 7.64% compared with the end of 2021, and the growth rate increased, while the wealth management subsidiaries increased by 11.3% compared with the end of 2021.
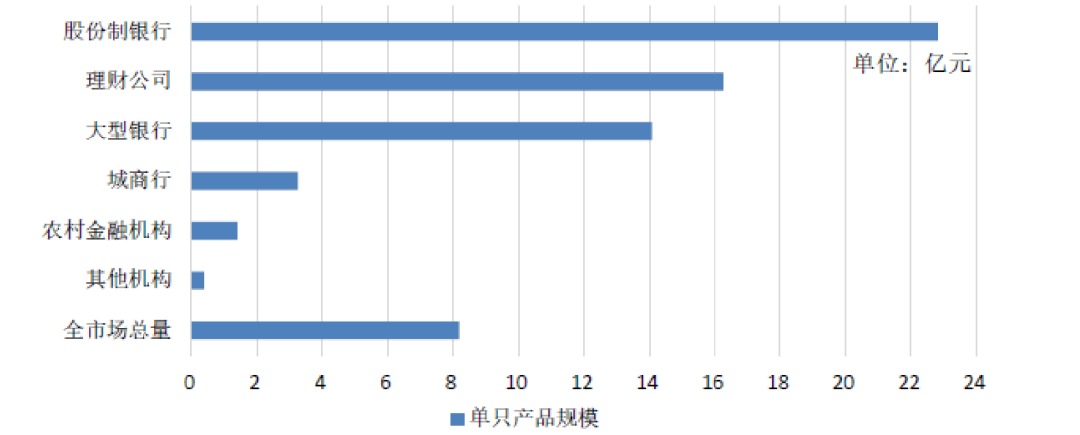
In terms of proportion, as of the end of June 2022, wealth management subsidiaries accounted for the highest proportion, reaching 65.65%, an increase of 6.37 percentage points from the end of the previous year; large banks fell sharply with the existing scale, and the proportion fell to 3.71%, a decrease of 2.57% from the end of the previous year. percentage points, and its proportion has dropped to the bottom of all banking institutions; the proportion of joint-stock banks decreased by 3.47 percentage points compared with the end of the previous year, reaching 14.36%; the proportion of city commercial banks decreased slightly by 0.57 percentage points compared with the end of the previous year, reaching 11.9%, while the proportion of agricultural The proportion of commercial banks rose by 0.27 percentage points to 4.13%. In addition, from the perspective of single scale, as of the end of June 2022, the average scale of a single wealth management product reached 818 million yuan, a year-on-year increase of 25.88%. Among them, joint-stock banks have the largest single scale, reaching 2.281 billion yuan, wealth management companies ranked second, reaching 1.626 billion yuan, and the single scale of large banks is also more than 1.4 billion yuan. However, other institutions, including city commercial banks and rural financial institutions, have a single scale of less than 400 million yuan, and the differences between institutions are relatively large.
Figure 4: Scale growth rate and proportion of non-principal-guaranteed wealth management of various types of institutional banks from 2017 to the end of June 2022
 Source: China Wealth Management Network, CICC Research
 Chart 5: Scale of a single product by type of institution at the end of June 2022
 Source: China Wealth Management Network, CICC Research
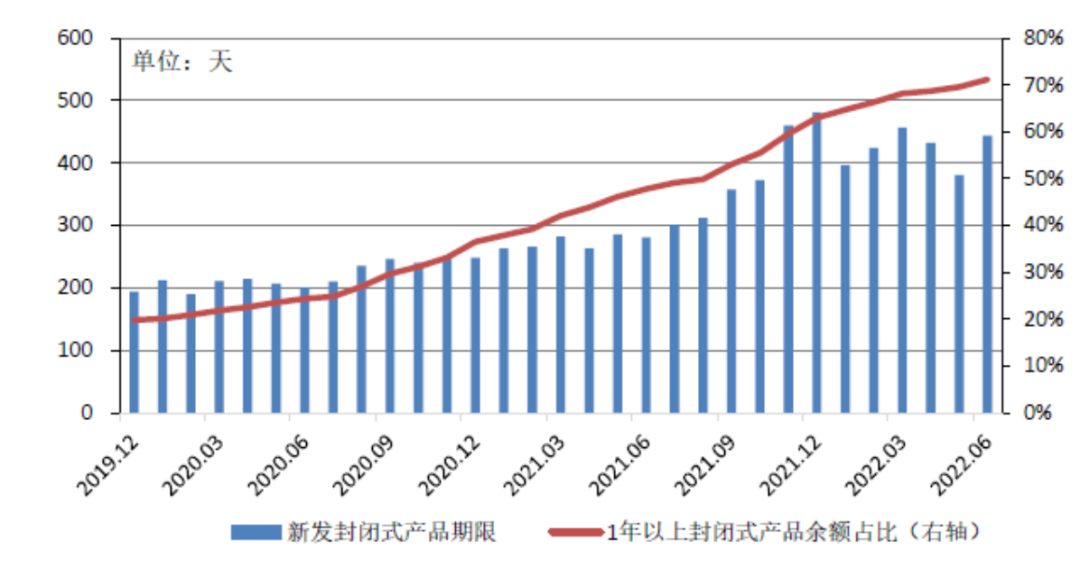
3. Non-guaranteed wealth management mainly focuses on fixed-income products, open-ended products and public offering products. The term of newly issued closed-end products continued to lengthen, and the proportion of closed-end products over one year increased to 71%.
In terms of product types, the proportion of fixed income in wealth management products in the whole market has increased at a high level. As of the end of 2021, the remaining balances of fixed income, hybrid and equity products accounted for 92.34%, 7.38% and 0.28% respectively. As of June 2022 At the end of the month, the above three categories of products accounted for 93.83%, 5.9% and 0.27% respectively. Among them, the proportion of fixed income products increased by 1.5 percentage points compared with the end of the previous year, while the proportion of mixed products and equity products decreased by 1.48 percentage points and 0.01 percentage points respectively.
From the perspective of the product application and redemption opening period, open-end wealth management is still the main force in non-guaranteed wealth management, and its proportion is increasing. As of the end of 2021, the proportion of open-end and closed-end wealth management is 82% and 18%, respectively. At the end of June 2022, the two The proportion of those who are 83.3% and 16.7% respectively. The proportion of open-ended products in the products of wealth management subsidiaries is relatively low, reaching 82.84%.
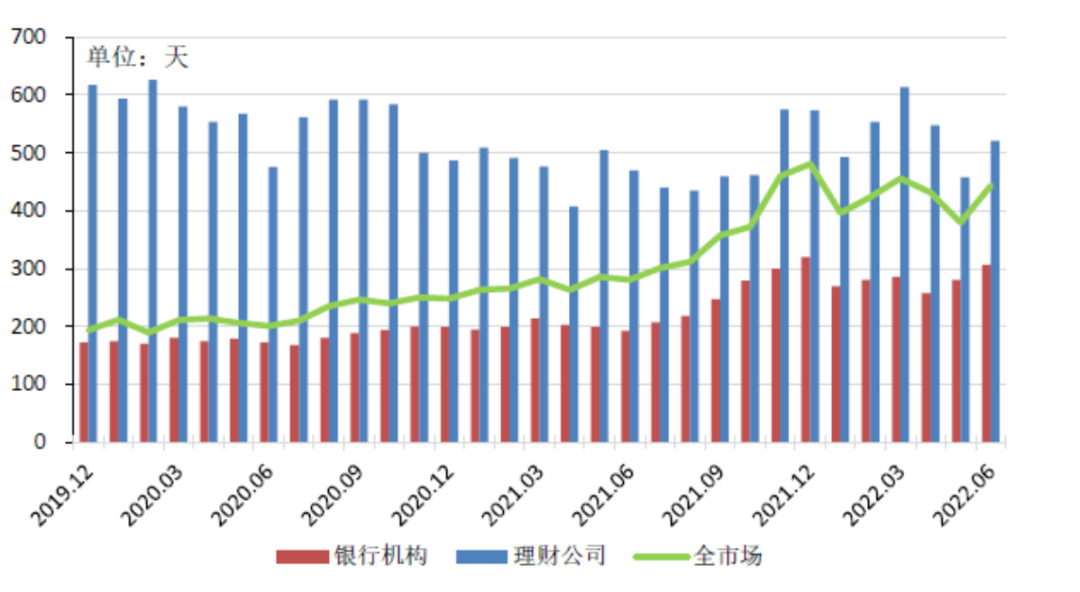
Among the closed-end products, the weighted average duration of newly issued closed-end products in 2022 will increase, reaching 443 days by the end of June, a year-on-year increase of 57.65%, and a decrease of 8% compared with the end of 2021. Among them, the weighted average maturity of wealth management company products increased by 10.85% year-on-year to 521 days, down 9.2% from the end of 2021. The absolute level of maturity exceeds the industry level, but the month-on-month decline is also slightly higher; while the weighted maturity of banking institution products is only 307 days, but year-on-year. An increase of 59.07%, a large year-on-year increase and a decrease of 4% from the end of 2021. Among the surviving products, the proportion of the balance of products with more than 1 year has also continued to grow, reaching 71.15% by the end of June 2022, an increase of 23 percentage points year-on-year, and an increase of 8 percentage points from the beginning of the year. Structurally, the majority of products are still 1-2 years old. .
From the perspective of fundraising methods, public wealth management is still the absolute main body. At the end of 2021, the surviving balance of public wealth management accounted for 96%, and it rose to 95.95% at the end of June 2022, with little change from the previous month. In terms of institutions, among the products issued by banking institutions, public wealth management accounts for 98.2%, while wealth management subsidiaries account for 94.8%, which is relatively low.
Exhibit 6: Market-wide Closed-End Product Duration
 Source: China Wealth Management Network, CICC Research
Chart 7: Newly Issued Closed-End Product Term of Banking Institutions and Wealth Management Companies
 Source: China Wealth Management Network, CICC Research
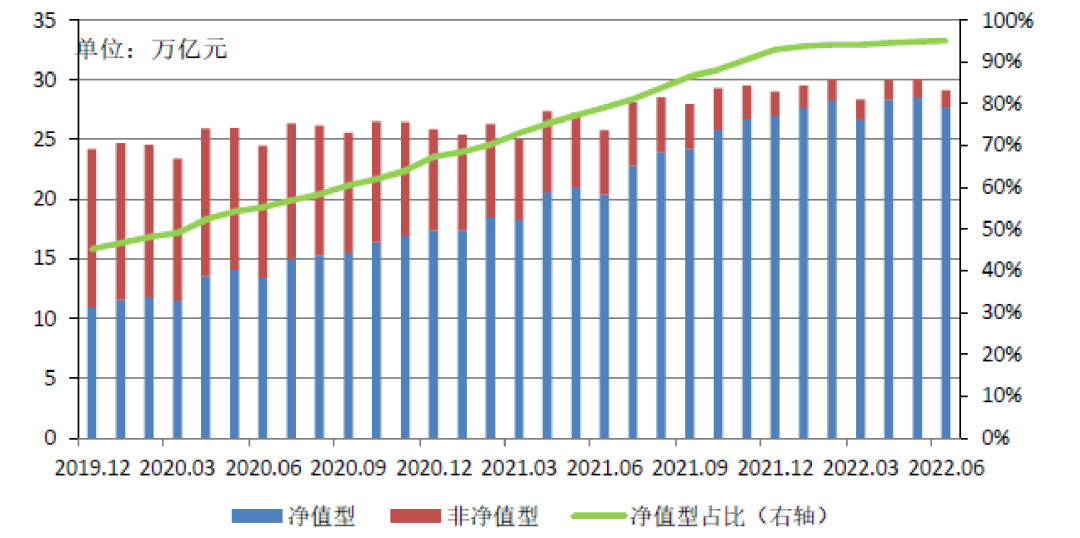
4. In the first half of 2022, the scale and proportion of net worth products will continue to increase.
As of the end of June 2022, the existing balance of net worth products in the whole market was 27.72 trillion yuan, a slight increase of 3% from the end of 2021. In terms of proportion, net worth products accounted for 95.09% of the remaining balance of all wealth management products at the end of the same period, an increase of 2.12 percentage points compared with 2021.
Figure 8: Transformation of wealth management products to net worth
 Source: China Wealth Management Network, CICC Research
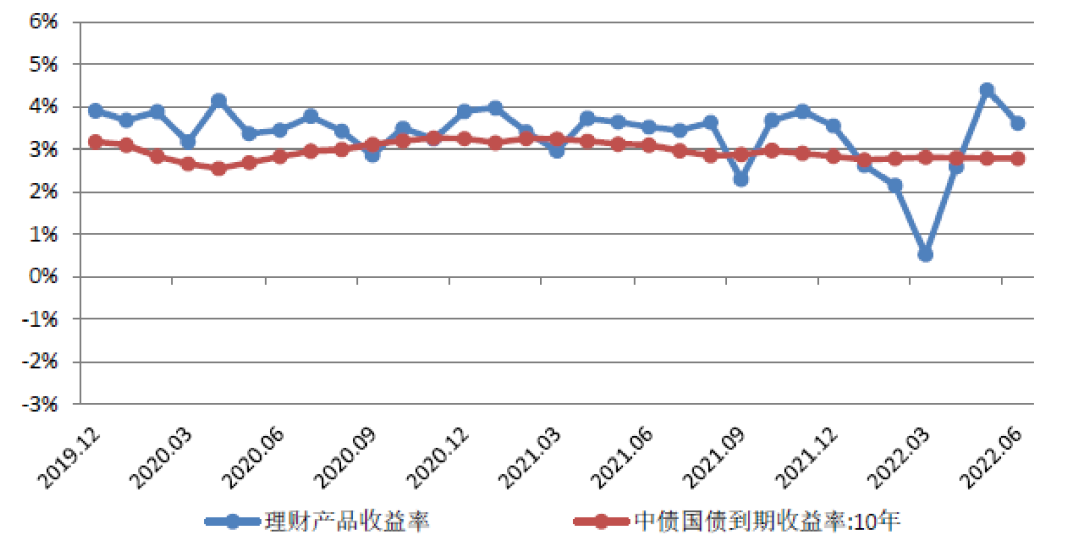
5. In terms of yield, the weighted yield of wealth management products at the end of June 2022[2]It was 3.61%, an increase of 9bp over the same period of the previous year, and an increase of 6bp over the end of the previous year.
According to the wealth management annual report, as of the end of June 2022, the weighted average yield of wealth management products was 3.61%, an increase of 9bp over the same period of the previous year, an increase of 6bp over the end of the previous year, and 83bp higher than the yield of 10-year treasury bonds over the same period.
Chart 9: Trend of Weighted Average Yield of Wealth Management Products
 Source: China Wealth Management Network, CICC Research
2. Asset allocation: The proportion of bonds increased year-on-year, non-standard decreased, and the risk appetite for credit bonds continued to decline
As of the end of June 2022, the balance of assets held by wealth management products including wealth management subsidiaries was 31.81 trillion yuan, and the total liabilities were 2.66 trillion yuan. The leverage ratio of wealth management products was 108.82%, which was 111.5% at the end of June 2021. It continued to decline by 1.92 percentage points, but slightly increased by 1.45 percentage points from the level of 107.37% at the end of 2021. The leverage level is not as high as that of other asset managers, which is related to the large scale of wealth management and the overall difficulty in increasing leverage. From the perspective of asset allocation of major categories, standardized assets are still the main investment direction of non-guaranteed wealth management. Compared with the same period of last year, bonds (including inter-bank certificates of deposit), cash and bank deposits, inter-bank lending and repurchase agreements have increased. . The proportion of equity assets investment has dropped significantly.
1) The three types of assets with the largest proportion of non-principal-guaranteed wealth management investments are bonds (including interbank certificates of deposit), non-standardized debt assets, and cash and bank deposits. The proportion of sales increased, and the proportion of non-standard and equity continued to decline.
As of the end of June 2022, the top three types of assets in bank wealth management investment are bonds (including interbank certificates of deposit), non-standardized debt assets, and cash and bank deposits, accounting for 67.84%, 7.14% and 14.1%, respectively, accounting for 67.84%, 7.14% and 14.1% of the total. than 89.08%.
Compared with the non-guaranteed wealth management data disclosed at the end of June 2021, the proportion of bonds continued to increase by 0.53 percentage points, and the proportion of non-standard assets decreased by 5.94 percentage points. The proportion of cash and bank deposits rose by 4.43 percentage points. The proportion of equity assets continued to drop by 0.87 percentage points, and other assets including public funds (mainly including new investable assets, financial derivatives, QDII, financial direct investment tools, alternative assets, commodity assets, etc.) accounted for Compared with 4.71%, it also increased by 1.47 percentage points year-on-year. Compared with the end of 2021, the proportions of bonds, non-standards, equity and interbank placements, and repurchase and resale all decreased by 0.55 percentage points, 1.26 percentage points, 0.06 percentage points, and 0.9 percentage points, respectively. Only cash and bank deposits. rose 2.7 percentage points.
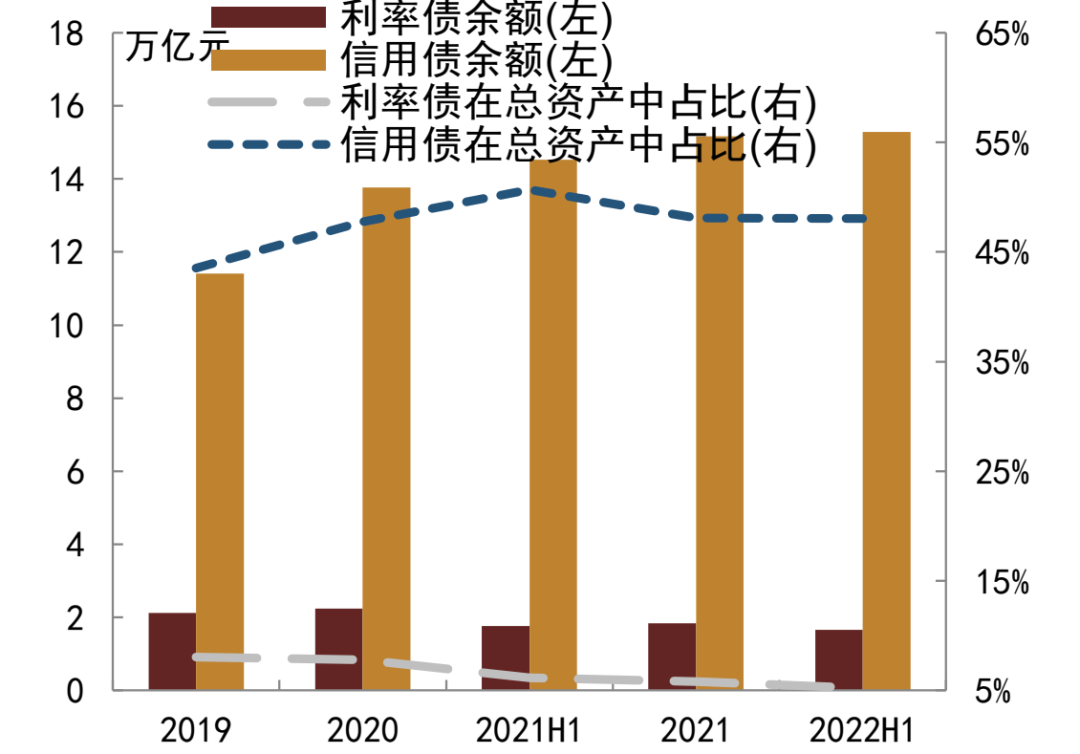
2) Among bond assets, credit bonds are still the main investment assets, but the proportion has declined, and the credit bond rating center of wealth management holdings continues to rise.
As of the end of June 2022, the balance of bond investment (including interbank certificates of deposit) was 21.58 trillion yuan, of which interest rate bonds and credit bonds accounted for 5.19% and 48.07% of the investable amount of non-principal guaranteed wealth management, respectively. Compared with the end of 2021, the proportion of the two decreased by 0.62 percentage points and 0.06 percentage points respectively. Compared with the end of June 2021, the decline was even more pronounced, falling by 0.95 percentage points and 2.63 percentage points, respectively. However, from the perspective of the absolute scale of allocated credit bonds, it is still showing a growth trend, reaching 15.29 trillion yuan at the end of June 2022, an increase of 0.73 trillion yuan and 0.12 trillion yuan respectively year-on-year and month-on-month.
In terms of the distribution of credit bond ratings, the scale of high-grade bonds with AA+ rating and above held by Wealth Management reached 13.01 trillion yuan, accounting for 85.09% of the total credit bond holdings, an increase of 1.54 percentage points year-on-year and a month-on-month increase of 1.04 percentage points from the end of 2021. It reflects that the risk appetite for financial management and credit remains low.
3) The proportion of non-standard allocations has continued to decline since the second half of 2021.
Since the China Banking Regulatory Commission issued a draft for comments on wealth management supervision in 2016, the supervision has tightened restrictions on non-standard assets such as wealth management funds investment, and the scale of non-standard assets has begun to enter a downward channel. As of the end of June 2022, the amount of non-standard assets held in all non-principal-guaranteed wealth management was about 2.27 trillion yuan, accounting for 7.14% of the balance of non-principal-guaranteed wealth management. Compared with the end of 2021, the amount of non-standard assets held in all non-guaranteed wealth management is about 2.62 trillion yuan, a decrease of 0.35 trillion yuan. It accounted for 8.4% of the balance of non-principal-guaranteed wealth management, a further decrease of 1.26 percentage points.
Figure 10: Changes in the allocation ratio of bank wealth management assets
Source: Banking Financial Management Registration and Custody Center,CICCResearch
Note: Wealth management annual reports generally only disclose the proportion of various types of assets in the balance of wealth management investment assets, but do not directly disclose the absolute amount of various assets held by wealth management, and there may be certain differences between the “balance of wealth management investment assets” and “the remaining balance of wealth management products”. difference. The classification scale data for 17-18 years in the above table is estimated by multiplying the balance of wealth management products at the end of the year by the relevant ratio. Since the balance of wealth management in 2018 and 2019 is a scale of non-guaranteed wealth management, it is not comparable to the total balance of wealth management including capital protection in previous years, nor is the classified data comparable.
Chart 11: Wealth management asset allocation at the end of 2021
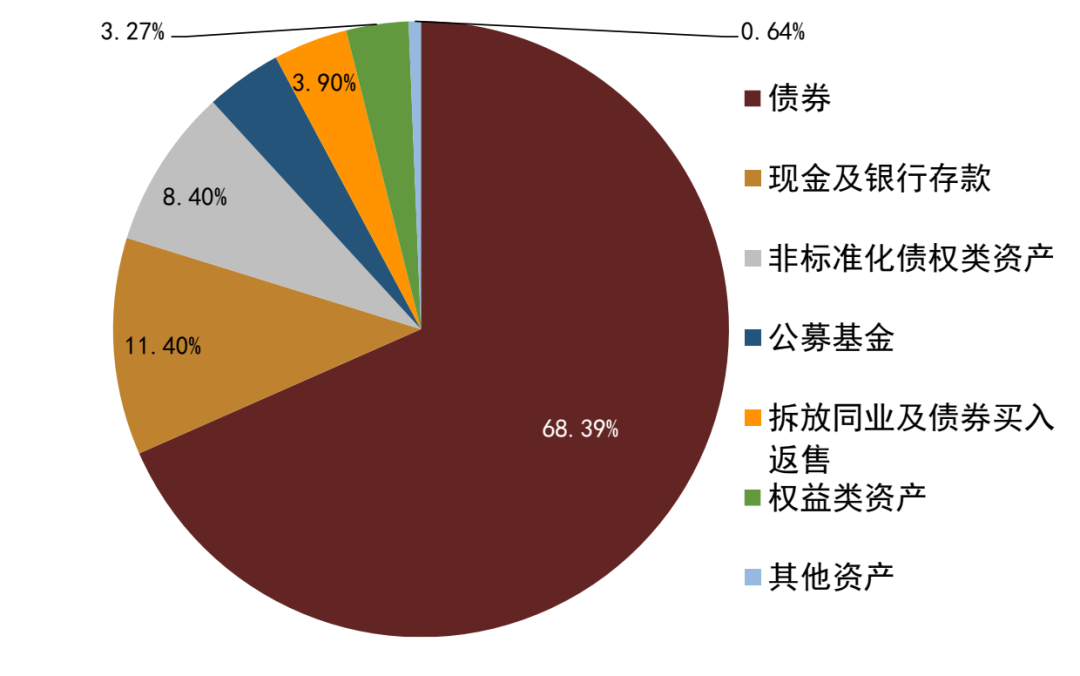 Source: Banking Wealth Management Registration and Custody Center, CICC Research
Chart 12: Wealth management asset allocation at the end of June 2022
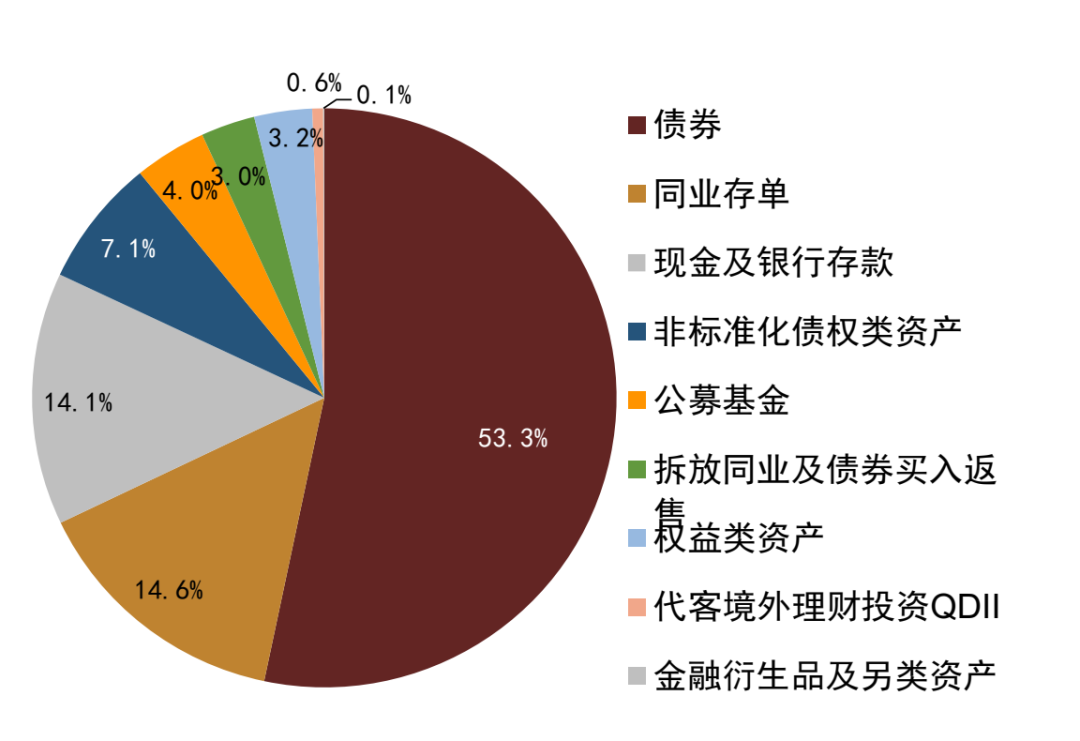 Source: Banking Wealth Management Registration and Custody Center, CICC Research
Chart 13: Changes in holding interest rate bonds and credit bonds
 Source: Banking Wealth Management Registration and Custody Center, CICC Research
Chart 14: AA+ rated and above credit bonds held
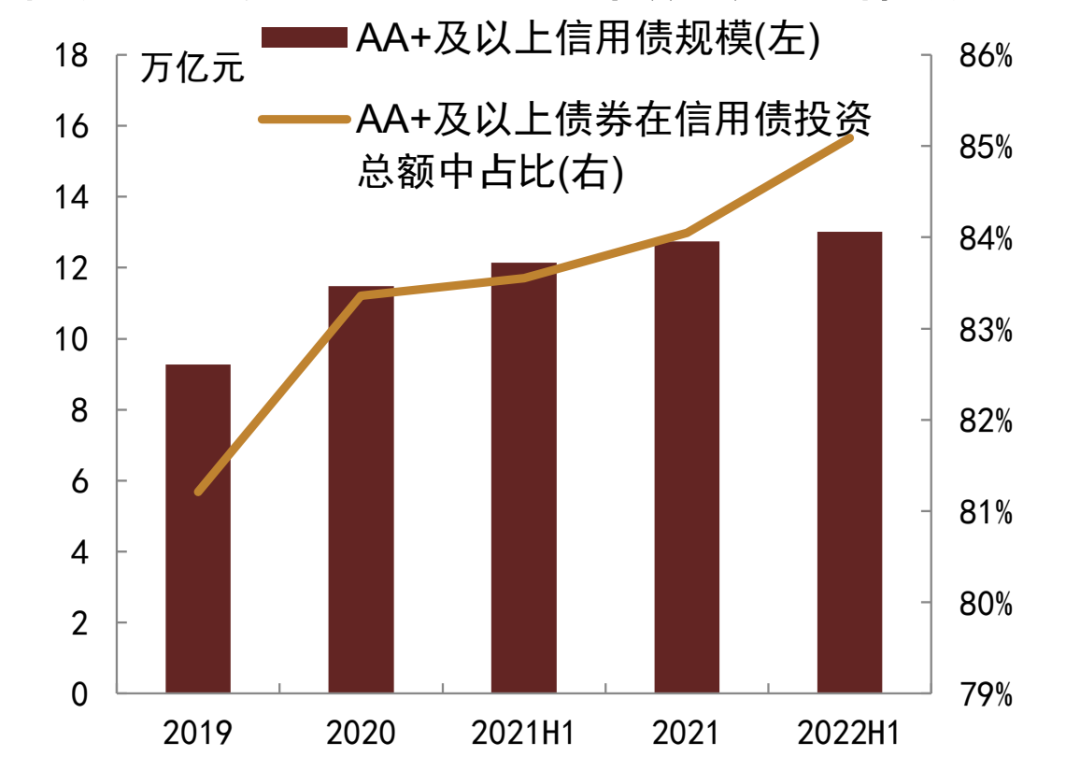 Source: Banking Wealth Management Registration and Custody Center, CICC Research
3. Summary and Outlook
In general, non-principal-guaranteed wealth management in the first half of 2022 is characterized by a slight increase in scale and continued acceleration of net worth transformation, but the fluctuation in scale has increased. On the allocation side, the proportion of bonds increased year-on-year, while the proportion of non-standard and equity assets continued to decline.In the first half of 2022, the scale of non-guaranteed wealth management including wealth management companies increased slightly, but the volatility increased. Affected by the volatility of the equity market in March this year, wealth management faced greater redemption pressure, and the stock scale also experienced a short-term decline. However, since April, the demand for relatively more stable pure bond varieties has rebounded significantly, and the scale of wealth management has rebounded significantly. Among them, the scale of wealth management companies continued to expand, and the balance of wealth management products accounted for nearly 66% by the end of June. We believe that in the future, wealth management products will also fully realize the transformation of net worth, and the scale and market share of wealth management company products will continue to increase. On the asset allocation side, the proportion of bonds increased year-on-year but fell slightly month-on-month, the proportion of credit bond investment also declined, and the non-standard scale has dropped significantly since the second half of 2021.
In 2022, wealth management products will continue to grow in terms of ESG, social responsibility and pensions.In terms of ESG investment, in the first half of 2022, 43 ESG-themed wealth management products were newly launched in the wealth management market, raising a total of over 20 billion yuan. As of the end of June 2022, there were 134 ESG-themed wealth management products in the market, with a balance of 104.9 billion yuan, a year-on-year increase of 1.44 times; the scale of investment in green bonds exceeded 250 billion yuan. In terms of social responsibility products, in the first half of 2022, a total of 56 wealth management products with social responsibility themes such as rural revitalization and public welfare and charity were issued, and funds raised exceeded 16 billion yuan. In terms of pension wealth management, as of the end of June 2022, 27 pension wealth management products have been successfully launched, and 231,000 investors have subscribed for more than 60 billion yuan.
Looking into the future, the net worth transformation has been basically completed. We believe that in the short term, the product innovation of various institutions may still maintain a steady increase in the scale of wealth management, but the fluctuation of the scale may also increase. At the same time, we believe that the structural increase in the allocation of standardized coupon assets will lead to a steady increase in demand for credit bonds, but structurally, its risk and duration preference will remain low.Judging from the situation in 2022, the net worth transformation of existing wealth management products has been basically completed, and the proportion of net worth products in the remaining balance of wealth management products has risen sharply to more than 95%. At the same time, we believe that product innovation of banks or wealth management companies has a strong incentive to seize market share, which will help maintain the stability of wealth management scale in the future, and may even continue to grow. Therefore, on the investment side, we believe that the overall demand for credit bonds may remain stable, or even increase in structure. However, we believe that the net worth products are essentially different from the previous capital pool operation mode, and the tolerance for credit defaults and valuation fluctuations may decrease, resulting in the credit risk and duration preference of wealth management may remain low.
[1] Including the cumulative subscription amount of open-end wealth management products during the 2022 opening cycle.
[2] The rate of return of net-value products is the annualized percentage of changes in the net value of the product during the statistical period; the rate of return of open-ended non-net-worth products is the latest expected rate of return during the statistical period; the rate of return of closed-ended non-net-worth products is the product issuance expected rate of return. The product balance is used as the weighted average among different wealth management products.
This article is taken from:“The scale is stable but the volatility is increasing, and the proportion of non-standards continues to decline – Comments on the semi-annual report on wealth management in 2022”, which has been released on August 22, 2022
Wang Haibo SAC Practicing Certificate No.: S0080517040002 SFC CE Ref: BPC512
Wan Xiaoyue SAC Practicing Certificate No.: S0080522070004
Xu Yan SAC Practice Certificate No.: S0080511030007 SFC CE Ref: BBP876
Legal Notices
Swipe up to see full legal notice and QR code

Massive information, accurate interpretation, all in Sina Finance APP