
Haitong SecuritiesStrategy Team May 22Research reportIt is pointed out that since the opening of Shanghai-Hong Kong Stock Connect in November 2014, the correlation between China and the US stock markets has increased, but it is still weak, and the phenomenon of A-shares following the decline is obvious. Since the end of April this year, A-shares have not followed suit after the sharp decline in U.S. stocks, due to the dislocation of the economic cycles of China and the United States and the different valuation positions of the stock market. The big bottom of the 3-4-year cycle of A shares has appeared, and positive factors are accumulating. At this stage, new infrastructure is better, such asdigital economylow-carbon economy, and gradually pay attention to consumption in the future.
Full text of the strategy
[Haitong Strategy]The reverse of A shares and US stocks (Xun Yugen, Zheng Zixun, Yu Peiyi)
Core conclusion:①Since the opening of Shanghai-Hong Kong Stock Connect in November 2014, the correlation between China and the US stock markets has increased, but it is still weak, and the phenomenon of A-shares following the decline is obvious. ② Since the end of April this year, A-shares have not followed suit after the sharp decline in U.S. stocks, due to the dislocation of the economic cycles of China and the United States and the different valuation positions of the stock market. ③ The big bottom of the 3-4-year cycle of A shares has appeared, and positive factors are accumulating. At this stage, new infrastructure is better, such asdigital economylow-carbon economy, and gradually pay attention to consumption in the future.
A-shares and U.S. stocks reverse
In the past two weeks, US stocks have fallen significantly. During the period from 5/9 to 5/20, the Dow Jones Industrial Average fell by 5.0%, the S&P 500 fell by 5.4%,NasdaqThe index fell 6.2%, while the overall performance of A shares was significantly stronger, in the past two weeksCSI 300A cumulative increase of 4.3%,GEM refers torose 7.7%. So why has the recent divergence in the performance of the Chinese and U.S. stock markets? This article analyzes this.
1、Phenomenon: Recently A shares and U.S. stocks began to reverse
Since the end of last year, affected by factors such as the conflict between Russia and Ukraine and the tightening of global liquidity, the domestic and overseas markets have generally fallen from December last year to April this year.NasdaqThe index fell 22.5%, the CSI 300 fell 27.0%, and the ChiNext Index fell 39.7%. Then in the past two weeks, the trend of China and the US stock markets began to diverge significantly. During the period from 5/9 to 5/20, the US stocks fell significantly while the A shares continued to rise.
Historically, the overall correlation between A shares and U.S. stocks is not high, but the decline in U.S. stocks has a great impact on A shares.The continued weakening of U.S. stocks has made some investors worried that the subsequent performance of A-shares will be dragged down. Comparing the historical trends of A-shares and U.S. stocks, it can be found that such concerns are not unreasonable. We calculated the three-month rolling correlation coefficient between the Shanghai Composite Index and the S&P 500. The average value of the correlation coefficient since 1991 was 0.17. After the A-share split share structure reform in 2005, the average value of the correlation coefficient increased to 0.30, while in 2014 After the opening of Shanghai-Hong Kong Stock Connect in November, the average value of the correlation coefficient further increased to 0.40. It can be seen that there is a certain positive correlation between the Chinese and US stock indexes, but the overall correlation is not strong.
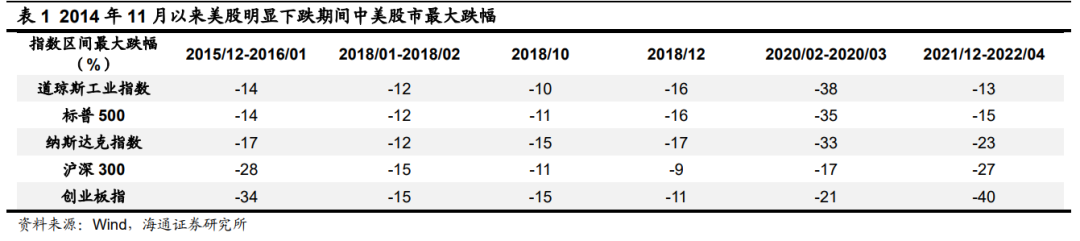
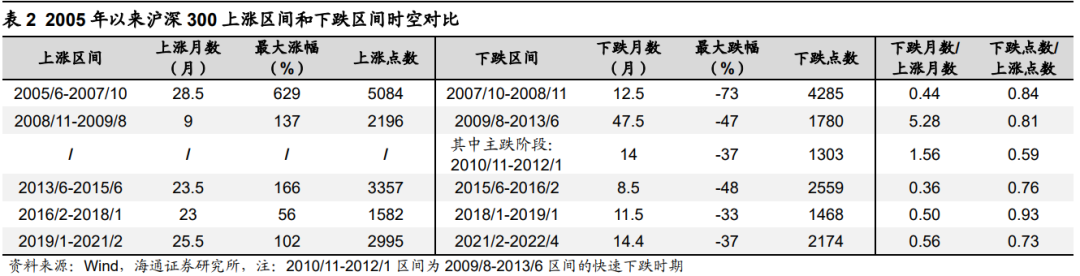
However, by further observing the trend of China-US stock indexes since the opening of Shanghai-Hong Kong Stock Connect in November 2014, it can be found that A-shares may not follow when US stocks rise, but the trend of A-shares tends to be dragged down when US stocks fall sharply. For example, during the period from 15/12 to 16/01, after the Federal Reserve announced a rate hike, the US stocks had a significant correction, with the S&P 500 falling by 14% at the most. During the same period, A-shares suffered a larger decline due to external market and institutional factors, and the CSI 300 fell by 28%; In 2018, due to the disturbance of factors such as the Fed rate hike and Sino-US relations, US stocks fell significantly in January-February, October and December in 2018, and A-shares in the same period also followed suit. The global outbreak of the epidemic in March, and the Russian-Ukrainian conflict from December last year to April this year were superimposed on the Fed raising interest rates. During these time intervals, the Chinese and American stock markets also fell synchronously. For details, see Table 1.
Recently, A-shares have begun to desensitize to the decline of U.S. stocks.However, judging from the recent situation, U.S. stocks have experienced multiple sharp drops of more than 3% in a single day since late April, but when U.S. stocks fell sharply, the trend of A-shares began to run in the opposite direction: for example, the S&P 500 fell on April 26. 3%,NasdaqThe index fell 4%, and the next day on April 27, the CSI 300 rose 3%, and the ChiNext Index rose 6%; on May 9, the S&P 500 fell 3%, and the Nasdaq fell 4%, and the next day 5 On May 10, the CSI 300 rose 1%, and the ChiNext Index rose 2%; on May 18, the S&P 500 fell 4%, and the Nasdaq fell 5%, while on May 19 the next day, the CSI 300 rose 0.2%, The ChiNext index rose 0.5%. Comparing the trends of Chinese and US stock markets since late April, it can be found that A-shares have begun to desensitize to the decline of US stocks recently.
2、Reason: Economic cycles and valuation locations are different
So why can A shares remain resilient when U.S. stocks have fallen sharply recently? We believe that this is mainly due to the dislocation of the economic cycle between China and the United States, as well as the different positions of stock market valuations between China and the United States.
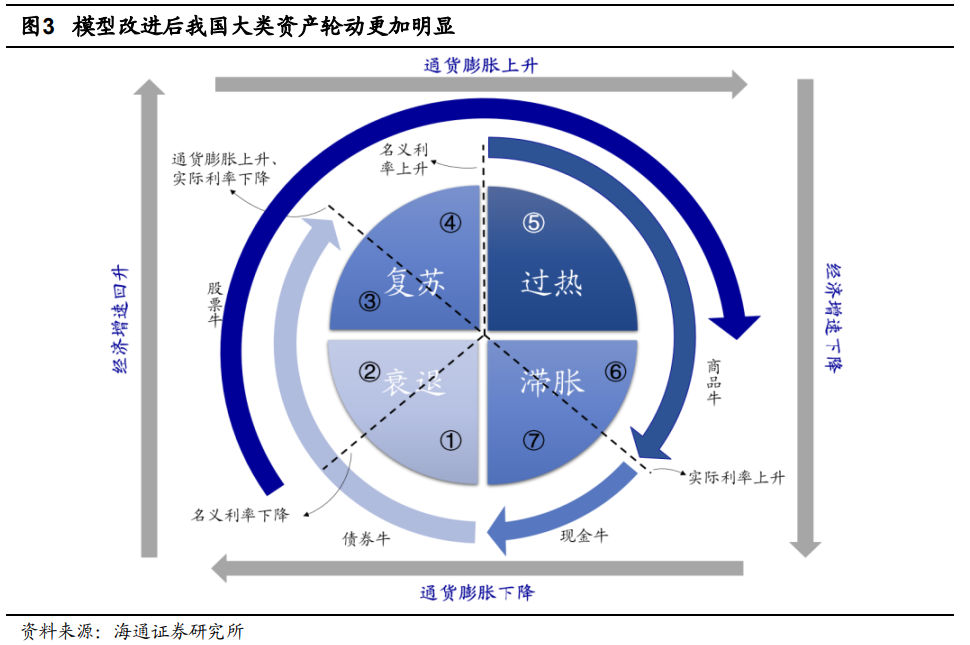
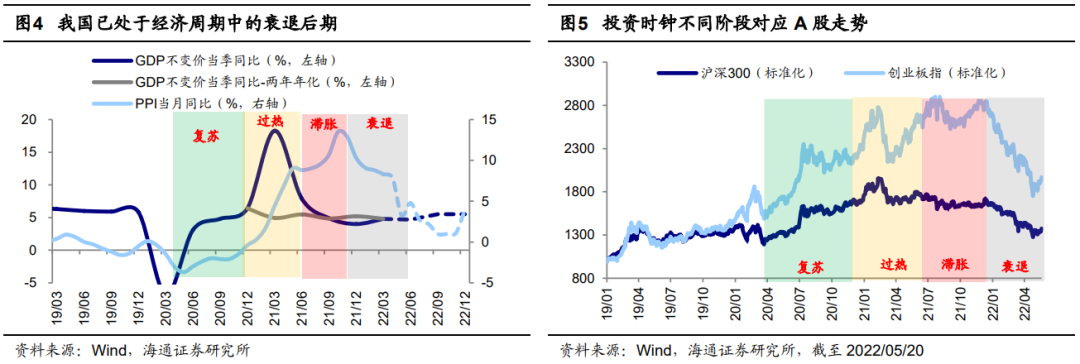
Economic cycle: my country is in the late stage of recession, while the United States is still in a period of stagflation.From the perspective of the economic cycle, what do we need for a rebound to a reversal? As analyzed in -20220504″, referring to the improved version of the investment clock, my country’s economy began to decline from the middle of 21 years, and inflation rose to a high point. Therefore, in the second half of 21 years, my country’s investment clock entered a period of stagflation; and from the end of 21 to the present, my country’s economy has declined. Entering the late stage, and inflation began to decline, it belongs to the pre-recession period of the investment clock. Since the second half of 21, the overall adjustment of A-shares is the reason behind the fact that my country’s investment clock has entered a period of stagflation + pre-recession; and at present, with the steady growth policy continues to increase , my country’s investment clock is entering the late stage of recession. According to the rotation law of major asset classes in the investment clock, the stock market tends to stabilize in the late stage of recession.
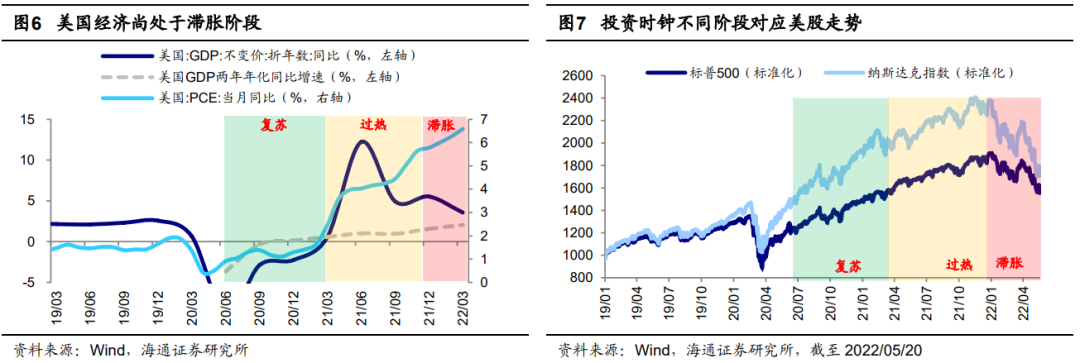
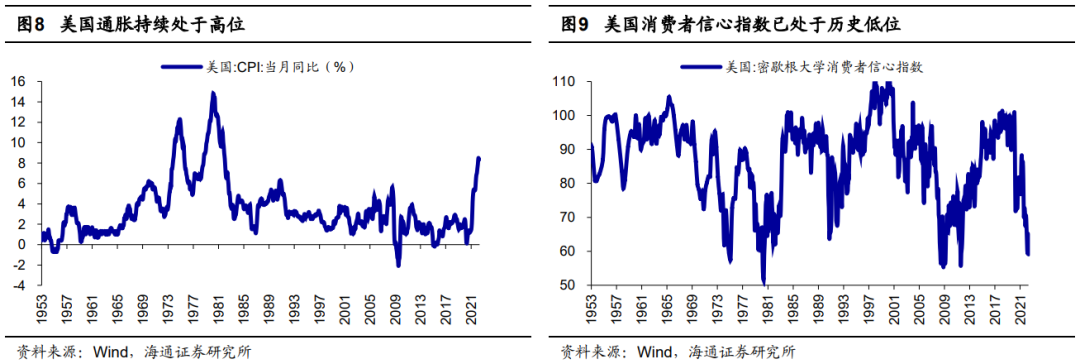
Looking at the United States, the economic recovery of the United States under the impact of the epidemic is later than that of my country, so the rotation of the economic cycle is also slower.Reference US quarterGDPThe year-on-year growth rate and the year-on-year growth rate of PCE in the current month. During the period from 20Q3 to 21Q1, the United States as a whole was in a recovery period where the economic growth rate picked up and inflation was low.ChangheIn the overheating period when the inflation level is rising, the economic growth rate of the United States begins to slow down this year, so the overall US economy has been in a stage of stagflation since the beginning of this year.In recent months, the inflation data in the United States has remained at a high level. In April, the United StatesCPIThe year-on-year rate only edged down to 8.3% from 8.5% in March, raising fears that the Federal Reserve will raise interest rates sharply in response to inflation, pushing the U.S. economy into a recession too early and too quickly. In particular, some economic and corporate earnings data recently disclosed by the United States were weak, which further exacerbated the market’s concerns about the downturn of the US economy.For example, the US ISM manufacturing industryPMIIt fell from 57.1 in March to 55.4 in April, hitting a new low since September in 20 years; as of May 14 this year, the U.S.consumer confidence indexIt has dropped to 59.1%, close to the lowest level in history since 1953; in addition, the US retail leaderwalmartAnnouncement of financial results for the first quarter of fiscal 2023 on May 17, local timeperformancethe data show that its first quarternet profitdown 25% year-on-year, on the same daywalmartIt closed down 11 percent, its biggest one-day drop since 1987.
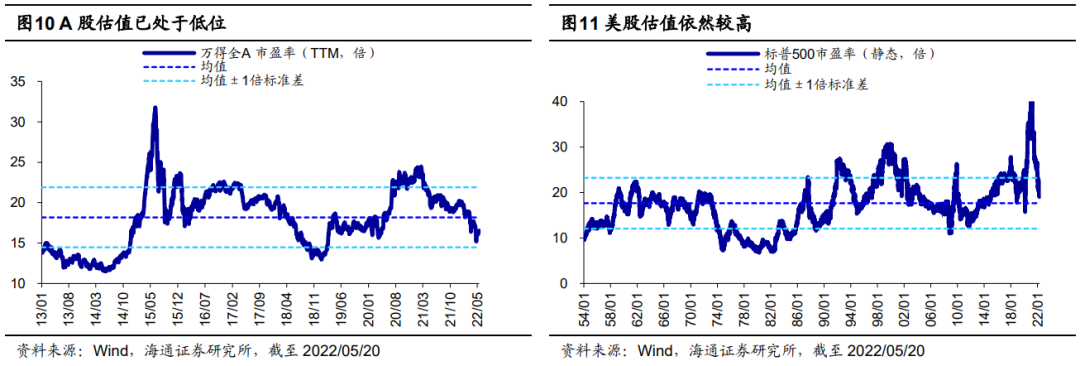
Valuation level: A-share valuations are already low, while U.S. stock valuations are still at a moderately high level.In addition to the macro environment, valuation levels are also one of the factors that lead to the divergence of the performance of Chinese and US stock markets. Let’s first look at A-shares. After continuous adjustment, the valuation has been at a historically low level. In April this year, when A-shares reached the low point of the year, the PE (TTM, the same below) of Wonderquan A was 15.2 times. After 2 complete bull-bear cycles, we calculated the historical quantile of A-share valuation from 13 years. The data shows that the current A-share PE is at a historical quantile of 26% from low to high in 13 years, which is close to 13 years. The position where the mean is one standard deviation down. Even though A-shares have rebounded significantly recently, as of 2022/05/20, the PE of Wande Quan A is still only 16.5 times, which is still a long way from the average PE of 18.2 times in the past 13 years. % historical quantiles. If starting from 2005, A-shares have gone through 4 complete bull-bear cycles so far, and the current A-share PE is only at a historical quantile of 27% from low to high since 2005.
Different from A-shares, after the valuation of U.S. stocks has experienced a sharp correction, the current PE (static, the same below) of the S&P 500 is still 19.0 times, which is still at a moderately high level in history. Since the bull-bear cycle of U.S. stocks is relatively long, we chose 1954, when the earliest valuation data began, as the starting point. So far, U.S. stocks have gone through about 4 rounds of bull-bear cycles. At present, the S&P 500 PE is still at 65% of its historical score since 1954. bit. In addition, due to the overall rise of the US stock valuation center after 1990, we start from 1990 to calculate, so far US stocks have experienced about 2 complete bull and bear cycles, and the S&P 500 PE is currently at a historical quantile of 42% since 1990. . Therefore, on the whole, the current U.S. stock valuation as a whole is at a historically moderately high level.
On the whole, the United States is still in a period of stagflation with declining economic growth momentum and high inflation. At the same time, it is also facing the pressure of tightening by the Federal Reserve in terms of policy, and my country is already in the late stage of recession of the policy-backed economy, so the macro environment of A shares should be better. In US stocks; in addition, in terms of market microstructure, the valuation of A shares is already at a low level, while the valuation of US stocks is still at a moderately high level, and the difference in valuation positions also explains to a certain extent the recent trend of US stocks and A shares. Start “reversing”.
3、Positive factors for A shares are accumulating
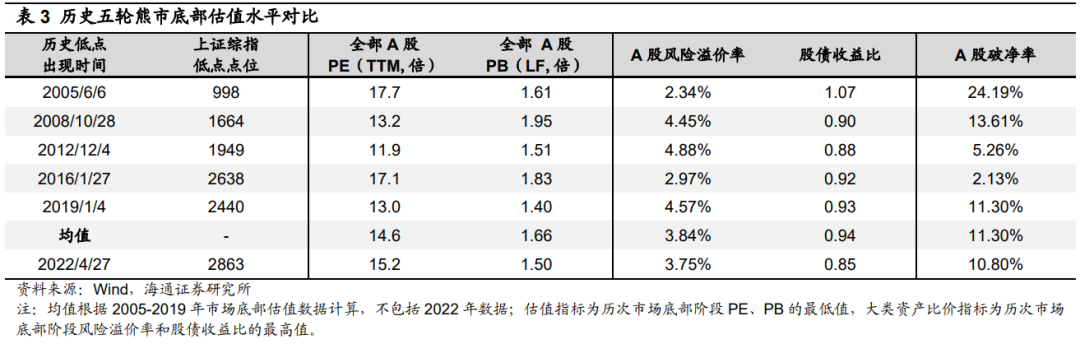
The big bottom of the market once every 3-4 years has appeared.In late April, our analysis of many reports pointed out that the bottom area of the market has appeared. For details, see “FromfundThe performance depends on the market adjustment process – 20220424″, “What are the conditions for a rebound to a reversal? -20220504”, “Position Analysis of Various Investors-20220516”, etc. Looking back at this round of A-share declines, the index level has started one after another in February 2021. The CSI 300 and the Shanghai Composite Index reached highs on 21/2/18, the ChiNext Index reached highs on 21/7/22, and the collective accelerated decline from 21 Starting from /12/13, it originated from two gray rhinos (the pace of interest rate hikes in the United States has accelerated, and the epidemic in China has rebounded sharply) + one black swan (the conflict between Russia and Ukraine). The essence of this round of decline stems from the economic cycle. Historical data shows that the stock market tends to decline in the early stage of stagflation + recession, and the bear market that occurs in 3-4 years is an inevitable stage of the cycle. It is precisely based on historical research that at the end of last year, we proposed that the market is facing downward pressure this year. In the past three years, we have repeatedly analyzed and proposed that A shares may be similar to US stocks, rising for three years and falling for one year. 2020 China Capital Market Outlook – 20211211″, “22 Year Outlook: Our Three Special Judgments – 20211219”. From the analysis of the macroeconomic cycle and the bull-bear cycle of the stock market, the low point at the end of April has a high probability of being the bottom of the market: From the perspective of the macroeconomic cycle, the stock market tends to stop falling in the late stage of the recession, and the domestic growth stabilization policy continues to increase, especially the 429 central political The bureau meeting clarified that the goal of steady growth remains unchanged, and this cycle has a high probability of entering the late stage of recession. From the perspective of the bull-bear cycle of the stock market, compared with the previous bear market declines, the decline of the CSI 300 has continued for 14.4 months (21/02-22/04), with a maximum decline of 37%. The time and space are very significant. Looking at indicators such as debt-to-income ratio and net-breaking ratio, compared with the past five historical bottoms, the current market is already in a large bottom area (see Table 3 for details).
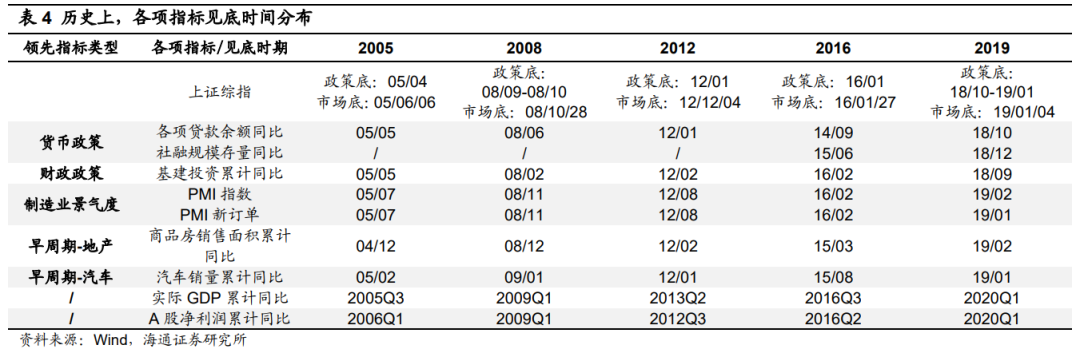
Positive factors are accumulating.The bottom area of the market has now been found, and looking back on history, the bottom shape is complex and diverse. Historically, there are U-shaped (the second half of 2005), deep V-shaped (the end of October 2008, the beginning of January 2019), W-shaped (12 -13 years, lower back angle), gentle shallow V shape (end Jan 16).When to confirm that the market moves from the bottom to the right (from a rebound to a reversal) or to closely follow the five major signals: the year-on-year social financing stock/loan balance year-on-year (reflecting thecurrencypolicy), the cumulative year-on-year infrastructure investment (reflecting fiscal policy), PMI/PMI new orders (reflecting the manufacturing industry), the cumulative year-on-year sales area of commercial housing (early-cycle industries), and the cumulative year-on-year vehicle sales (early-cycle industries). The month with the lowest point in the index over the past five times corresponds to 3 out of 5 leading indicators that have stabilized or have recovered. This time, the monetary and fiscal indicators in April are already on the right side, and the PMI in April has fallen sharply, which may be the lowest point. The sales of real estate and automobiles are also expected to gradually stabilize, and positive factors are already accumulating.
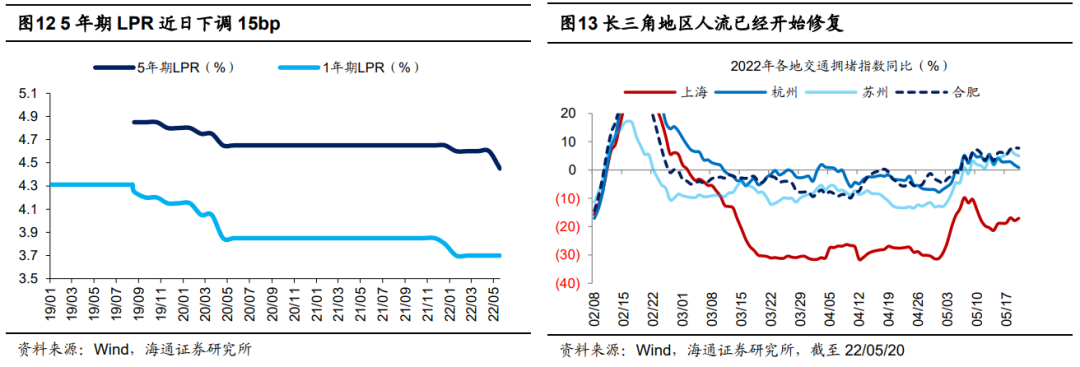
First, the policy of stabilizing growth continues to increase. Since the Politburo meeting on April 29 put forward “strive to achieve the expected goals of economic and social development for the whole year” and demanded to “accelerate the implementation of the established policies” and “speed up the planning of incremental policy tools”, the policy has continued to be implemented. On May 18, Li Keqiang, member of the Standing Committee of the Political Bureau of the CPC Central Committee and Premier of the State Council, hosted a symposium on stabilizing growth, stabilizing market players and ensuring employment in Yunnan. The meeting pointed out that “the policies that have been issued must be implemented as soon as possible, and the Central Economic Work Conference and the “Government Work Report” will determine In the first half of the year, the implementation of the policy has been basically completed; all regions and departments must increase their sense of urgency, tap the potential of the policy, and make sure that the new measures can be fully utilized, and they can be released in May.” The central bank has also “cut interest rates” twice recently, 5 On March 15th, the central bank announced the first residential commercial personal housing loaninterest rateThe lower limit is adjusted to not be lower than the market quotation for loans of the corresponding terminterest rateA reduction of 20 basis points, but the loan interest rate for second homes remains unchanged; on May 20, the central bank lowered the 5-year LRP interest rate by 15 basis points to 4.45%. After two “interest rate cuts”, the interest rate for the first home can be reduced by up to 35bp. As far as the real estate policy itself is concerned, since the beginning of the year, Baicheng has introduced policies to relax the property market. On May 20, Nanjing raised the provident fund loan amount for the second home. 300,000 yuan/person, 600,000 yuan/household for both husband and wife, adjusted to 500,000 yuan/person and 1 million yuan/household for both husband and wife.
Second, the epidemic is gradually brought under control. The epidemic has been one of the most important variables affecting the market since March this year, but Jilin has now achieved a social zero, and the epidemic in Shanghai is stabilizing and improving. On May 16, Shanghai announced that ground buses and rail transits will be able to gradually resume operations from May 22. From June 1 to the middle and late June, the normal management of epidemic prevention and control will be fully implemented, and the normal production and living order in the city will be fully restored. High-frequency data shows that the economy has also begun to recover. For example, the traffic congestion index in the Yangtze River Delta region began to recover significantly after May. The passenger car association data shows that the year-on-year growth rate of passenger car wholesale sales in the second week of May has been the worst in April. -60% narrowed to the current -22%, and retail sales growth narrowed from -61% to -29%.
4、Currently focusing on new infrastructure, gradually focusing on consumption
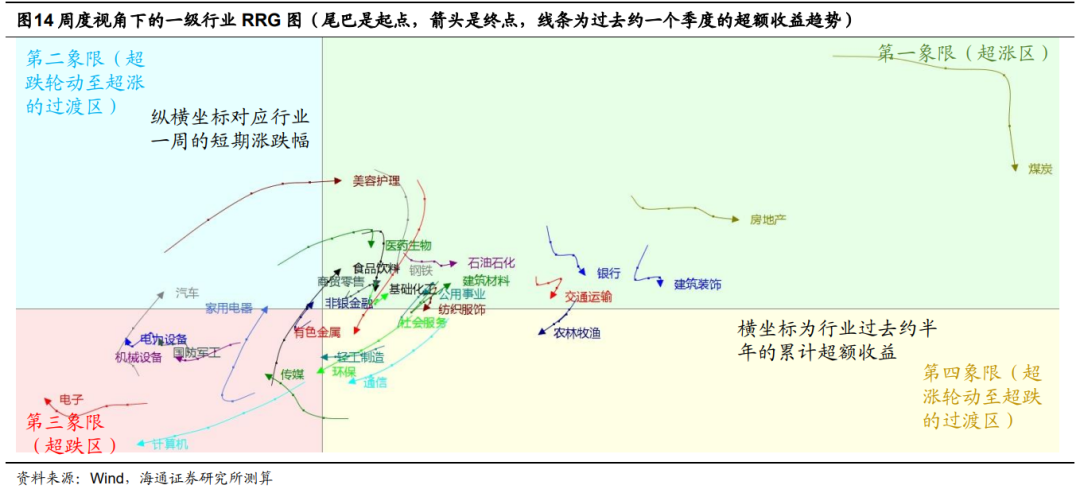
Compared with the judgment at the bottom of the market, investors pay more attention to the choice of style and industry. In “Industry Rotation under the Path of Steady Growth – Learning from 2009 and 20-20220516”, we pointed out that under the historical stable growth policy path, 08 The industry rotates every year from infrastructure to consumption, to technology; 20 years from new infrastructure to midstream manufacturing, and then to consumption.Under the force of the stable growth policy this time, we began to putbankReal estate is the first echelon. So far, the excess returns of financial real estate and traditional infrastructure have been obvious. In the future, the policy of stabilizing growth will continue to exert force.bankThere is still room for and real estate, but compared with history, the room for outperforming the index may be limited. Relatively speaking, combining the policy, performance and market aspects, the current new infrastructure is more flexible, and consumption will be gradually emphasized in the future.
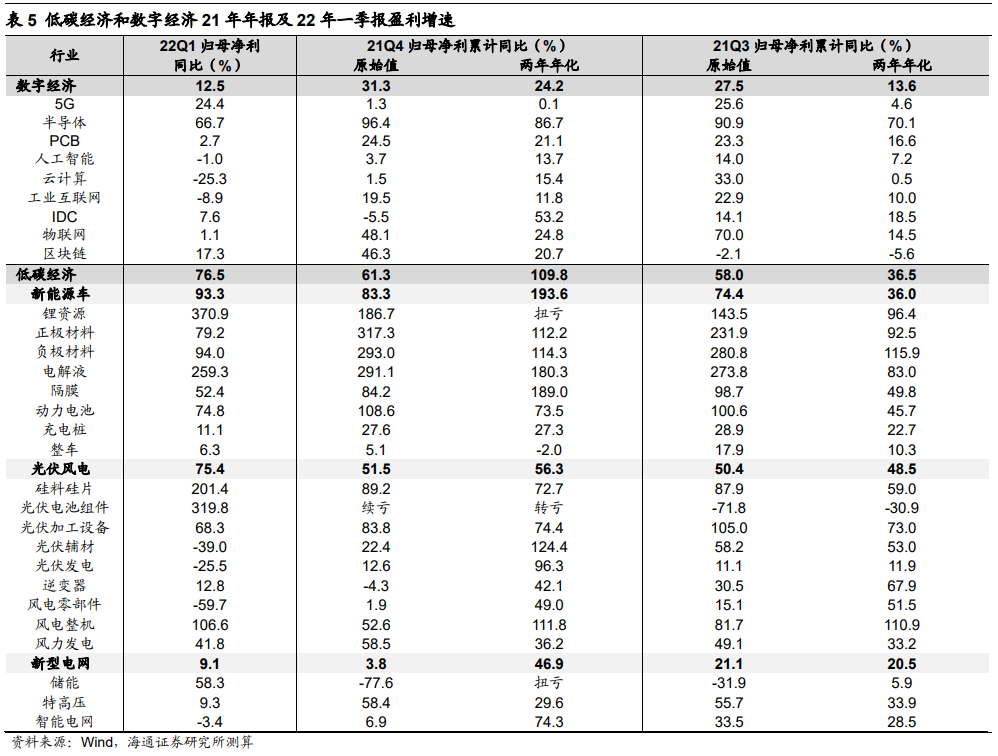
Compared with old infrastructure and big finance, new infrastructure may be more flexible.In “Three Reasons for Optimistic Growth – 20220515”, we pointed out that there are three reasons to be optimistic about new infrastructure: First, policy support. The 11th meeting of the Central Financial and Economic Commission pointed out that infrastructure construction should be comprehensively strengthened, and green and low-carbon energy bases should be clearly mentioned. , distributed grid,cloud computing、artificial intelligenceIn the fields of platforms, broadband basic networks, etc., under the background of steady growth this year, the growth rate of new infrastructure is faster. Computers, communications and electronicsFixed asset investmentA year-on-year increase of 27.8%, higher than the 10.5% of the traditional economy; second, the fundamentals are better, the net profit attributable to the parent of the 22Q1 low-carbon economy industry chain is 76.5% year-on-year,digital economy12.5%, the growth rate of all A shares is 3.6%, and from the perspective of PEG, the PEG of many sub-molecular fields is lower than 1; third, from the perspective of the market, the current growth industry has been significantly oversold, and the excess returns are expected to increase in the future. high. On the whole, photovoltaic wind power in a low-carbon economy,energy storageandUHVIt is worth noting that 5G and broadband infrastructure in the digital economy,data centerandcloud computingWorth watching.
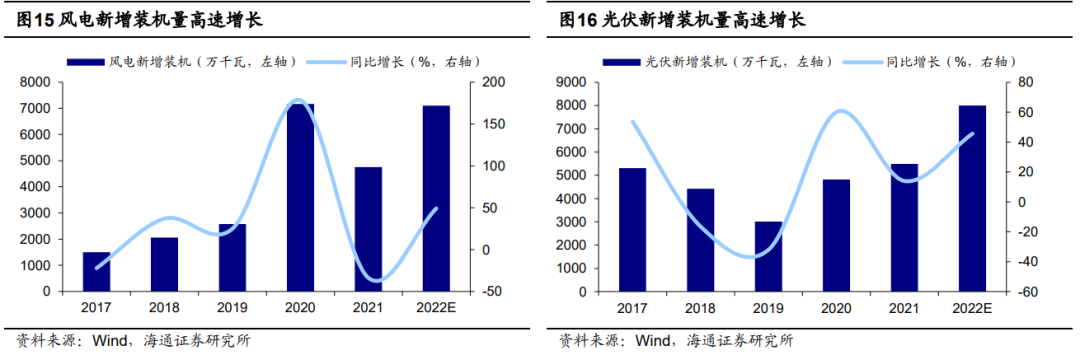
Low-carbon economy: photovoltaics, wind power,energy storageandUHV: Against the background of steady growth, photovoltaic wind power is also the focus of policy efforts. In addition, on May 18, the European Commission announced the “EU Renewable Energy Plan” (REPowerEU Plan), which increased the renewable energy target in 2030 from the previous 40% to 45%, and raised the photovoltaic grid connection target in 2030 to 600GW (It is estimated that the installed capacity is about 750GW).According to Haitong Electric’s newanalystIt is predicted that in 2022, the growth rate of new installed capacity of wind power and photovoltaic in my country is expected to reach 50%.The construction of domestic scenery base projects has been launched one after another, giving birth to theenergy storageandUHVnew demands. The National Development and Reform Commission proposed that the installed capacity of new energy storage will reach more than 30GW in 2025, while the cumulative installed capacity of new energy storage in 21 is only 4GW. UHV is also an important force for new infrastructure construction. During the “14th Five-Year Plan” period, the State Grid UHV investment plan 380 billion yuan, an increase of 35.7% over the investment of 280 billion yuan during the “13th Five-Year Plan” period. Judging from the performance of the first quarterly report, the cumulative net profit attributable to the parent company of photovoltaic wind power in 22Q1 was 75.4% year-on-year, which continued to increase from 51.5% in 21Q4; the growth rate of energy storage performance was relatively bright. The cumulative net profit attributable to the parent company of energy storage in 22Q1 was 58.3% year-on-year. Significant improvement from -77.6% in 21Q4. Related companies such as LONGi,Tongwei shares、JA Technology、Tenai Kono、Jinlang Technology、GoodwayOriental Cable.
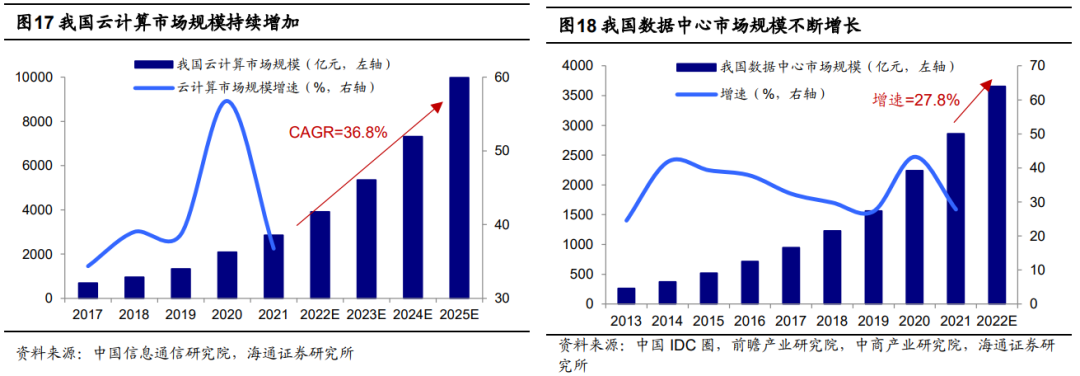
Digital economy: 5G,cloud computing、data centerWait.The construction of digital economy infrastructure is expected to speed up: In the 5G field, according to Haitong’s macro-organization and calculation, the infrastructure investment related to 5G base stations in 22 years will reach 176.3 billion yuan. In terms of broadband basic network, we estimate that the length of new fiber optic cable lines in 22 years is expected to exceed 4.4 million kilometers, an increase of 39% over 21 years. In terms of cloud computing, the China Academy of Information and Communications Technology predicts that the size of the cloud computing market will exceed 1 trillion yuan by the end of the “14th Five-Year Plan” period, and the compound annual growth rate will reach 36.8% during the 22-25 years.data centerOn the other hand, we estimate that the investment in the data center field will reach 527.8 billion yuan in 2022, an increase of 26.1% over 2021.artificial intelligenceIn terms ofartificial intelligenceThe industry scale will reach US$27.65 billion, an increase of 42.8% over 2021. Judging from the performance of the first quarterly report, the performance of the 5G sector has improved significantly, and the cumulative net profit attributable to the parent has increased from 1.3% in 21Q4 to 24.4% in 22Q1; the performance of the data center has improved, and the cumulative net profit attributable to the parent has increased from -5.5% in 21Q4 to 24.4% in 22Q1. 7.6% in 22Q1.Related companies such asStar Network Ruijie、ZTE、Glodon、Ziguang shares、data port、Hikvision。
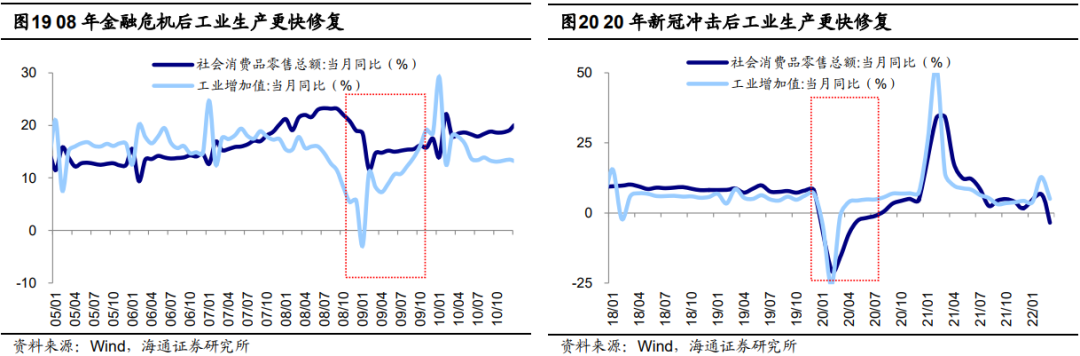
In the future, we will gradually pay attention to consumption.The repair of consumption is in sync with or slightly behind that of the economy, because the two variables that affect household consumption—income and savings—are affected by the pace of economic recovery. In terms of income, income growth is basically determined by economic growth. In economic recovery, the investment and production side are first repaired, and then the macro economy stabilizes and rebounds, micro-enterprise profits rise, and residents’ income increases. From the financial crisis in 2008 and the economic recovery process after the impact of the new crown epidemic in the early 2000s, it can be seen that,Industrial added valueThe slope and magnitude of the year-on-year growth rate of the month were both faster than the year-on-year growth rate of the total retail sales of social consumption in the same month. In terms of savings, after exogenous shocks, the uncertainty of residents’ future income increases, precautionary savings often increase, and the marginal propensity to consume decreases. For example, under the impact of the new crown epidemic in 20 years, the marginal propensity to consume of Chinese residents has decreased from about 70% before 19 years. To 66%, it took 21 years to return to 69%, close to the pre-epidemic level. As a result, the recovery in consumption will lag slightly behind the recovery in production, both in terms of income and savings. At present, the domestic epidemic situation is in a downward channel. As the epidemic situation is gradually brought under control, the policy of stabilizing growth will be gradually implemented, and the economy will gradually stabilize and recover. Superimposed on the consumption of the Mid-Autumn Festival and National Day holidays in the third and fourth quarters, the consumption related to economic recovery is basically face or will be stronger.
risk warning:Inflation continued to rise sharply, and macroeconomic policies at home and abroad were tightened.
(Article Source:securitiesTimes Network)