The pronounced weakness of tech stocks continues. Today the Nasdaq 100 marks over -2%, the worst of the major Wall Street stock indices. Weakness primarily dictated by the Treasury effect weighing on growth stocks. The cryptocurrencies that pay the prospect of a Fed tougher in fighting inflation. Bitcoin fell below the $ 40,000 barrier in the early afternoon for the first time since September. Bitcoin dropped 6% to $ 39,774, taking its loss this year to around 14%. This is the worst start to the year since 2012.
Fears of a further flare-up in inflation and, consequently, of a more aggressive Fed, are leading to a new rise in 10-year Treasury yields which today exceeded 1.8% for the first time since January 2020. Goldman Sachs analysts predict that the Federal Reserve will raise fed funds rates four times this year and begin reducing its balance sheet sooner than expected. The rapid progress in the US labor market and the hawkish signals coming from the minutes of the Federal Open Market Committee of December 14-15 suggest a more rapid normalization “, asserts Goldman Sachs which has now added to the more anticipated increases in March, June and September. a 4th increase in the cost of money in December. Regarding the December non-farm payrolls US (+ 199 thousand), analysts expect an upward revision of the figure as happened for almost all the monthly data in 2021. Conversely, the increase in wages also indicates a growing scarcity of labor coupled with very strong demand.
The Nasdaq had already returned from the worst week of the last 72 with a fall of 4.35%.
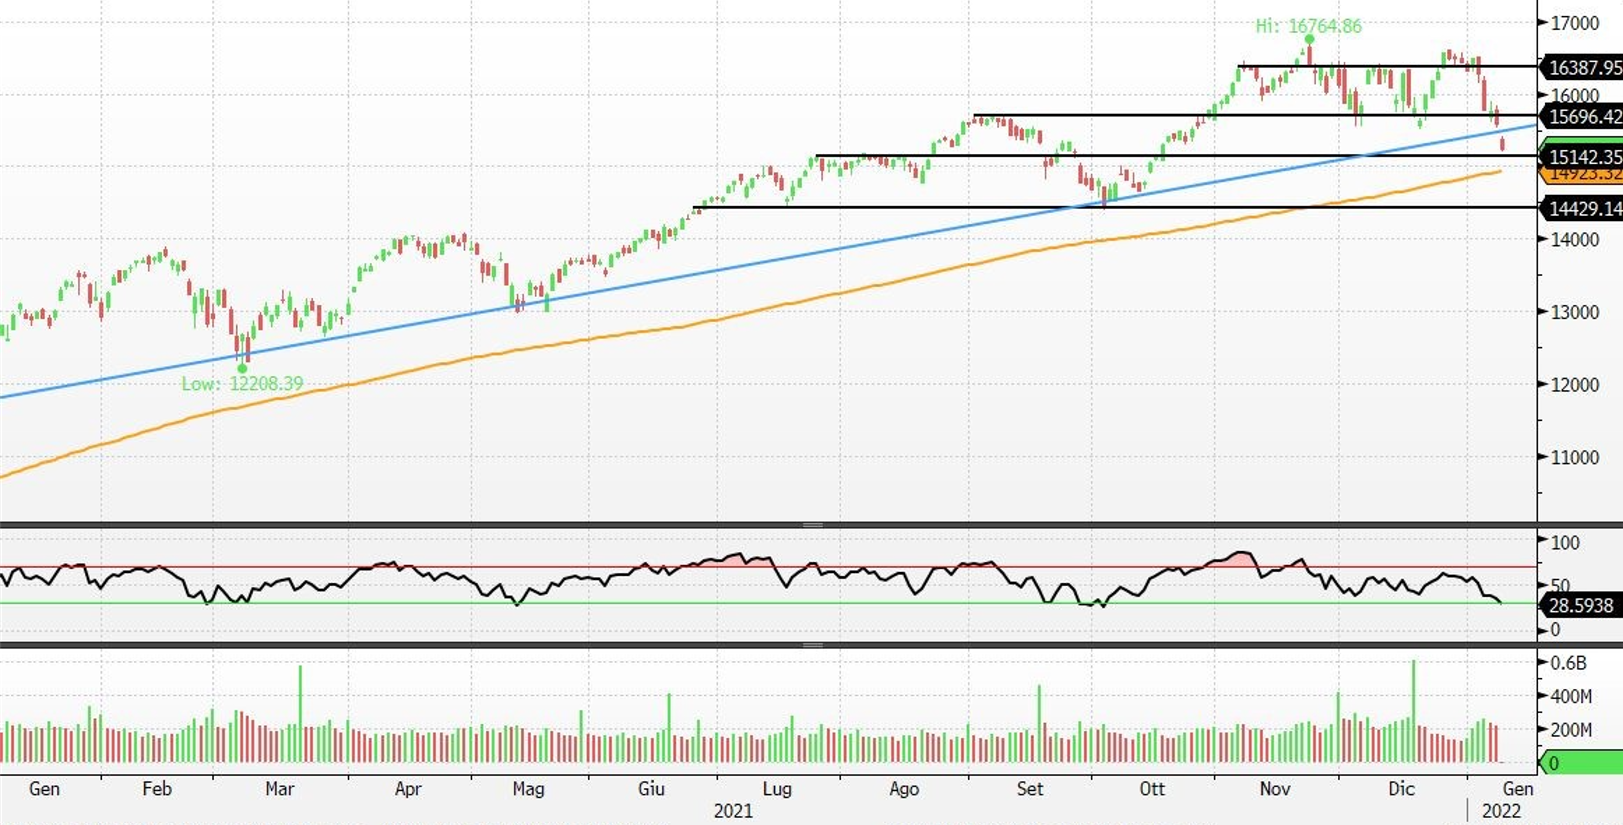
Technical analysis of the Nasdaq 100
The Nasdaq 100 opened with a gap down and is currently down -2.41% at 15,257 points. With today’s session, the index moved below the important support, now resistance at 15,600 points, a level that had supported the prices in the declines of the end of November and the end of December 2021. The technical situation worsened with the formation of a triple top with bearish implications after congestion between 15,600 and 16,380 points. The index also moved below the bullish trendline built from May 2020 and confirmed in October 2021, thus providing a strong signal of weakness and a potential signal of a reversal of the short-term bullish trend. The declines can find support at 15,100 and in the psychological area at 15,000 points and then rebound, or continue in the decline to 14,900 points, a level where the 200-period moving average passes and a deeper target at 14,400 points.