
Reminder from FTChinese.com: If you are interested in the content of FTChinese.com, please search for “FTChinese.com” in the Apple App Store or Huawei App Store, download the official app of FTChinese.com, and pay for subscription. Happy using!
Recently, there is a saying that “Vietnam’s export volume is higher than that of Shenzhen, and it is close to Guangdong Province”. This is really not news – in 2019, Vietnam’s export volume was higher than Shenzhen’s. However, Vietnam’s export industry structure is significantly different from China’s—a point that readers must take into account when considering Vietnam’s export value.
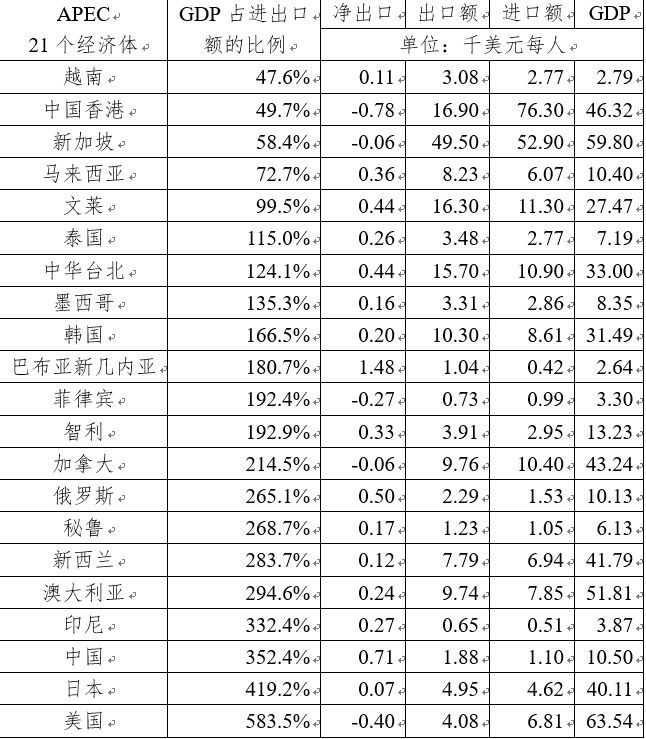
In order to analyze Vietnam’s import and export situation, we might as well compare it with its neighbors. The Massachusetts Institute of Technology (MIT) research project OEC (https://oec.world) collects and visualizes trade data across countries. Looking at Vietnam’s total imports and exports reveals a very interesting phenomenon: each Vietnamese exported $3,080 worth of goods and imported $2,770 worth of goods in 2020. However, Vietnam’s per capita GDP in 2020 is only about US$2,800 – in other words, Vietnam’s GDP is only 47.6% of the value of imports and exports.
This situation is very rare among ASEAN countries and APEC economies. Among the ten ASEAN countries, Vietnam’s ratio is only higher than Cambodia (46.3%); among the 21 APEC economies, Vietnam’s ratio is the lowest. In fact, this figure in Vietnam is similar to that of Hong Kong (49.7%) and Singapore (58.4%), which are well-known entrepots in the Asia-Pacific region.
What does this value mean? We need to review the definitions of exports and imports and GDP. Without considering investment (investment is actually future production), there are generally four forms of economic activity in a country:
1. Domestic production, domestic consumption – 1 share of GDP (consumption) is counted at this time, excluding import and export;
2. Foreign production, domestic consumption – at this time, excluding GDP (consumption and net exports cancel each other out), but counting 1 share of import and export;
3. Domestic production, foreign consumption – 1 share of GDP (net export) at this time, 1 share of import and export;
4. Foreign production, foreign consumption – at this time, GDP is not counted (net exports are 0), but 2 imports and exports are counted.
Therefore, the ratio of GDP to import and export volume is equal to (internal and external + internal and external) divided by (external and internal + internal and external + 2 × external and external). It can be found that those countries with large areas, large domestic population and relatively sufficient internal circulation have more “internal and external” activities and less “external and external” activities, and their GDP is often several times the import and export volume; Countries with small populations (and places like Hong Kong) that rely on entrepot trade have less “internal” activities and more “external” activities, and GDP tends to be less than the value of imports and exports.
Southeast Asian countries such as Vietnam and Cambodia are no exception and must obey this rule. However, in order to further clarify this issue, we must further explore the import and export structure of Vietnam.
One of the more strange things about Vietnam is that its target countries import and export disproportionately. Vietnam’s largest export trading partner is the United States, with 77 billion US dollars (25.6%), but the export value to the US’s neighbor Canada is only 5.28 billion US dollars, 1.76%. This is quite unusual considering Vietnam’s exports.
Generally speaking, in terms of the division of labor in the world industrial chain, import and export commodities can be divided into primary products for further assembly, parts and components, and products for final consumption. The electronic product industry chain we have been discussing before is a very typical example. Chemical factories in Japan export hydrogen fluoride, fluoropolyimide and photoresist to South Korea, which processes chips and exports them to China, and China processes them into electronic products and exports them all over the world. It can be seen that the electronic products processed in China can be consumed all over the world; but the chips from South Korea and the chemical raw materials such as hydrogen fluoride from Japan can only be exported to countries with downstream factories.
Since the electronic products processed in China can be consumed all over the world, there should be no significant difference in the per capita preference and consumption of Chinese products for countries with the same income level. For example, in 2020, China will export broadcasting equipment (Broadcasting Equipment, customs HS code 8525, which can be used to declare imports of most electronic products) to the United States at US$47.5 billion, to Japan at US$12 billion, and to European countries totaling US$56.1 billion. Considering that the population of the United States is three times that of Japan, three-quarters that of Europe, and that the GDP is four times that of Japan and four-fifths that of Europe, this number is roughly logical.
But Vietnam’s figure is worth pondering in relative terms – the export of broadcasting equipment to the United States is 14.3 billion US dollars, the export to Japan is 1.27 billion US dollars, and the total exports to European countries are 12.9 billion US dollars. Could it be that Vietnam’s broadcasting equipment products are especially favored by Americans, so that they can achieve ten times that of Japan and more than Europe?
Another more outrageous category is Computers (Computers, customs HS code 8471). China exported US$48.9 billion to the US and US$12.1 billion to Japan; Vietnam exported US$1.84 billion to the US and US$189 million to Japan – another tenfold.
Such absurd things are of course impossible. We can check the tariffs that need to be paid when importing 8525 commodities in the United States on the official website of the US International Trade Commission (US International Trade Commission) https://hts.usitc.gov/. After entering the query results screen, you can see that the 8525 category of goods is usually exempt from customs duties (General Rates of Duty is displayed as Free) – but there is a small slash next to it. Looking at the small slashes, you can find the words “9903.88.01”. These words represent nothing but the additional tariffs imposed by the United States on “Made in China”: 9903.88.01, 02, and 03 are the additional 25 that took effect on July 6, August 23, and September 24, 2018, respectively. % tariff; 9903.88.15 represents an additional 7.5% tariff effective September 1, 2019. At the same time, Europe and Japan, represented by the Schengen area, did not impose significant distinction on Chinese manufacturing and Vietnamese manufacturing. Therefore, it is clearly reasonable to speculate that a high proportion of Vietnam’s exports to the US is due to these additional tariffs.
We just mentioned that another country with the same characteristics of “entrepot trade” as Vietnam is Cambodia. Among Cambodia’s exports to the United States, the largest proportion is 4202 categories (Trunks and Cases, luggage), with exports to the United States of US$958 million, exports to Japan of US$136 million, and exports to Europe of US$146 million. Exports to the United States are seven times higher than those to Japan and Europe. Do Americans especially like Cambodian luggage products? After a check, it was another 25% tariff imposed by 9903.88.
We can speculate that the additional tariffs imposed on certain products made in China are one of the reasons for the disproportionately high proportion of these products exported to the United States from countries such as Vietnam and Cambodia.
In the trade structure between China and Vietnam in 2020, 8525 types of broadcasting equipment accounted for the largest export (China exported US$223 billion, 8.44%; Vietnam exported US$42 billion, 14%).
Let’s compare China’s and Vietnam’s imports and exports to the United States, Japan, and South Korea. It can be seen that China’s exports of broadcasting equipment to South Korea are closely related to its exports to the United States and Japan as a whole. The more GDP, the greater the demand for consuming China’s exported broadcasting equipment. But Vietnam is not like that. Just now we mentioned “ten times” the export to the US, and here the export to South Korea is even higher than that to Japan.
(This article only represents the author’s own views, editor in charge: Yan Man [email protected])