
Zhang Yaoxi: Non-farm payrolls are on schedule to help bulls soar, gold coveted CPI to lower inflation
Gold market last week: International gold/London gold bottomed out and closed positive, with significantly increased efforts. At the same time, it also implies that there is an expectation of a bottom to recover.
In terms of trend, the price of gold has opened at $1,643.65 per ounce since the beginning of the week. After a brief run under pressure, the market speculated that the Federal Reserve would signal a slowdown in the pace of tightening after the interest rate decision, driving the price of gold to strengthen significantly in the white session on Wednesday. The Federal Reserve decided to raise interest rates by 75 basis points as scheduled, resulting in a sell-the-fact operation, which pushed the price of gold to jump higher, hitting an intraday high near $1,670;
However, due to the better-than-expected many data, Fed Chairman Powell’s speech suggested that the “final level” of interest rates may be higher than previously expected, and it was too early to discuss suspending interest rate hikes. The dollar index bottomed out and rose sharply. It extended to Thursday, bringing gold to a weekly low of $1616.49;
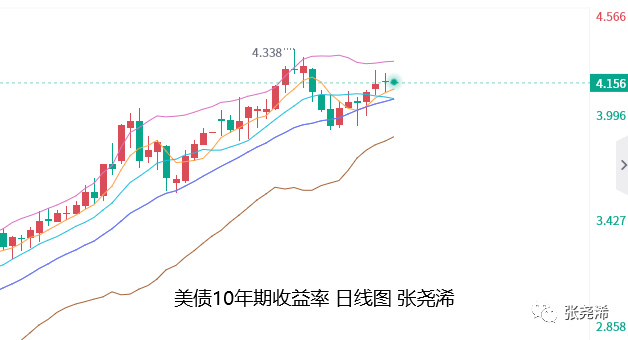
However, the trend was affected by the technical buying supported by the double bottom and the U.S. bond yields fell after resistance, and the price of gold bottomed out again. By Friday, the non-agricultural data was lower than the previous value, the unemployment rate increased, and wage inflation decreased. , which supports the view that the Fed may slow down the pace of interest rate hikes in the future. At the same time, Richmond Fed President Barkin and Boston Fed President Collins also suggested that the Fed’s subsequent rate hikes may slow down;
It pushed the price of gold sharply higher and refreshed Wednesday’s high in one fell swoop, reaching a weekly high of $1,681.49, and finally closed at $1,681.03, with a weekly amplitude of $65, and closed up $37.38, or 2.27%.
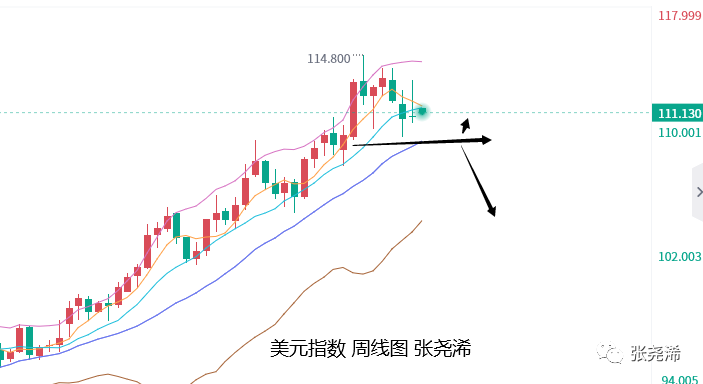
Looking forward to this Monday (November 07): International gold will run in shock at the beginning of the market. Although there is a certain demand for falling back, from the perspective of power, it seems that the space is limited. The US dollar index is again under pressure and is expected to decline, which will support it. Weekly and monthly chart trends, the US dollar index still has a certain risk of peaking in the medium and long term, so for the gold price, there is also a certain probability of bottoming out. The market outlook will focus on whether it can return to the top of the 200-week moving average, and the US dollar index will focus on whether it can fall back below the 20-week moving average.
In terms of data, there is no focus in the first half of the week. For market trends, pay attention to the expected impact and technical market signals brought by last week’s data. In the second half of the week, focus on the annual rate of CPI that was not seasonally adjusted in October; and pay close attention to the speeches of the Fed officials. , From the mouths of these officials, we can look for the future direction of the Fed’s monetary policy.
In terms of inflation, the CPI data predicts that it will continue to decline, and the core inflation growth rate will drop slightly to 6.5%, which will support the price of gold, but if it is still above 8%, the support for the price of gold will be limited. There are also pigeons and eagles, and the impact is mixed. Therefore, the probability of last week this week is greater than the probability of a fall, but if inflation continues to rise and officials speak hawkishly, the price of gold will face resistance and fall.
2024 FOMC vote committee, Richmond Fed President Barkin speaks on the U.S. economic outlook.
In 2023, the FOMC vote committee and Philadelphia Fed President Harker delivered a speech on the U.S. economic outlook.
In 2022, the FOMC voted, and Cleveland Fed President Mester delivered a speech on the U.S. economic outlook.
2022 FOMC vote committee, Kansas Fed President George speaks at a conference on energy and the economy.
Fundamentally, at present, the Fed has raised interest rates by 75 basis points for 4 consecutive times, and the expectation of a 50 basis point interest rate hike in December has also been discussed. Therefore, in terms of the intensity of interest rate hikes, there is a tendency to slow down, and the market outlook is also due to the reduction of interest rate hikes. , the negative impact on gold prices will also weaken, so as long as the Fed does not raise interest rates by 75 basis points or higher in the market outlook, gold prices may bottom at any time.
In addition, the global geopolitical situation, trade situation, epidemic situation, European energy crisis and other fundamental news also have a certain role in hedging the gold price. On the whole, as long as the price of gold does not fall below $1,600, the price of gold is optimistic about bottoming and shocks, but if it needs to reverse and strengthen, it still needs to wait for it to return to the 200-week moving average, or wait for the Fed’s interest rate to peak next year.
Technically: On the annual chart, the current gold price has bottomed out after testing the support of the 5-year moving average. Last week, the Fed’s aggressive interest rate hike and hawkish speech did not make it fall below the support, and it has also relied on this support in recent years. It maintains an upward trend, so there is also a certain expectation of bottoming out, reversing, rebounding and strengthening; however, in terms of space, it implies that there is still a risk of continuing to fall back to test the support of the trend line, but the overall bullish trend of the previous period will not be changed. Therefore, whether it is relying on 5 The annual average, or relying on the trend line support, will be a feasible opportunity to develop long-term bullishness.
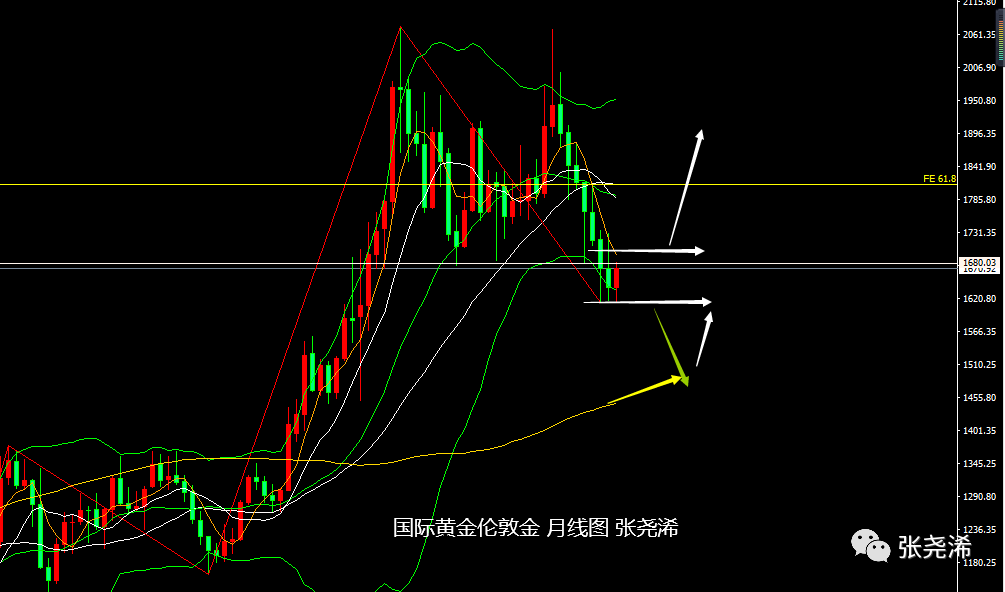
On the monthly chart level, the price of gold fell to the closing line as scheduled in October, maintaining the downward pattern of the positive and negative double hammer lines that have fallen for 7 consecutive years, which implies that the market outlook still has the risk of continuing to fall, and the bottom will remain coveted to touch the 100-month moving average support at 1446 or Bottoming reversal at $1525.
However, after hitting the low point support this month, it strengthened again and returned to the upper track of the Bollinger Band. At present, it has formed a 3-point bottom support, and there is also a certain expectation of bottoming or bottoming, but this view needs to be strengthened and turned bullish , It still needs to break through and stand above the May moving average. In general, keep the expectation of shocking and bottoming out before refreshing the low point. If the low point is refreshed, continue to look down at the 100-month moving average and then see the bottoming out.
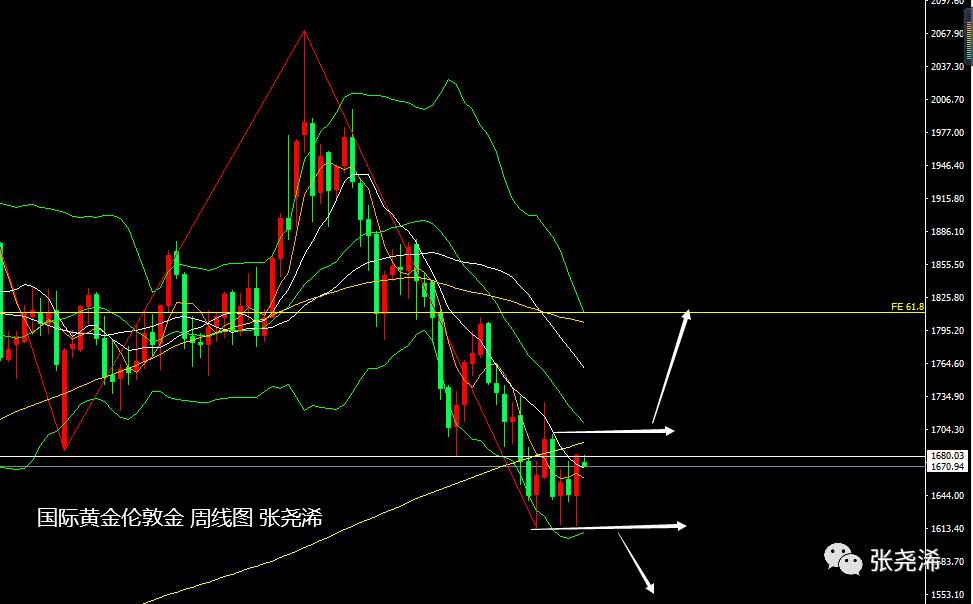
Weekly level: Gold prices bottomed out sharply last week and closed in the sun. Compared with the previous two lows, they bottomed out and rebounded, forming a more obvious signal to stop the decline. Limited, the recovery mode will be opened next year. The bottom is concerned with the 5-week moving average support and the support near the opening price last week, and the top is concerned with the 200-week moving average and the Bollinger Band middle rail support, and the first time it is touched, it can still be seen to fall back.
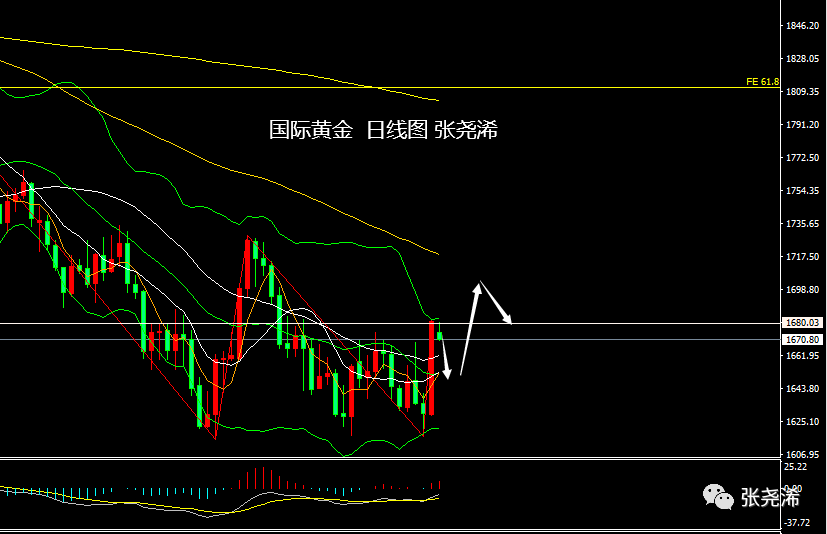
Daily level: The price of gold rebounded sharply last Friday, returning to the Bollinger Band and closing line above the 30-day moving average. Although the power of the main chart shows a rebound and peaking signal, the moving average supports a lot, so the room for falling is limited, and there is still room for higher levels. You can further focus on the resistance near the 100-day moving average, that is, near $1,700, you can see the demand for falling back. It is currently waiting for a retracement to support bullishness.
Preliminary point reference for the day:
International gold: below the support at $1662 and support near $1653; above the resistance at $1680 and near $1688;
Spot: The bottom focuses on the support at $20.88 and the support at $21.10; the top focuses on the resistance at $19.75 and the resistance at $19.95;
Note:
Gold TD=(international gold price x exchange rate)/31.1035
The international gold fluctuates by 1 USD, and the gold TD fluctuates about 0.22 yuan (theoretically).
U.S. futures gold price = London spot price × (1 + gold swap rate × futures expiration days/365)
Predict boldly and trade cautiously. The above opinions and analysis only represent the author’s personal thoughts and are for reference only, not as a basis for trading. your money your decision.
Essential Books for Gold Investment Fundamentals: “Play and Earn Gold Investment Trading”