Since the beginning of this year, the new downward pressure on the economy has been further increased due to the more complex and severe international environment and the significantly larger-than-expected impact of the domestic epidemic. Faced with the complex situation, under the strong leadership of the CPC Central Committee with Comrade Xi Jinping at its core, all regions and departments have conscientiously implemented the decisions and arrangements of the CPC Central Committee and the State Council, effectively coordinated epidemic prevention and control and economic and social development, intensified efforts to adjust macro policies, and strived to Overcoming the impact of the epidemic, basic industries have strong support, investment scale continues to expand, market prices are generally stable, people’s livelihood guarantees are strong and effective, emerging drivers continue to grow, and the overall economic and social development is stable. With the effective coordination of epidemic prevention and control and economic and social development, the national economy is expected to stabilize and recover.
1. Industrial production slowed down, and high-tech manufacturing maintained rapid growth
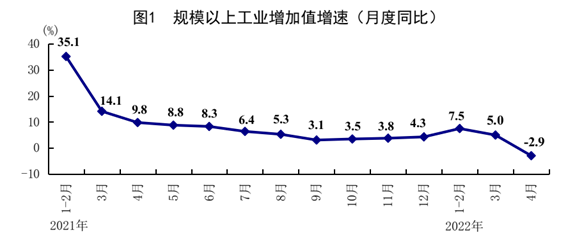
From January to April, the added value of industrial enterprises above designated size increased by 4.0% year-on-year, 2.5 percentage points lower than that from January to March. In terms of three categories, the added value of the mining industry increased by 10.4% year-on-year, the manufacturing industry increased by 3.2%, and the production and supply of electricity, heat, gas and water increased by 5.0%. The added value of high-tech manufacturing increased by 11.5% year-on-year. In terms of economic types, the added value of state-controlled enterprises increased by 3.1% year-on-year; joint-stock enterprises increased by 5.8%, foreign-invested enterprises, Hong Kong, Macao and Taiwan-invested enterprises decreased by 2.8%; private enterprises increased by 5.1%. In terms of products, the output of basic industrial products such as raw coal and ten non-ferrous metals increased by 10.5% and 0.7% year-on-year respectively, and the output of green and intelligent digital products such as new energy vehicles, solar cells, and mobile communication base station equipment increased by 112.7%, 27.5%, and 25.9% respectively. %. In April, the added value of industrial enterprises above designated size decreased by 2.9% year-on-year and 7.08% month-on-month. Among them, the added value of the mining industry increased by 9.5% year-on-year, the manufacturing industry decreased by 4.6%, and the production and supply of electricity, heat, gas and water increased by 1.5%. The added value of high-tech manufacturing increased by 4.0% year-on-year. In April, the manufacturing purchasing managers’ index was 47.4%, and the enterprise production and business activity expectation index was 53.3%. From January to March, the national industrial enterprises above designated size realized a total profit of 1,955.6 billion yuan, a year-on-year increase of 8.5%.
2. The production of the service industry has declined, and the modern service industry has a good growth momentum
From January to April, the national service industry production index increased by 0.3% year-on-year, 2.2 percentage points lower than that from January to March. Among them, the production index of information transmission, software and information technology services, and the financial industry increased by 13.9% and 4.8% respectively. In April, the national service industry production index fell by 6.1% year-on-year, of which the information transmission, software and information technology service industry, and the financial industry production index increased by 10.3% and 5.5% respectively. From January to March, the operating income of service industry enterprises above designated size increased by 9.0% year-on-year. In April, the business activity index of the service industry was 40.0%, and the business activity expectation index was 53.0%; among which, the business activity index of industries such as telecommunications, broadcasting, television and satellite transmission services, Internet software and information technology services continued to be in the expansion range.
3. Market sales decreased, and sales of basic living goods and online retail continued to grow
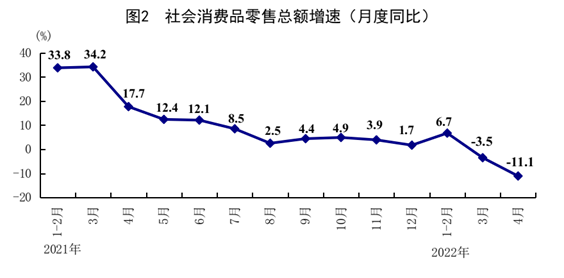
From January to April, the total retail sales of consumer goods was 13,814.2 billion yuan, down 0.2% year-on-year. According to the location of business units, the retail sales of urban consumer goods was 11992.9 billion yuan, down 0.3% year-on-year; the retail sales of rural consumer goods was 1821.3 billion yuan, up 0.4%. In terms of consumption types, retail sales of goods were 12,488 billion yuan, up 0.4% year-on-year; catering revenue was 1,326.2 billion yuan, down 5.1%. The sales of basic living commodities grew rapidly, and the retail sales of beverages, grains, oils and foodstuffs, and Chinese and Western medicines of units above designated size increased by 10.4%, 9.5%, and 8.8% respectively. The national online retail sales reached 3,869.2 billion yuan, a year-on-year increase of 3.3%. Among them, the online retail sales of physical goods was 3,288.7 billion yuan, an increase of 5.2%, accounting for 23.8% of the total retail sales of social consumer goods. In April, the total retail sales of consumer goods was 2,948.3 billion yuan, a year-on-year decrease of 11.1% and a month-on-month decrease of 0.69%. Among them, the retail sales of goods was 2,687.4 billion yuan, a year-on-year decrease of 9.7%; the catering revenue was 260.9 billion yuan, a decrease of 22.7%.
4. The scale of investment in fixed assets has expanded, and investment in high-tech industries and social fields has grown rapidly
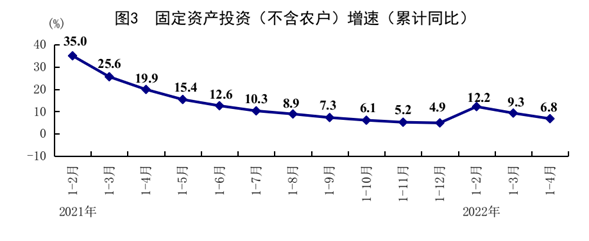
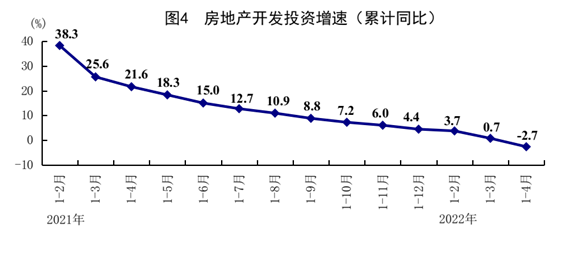
From January to April, the national fixed asset investment (excluding rural households) was 15354.4 billion yuan, a year-on-year increase of 6.8%, a decrease of 2.5 percentage points from January to March. In terms of different fields, infrastructure investment increased by 6.5% year-on-year, manufacturing investment increased by 12.2%, and real estate development investment decreased by 2.7%. The sales area of commercial housing nationwide was 397.68 million square meters, a year-on-year decrease of 20.9%; the sales of commercial housing was 3,778.9 billion yuan, a decrease of 29.5%. In terms of different industries, the investment in the primary industry increased by 5.8% year-on-year, the investment in the secondary industry increased by 12.6%, and the investment in the tertiary industry increased by 4.3%. Private investment increased by 5.3%. Investment in high-tech industries increased by 22.0%, of which investment in high-tech manufacturing and high-tech service industries increased by 25.9% and 13.2% respectively. In the high-tech manufacturing industry, the investment in the electronics and communication equipment manufacturing industry, medical equipment and instrumentation manufacturing industry increased by 30.8% and 29.4% respectively; in the high-tech service industry, the investment in the scientific and technological achievements transformation service industry and the R&D design service industry increased by 21.9% respectively. %, 21.1%. The investment in the social field increased by 14.4%, of which the investment in health and education increased by 24.9% and 12.5% respectively. In April, fixed asset investment (excluding rural households) decreased by 0.82% month-on-month.
5. The import and export of goods continued to grow, and the trade structure continued to be optimized
From January to April, the total import and export of goods was 12,579.9 billion yuan, a year-on-year increase of 7.9%. Among them, exports were 6,967.4 billion yuan, an increase of 10.3%; imports were 5,612.5 billion yuan, an increase of 5.0%. General trade import and export accounted for 63.6% of the total import and export, an increase of 1.9 percentage points over the same period of the previous year. The import and export of private enterprises accounted for 48.5% of the total import and export, an increase of 1.4 percentage points over the same period of the previous year. The export of mechanical and electrical products increased by 6.7% year-on-year, accounting for 57.9% of the total export value. my country’s imports and exports to countries along the “Belt and Road” increased by 15.4%, of which exports increased by 12.9% and imports increased by 18.6%.
6. The surveyed urban unemployment rate has increased, and the employment of major groups has been basically stable
From January to April, 4.06 million new jobs were created in urban areas across the country, and the national average urban survey unemployment rate was 5.7%. In April, the national urban surveyed unemployment rate was 6.1 percent, up 0.3 percentage points from the previous month. The unemployment rate of the local household registration population survey was 5.7%; the unemployment rate of the migrant household registration population survey was 6.9%, of which the unemployment rate of the migrant agricultural household registration population survey was 6.6%. The surveyed unemployment rates for the 16-24 and 25-59 age groups were 18.2% and 5.3%, respectively. The surveyed unemployment rate in 31 large cities and towns was 6.7%. The national average weekly working time of enterprise employees is 46.2 hours.
7. The consumer price rose moderately, and the increase in the ex-factory price of industrial producers fell back
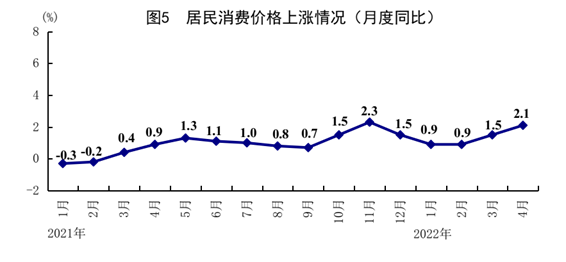
From January to April, the national consumer price (CPI) rose by 1.4% year-on-year. In April, the national consumer price rose by 2.1% year-on-year, an increase of 0.6 percentage points from the previous month, and a month-on-month increase of 0.4%. In terms of categories, the price of food, tobacco and alcohol increased by 1.9% year-on-year, the price of clothing increased by 0.5%, the price of housing increased by 1.2%, the price of daily necessities and services increased by 1.2%, the price of transportation and communication increased by 6.5%, the price of education, culture and entertainment increased by 2.0%, and the price of medical care increased by 2.0%. Health care prices rose 0.7 percent, while other supplies and services rose 1.7 percent. Among the prices of food, tobacco and alcohol, grain prices rose by 2.7%, fresh fruit prices rose by 14.1%, fresh vegetables prices rose by 24.0%, and pork prices fell by 33.3%. The core CPI after deducting food and energy prices rose by 0.9% year-on-year, a decrease of 0.2 percentage points from the previous month.
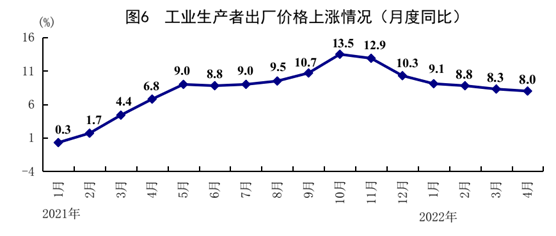
From January to April, the ex-factory prices and purchase prices of industrial producers nationwide rose by 8.5% and 11.2% year-on-year respectively. In April, the ex-factory price of industrial producers nationwide increased by 8.0% year-on-year, a decrease of 0.3 percentage points from the previous month, and a month-on-month increase of 0.6%. The national purchasing price of industrial producers rose by 10.8% year-on-year and 1.3% month-on-month.
In general, the epidemic in April had a major impact on economic operations, but this impact was short-term and external. The fundamentals of my country’s economy remained stable and improved in the long run. Transformation and upgrading and high-quality development have not changed. The general trend has not changed, and there are many favorable conditions for stabilizing the macroeconomic market and achieving the expected development goals. With the staged results of epidemic prevention and control, and continued effective measures to stabilize the economy, economic performance is expected to gradually recover. In the next stage, we must adhere to the guidance of Xi Jinping Thought on Socialism with Chinese Characteristics for a New Era, fully implement the decisions and deployments of the CPC Central Committee and the State Council, strengthen our confidence, face up to difficulties and challenges, adhere to the principle of stability, seek progress while maintaining stability, and efficiently coordinate epidemic prevention and control. With economic and social development, we must implement the overall requirements of “preventing the epidemic, stabilizing the economy, and developing safely”, intensifying efforts to adjust macroeconomic policies, stabilizing the economy, and ensuring that the economy operates within a reasonable range.
Notes
(1) The growth rate of industrial added value and its classified items above designated size is calculated at comparable prices, and is the actual growth rate; unless otherwise specified, other indicators are calculated at current prices and are nominal growth rates.
(2) The statistical scope of industries above designated size is industrial enterprises with annual main business income of 20 million yuan and above.
Since the scope of industrial enterprises above designated size changes every year, in order to ensure that the data of this year is comparable with that of the previous year, the number of the same period used to calculate the year-on-year growth rate of various indicators such as product output is as consistent as possible with the statistical scope of enterprises in this period, and the same as that of the previous year. There are discrepancies in the published data. The main reasons are: First, the scope of statistical units has changed. Every year, some enterprises reach the scale and are included in the scope of the investigation, and some enterprises withdraw from the scope of the investigation due to their reduced scale, and there are also influences such as newly-built enterprises, bankruptcy, and registration (revocation) of enterprises. The second is that some enterprise groups (companies) have repeated cross-regional statistics on the product output data. According to the special investigation, the cross-regional repeated output of enterprise groups (companies) has been de-weighted.
(3) The service industry production index refers to the output change of the service industry in the reporting period relative to the base period after excluding price factors.
(4) The statistical scope of total retail sales of social consumer goods includes legal person enterprises, industrial activity units and self-employed individuals engaged in commodity retail activities or providing catering services. Among them, the units above the designated size refer to wholesale enterprises (units) with annual main business income of 20 million yuan and above, retail enterprises (units) with annual main business income of 5 million yuan and above, and accommodation and catering enterprises with annual main business income of 2 million yuan and above ( unit).
As the scope of enterprises (units) in the wholesale and retail trade, accommodation and catering industry above the designated size changes every year, in order to ensure that the current year’s data is comparable with the previous year, the number of the same period used to calculate the year-on-year growth rate of various indicators such as the retail sales of consumer goods for units above the designated size It is consistent with the statistical scope of enterprises (units) in this issue, and there is a difference in caliber with the data published in the previous year. The main reason is that every year, some enterprises (units) meet the quota and are included in the scope of the investigation. At the same time, some enterprises (units) are withdrawn from the scope of investigation due to their smaller scale and cannot meet the quota. The influence of sales enterprises (units).
Online retail sales refer to the sum of retail sales of goods and services through public online trading platforms (including self-built websites and third-party platforms). Goods and services include physical goods and non-physical goods (such as virtual goods, service goods, etc.).
The total retail sales of consumer goods includes online retail sales of physical goods, excluding online retail sales of non-physical goods.
(5) Import and export data come from the General Administration of Customs; urban new employment data come from the Ministry of Human Resources and Social Security.
(6) Employed personnel refer to those who are 16 years old and above, have the ability to work, and engage in certain social labor in order to obtain labor remuneration or business income.
(7) Due to rounding of some data, the total and the sub-total may not be equal.
Schedule
2022year1-4 Monthly main indicator data
|
index |
4moon |
1-4moon |
||
|
absolute quantity |
Year-on-year growth |
absolute quantity |
Year-on-year growth |
|
|
1. Industrial added value above designated size |
… |
-2.9 |
… |
4.0 |
|
(1) divided into three categories |
||||
|
mining industry |
… |
9.5 |
… |
10.4 |
|
manufacturing |
… |
-4.6 |
… |
3.2 |
|
Electricity, heat, gas and water production and supply industry |
… |
1.5 |
… |
5.0 |
|
(2) By economic type |
||||
|
Of which: State-owned holding enterprises |
… |
-2.9 |
… |
3.1 |
|
Of which: joint-stock enterprises |
… |
0.5 |
… |
5.8 |
|
Foreign and Hong Kong, Macao and Taiwan-invested enterprises |
… |
-16.1 |
… |
-2.8 |
|
Of which: private companies |
… |
-1.1 |
… |
5.1 |
|
(3) Added value of major industries |
||||
|
textile industry |
… |
-6.3 |
… |
0.5 |
|
Chemical raw materials and chemical products manufacturing |
… |
-0.6 |
… |
3.3 |
|
Non-metallic mineral products industry |
… |
-6.2 |
… |
-0.9 |
|
Ferrous metal smelting and rolling industry |
… |
-4.2 |
… |
-2.9 |
|
General equipment manufacturing |
… |
-15.8 |
… |
-2.7 |
|
Automotive Manufacturing |
… |
-31.8 |
… |
-5.4 |
|
Railway, marine, aerospace and other transportation equipment manufacturing |
… |
-6.0 |
… |
0.4 |
|
Electrical machinery and equipment manufacturing |
… |
1.6 |
… |
9.2 |
|
Computer, communications and other electronic equipment manufacturing |
… |
4.9 |
… |
10.7 |
|
Electricity and heat production and supply industry |
… |
0.9 |
… |
4.3 |
|
(IV) Output of main products |
||||
|
pig iron (tons) |
7678 |
0.0 |
28030 |
-9.4 |
|
crude steel (tons) |
9278 |
-5.2 |
33615 |
-10.3 |
|
steel (tons) |
11483 |
-5.8 |
42682 |
-5.9 |
|
cement (tons) |
19471 |
-18.9 |
58106 |
-14.8 |
|
Ten non-ferrous metals (tons) |
553 |
0.3 |
2170 |
0.7 |
|
Sulfuric acid (folding100%) (tons) |
795 |
-2.8 |
3140 |
-1.6 |
|
caustic soda (folded100%) (tons) |
323 |
-0.9 |
1287 |
-0.5 |
|
vinyl (tons) |
218 |
-1.3 |
941 |
0.3 |
|
Chemical Fiber (tons) |
540 |
-7.6 |
2203 |
1.4 |
|
plate glass (10,000 weight boxes) |
8564 |
-1.4 |
33908 |
0.7 |
|
microcomputer equipment (Wantai) |
3035 |
-16.8 |
13639 |
-2.8 |
|
integrated circuit (billion) |
259 |
-12.1 |
1074 |
-5.4 |
|
car (ten thousand) |
128.2 |
-43.5 |
795.3 |
-7.8 |
|
in:car (ten thousand) |
41.5 |
-43.9 |
282.8 |
-6.9 |
|
Power generation (100 million kWh) |
6086 |
-4.3 |
26029 |
1.3 |
|
Raw coal (10,000 tons) |
36280 |
10.7 |
144778 |
10.5 |
|
Coke (10,000 tons) |
4001 |
1.1 |
15515 |
-2.7 |
|
Crude oil processing volume (10,000 tons) |
5181 |
-10.5 |
22325 |
-3.8 |
|
(5) Product sales rate (%) |
96.3 |
-1.9 (percentage point) |
96.2 |
-1.7 (percentage point) |
|
(6) Export delivery value (100 million yuan) |
11441 |
-1.9 |
47589 |
9.9 |
|
2. Service Industry Production Index |
… |
-6.1 |
… |
0.3 |
|
3. Investment in fixed assets (excluding farmers) (100 million yuan) |
… |
… |
153544 |
6.8 |
|
Of which: private investment |
… |
… |
86872 |
5.3 |
|
By industry |
||||
|
primary industry |
… |
… |
3829 |
5.8 |
|
Secondary industry |
… |
… |
47580 |
12.6 |
|
Tertiary Industry |
… |
… |
102136 |
4.3 |
|
4. Real estate development |
||||
|
(1) Investment in real estate development (100 million yuan) |
… |
… |
39154 |
-2.7 |
|
Of which: Residential |
… |
… |
29527 |
-2.1 |
|
office building |
… |
… |
1554 |
-8.2 |
|
Commercial business premises |
… |
… |
3259 |
-5.3 |
|
(2) Building construction area (10,000 square meters) |
… |
… |
818588 |
0.0 |
|
Of which: Residential |
… |
… |
577692 |
-0.1 |
|
office building |
… |
… |
32438 |
-1.0 |
|
Commercial business premises |
… |
… |
74169 |
-6.6 |
|
(3) Newly started area of housing (10,000 square meters) |
… |
… |
39739 |
-26.3 |
|
Of which: Residential |
… |
… |
28877 |
–28.4 |
|
office building |
… |
… |
1023 |
-19.5 |
|
Commercial business premises |
… |
… |
2751 |
-27.3 |
|
(IV) Completed building area (10,000 square meters) |
… |
… |
20030 |
-11.9 |
|
Of which: Residential |
… |
… |
14662 |
-11.4 |
|
office building |
… |
… |
589 |
-22.1 |
|
Commercial business premises |
… |
… |
1742 |
-16.0 |
|
(V) Sales area of commercial housing (10,000 square meters) |
… |
… |
39768 |
-20.9 |
|
Of which: Residential |
… |
… |
33722 |
-25.4 |
|
office building |
… |
… |
887 |
15.1 |
|
Commercial business premises |
… |
… |
2389 |
12.4 |
|
(6) Sales of commercial housing (100 million yuan) |
… |
… |
37789 |
-29.5 |
|
Of which: Residential |
… |
… |
33248 |
-32.2 |
|
office building |
… |
… |
1104 |
-5.2 |
|
Commercial business premises |
… |
… |
2334 |
1.0 |
|
(7) Funds in place for real estate development enterprises (100 million yuan) |
… |
… |
48522 |
-23.6 |
|
Of which: Domestic loans |
… |
… |
6837 |
-24.4 |
|
Utilize foreign capital |
… |
… |
38 |
129.4 |
|
self-financing |
… |
… |
16271 |
-5.2 |
|
Deposit and advance payment |
… |
… |
15357 |
-37.0 |
|
personal mortgage loan |
… |
… |
8037 |
-25.1 |
|
Land purchase area (10,000 square meters) |
… |
… |
1766 |
-46.5 |
|
Area of commercial housing for sale (10,000 square meters) |
… |
… |
55735 |
8.4 |
|
V. Total retail sales of consumer goods (100 million yuan) |
29483 |
-11.1 |
138142 |
-0.2 |
|
Including: retail sales of consumer goods of units above designated size |
11012 |
-14.0 |
51586 |
0.6 |
|
(1) By business location |
||||
|
town |
25637 |
-11.3 |
119929 |
-0.3 |
|
rural |
3846 |
-9.8 |
18213 |
0.4 |
|
(2) By type of consumption |
||||
|
Food and Beverage Income |
2609 |
-22.7 |
13262 |
-5.1 |
|
Including: Catering income of units above designated size |
653 |
-24.0 |
3064 |
-5.6 |
|
commodity retail |
26874 |
-9.7 |
124880 |
0.4 |
|
Of which: retail sales of units above designated size |
10359 |
-13.3 |
48523 |
1.0 |
|
Grain and oil, food |
1357 |
10.0 |
5936 |
9.5 |
|
drink category |
220 |
6.0 |
938 |
10.4 |
|
Tobacco and alcohol |
312 |
-7.0 |
1686 |
7.8 |
|
Clothing, shoes and hats, knitted textiles |
791 |
-22.8 |
4084 |
-6.0 |
|
Cosmetics |
214 |
-22.3 |
1168 |
-3.6 |
|
Gold and silver jewelry |
158 |
-26.7 |
987 |
0.2 |
|
Daily necessities |
495 |
-10.2 |
2330 |
2.5 |
|
Household appliances and audio-visual equipment |
594 |
-8.1 |
2658 |
2.4 |
|
Chinese and Western Medicines |
505 |
7.9 |
1990 |
8.8 |
|
Cultural office supplies |
271 |
-4.8 |
1211 |
6.7 |
|
furniture |
111 |
-14.0 |
450 |
-8.9 |
|
Communication equipment |
347 |
-21.8 |
1922 |
-1.6 |
|
Petroleum and products |
1740 |
4.7 |
7131 |
15.7 |
|
automotive |
2567 |
-31.6 |
13335 |
-8.4 |
|
Construction and decoration materials |
142 |
-11.7 |
541 |
-0.7 |
|
6. Import and export (100 million yuan) |
||||
|
Total import and export |
31600 |
0.1 |
125799 |
7.9 |
|
Export value |
17426 |
1.9 |
69674 |
10.3 |
|
Import value |
14175 |
-2.0 |
56125 |
5.0 |
|
7. Consumer Price |
… |
2.1 |
… |
1.4 |
|
Food, tobacco and alcohol |
… |
1.9 |
… |
-0.5 |
|
clothes |
… |
0.5 |
… |
0.5 |
|
live |
… |
1.2 |
… |
1.3 |
|
Daily necessities and services |
… |
1.2 |
… |
0.7 |
|
Transportation communication |
… |
6.5 |
… |
5.8 |
|
Education, culture and entertainment |
… |
2.0 |
… |
2.5 |
|
medical insurance |
… |
0.7 |
… |
0.6 |
|
Other Supplies and Services |
… |
1.7 |
… |
1.0 |
|
8. Ex-factory price for industrial producers |
… |
8.0 |
… |
8.5 |
|
means of production |
… |
10.3 |
… |
11.0 |
|
mining |
… |
38.3 |
… |
36.1 |
|
raw materials |
… |
17.4 |
… |
17.6 |
|
processing |
… |
4.8 |
… |
6.0 |
|
means of living |
… |
1.0 |
… |
0.9 |
|
food |
… |
1.6 |
… |
0.8 |
|
clothes |
… |
0.7 |
… |
1.1 |
|
General daily necessities |
… |
1.8 |
… |
1.6 |
|
consumer durables |
… |
-0.1 |
… |
0.3 |
|
9. Purchase price of industrial producers |
… |
10.8 |
… |
11.2 |
|
Note: 1.The growth rate of industrial added value above designated size and its classified items shall be calculated at comparable prices; unless otherwise specified, the growth rate of other indicators shall be calculated at current prices. 2.Import and export data come from the General Administration of Customs. 3.Some of the data in this table may not be equal to the total and sub-total due to rounding. |
||||
attached drawings
[
责编:袁晴 ]
