
Demonstration of strength and faith, the 13th generation Intel Core i9-13900KS processor challenges the limit again. The factory preset dual-core 6GHz Turbo clock speed, priced at $699 in US dollars, allows players to open the box and install the machine to have the fastest processor performance; and this test uses ASRock Z790 Taichi motherboard, black gold gear with 24-phase 105A SPS power supply, easily unlocking 6GHz Turbo clock.
My banknote ability! Intel Core i9-13900KS dual-core super 6GHz
Faith flagship 13th generation Intel Core i9-13900KS processor Raptor Lake maintains hybrid core architecture, upgraded Intel 7 process, 3rd gen Intel SuperFin transistor, and Raptor Cove core tuned to dual-core 6GHz high clock speed, enlarged L2 cache and doubled E-core efficiency core.
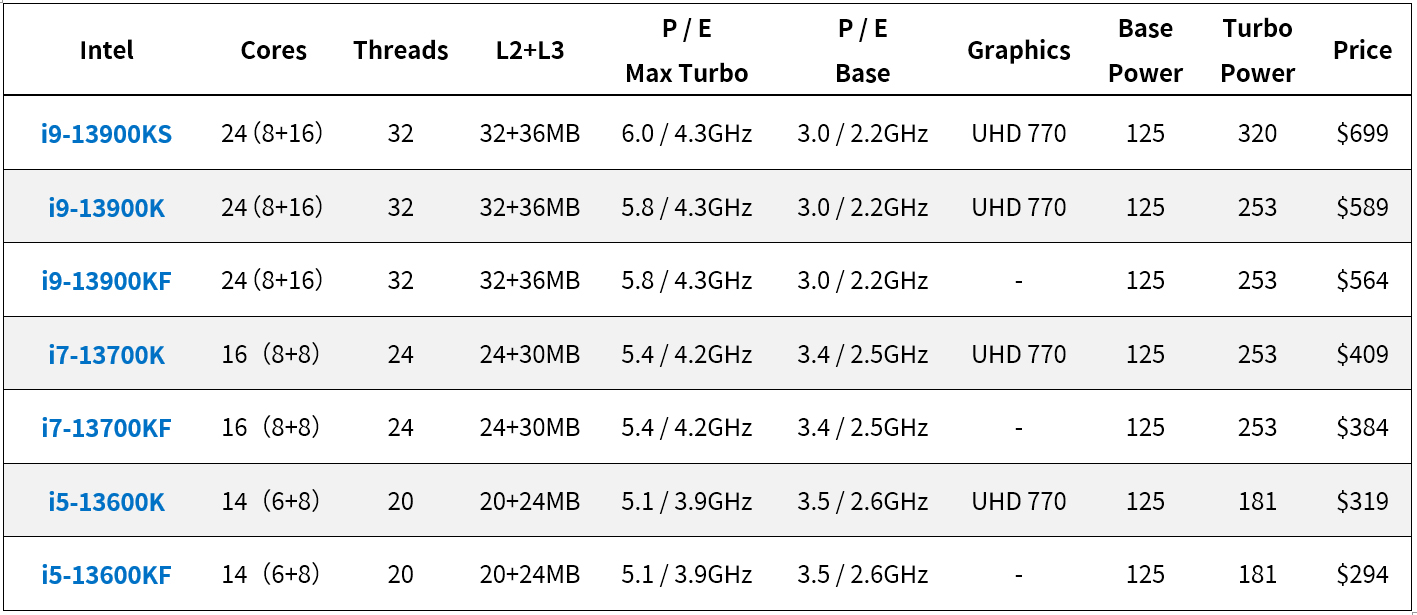
↑ 13th Generation Intel Core K-Series Processor Specifications.
The i9-13900KS maintains 8 P-cores, 16 E-cores, 24 cores and 32 execution threads. The processor clock speed is tuned to P-core dual-core 6.0GHz, all-core 5.6GHz, and E-Core is all-core 4.3 GHz high clock rate; compared to i9-13900K, it is mainly an upgrade of full core + 100MHz and dual core + 200MHz.
As for power consumption, the i9-13900KS is comparable to the i9-13900K, with a maximum FPU power consumption of 300W; while the i9-13900KS is priced at $699 in US dollars, and it is estimated that the price in Taiwan may be more than 25,000 yuan, as long as the player’s budget is sufficient You can unlock the high clock speed of 6.0GHz Turbo right out of the box and installed.
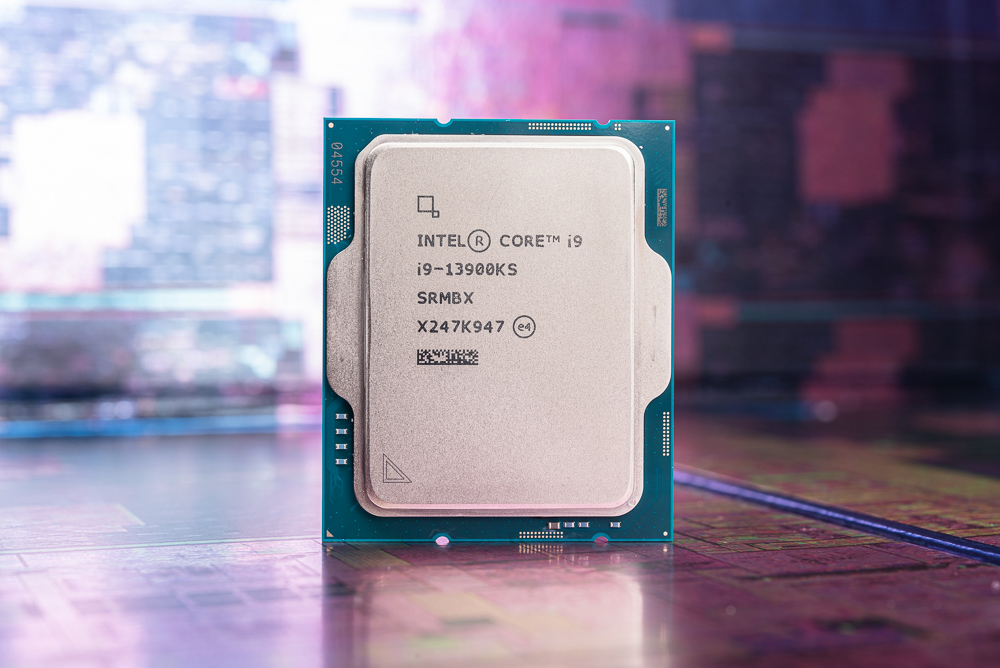
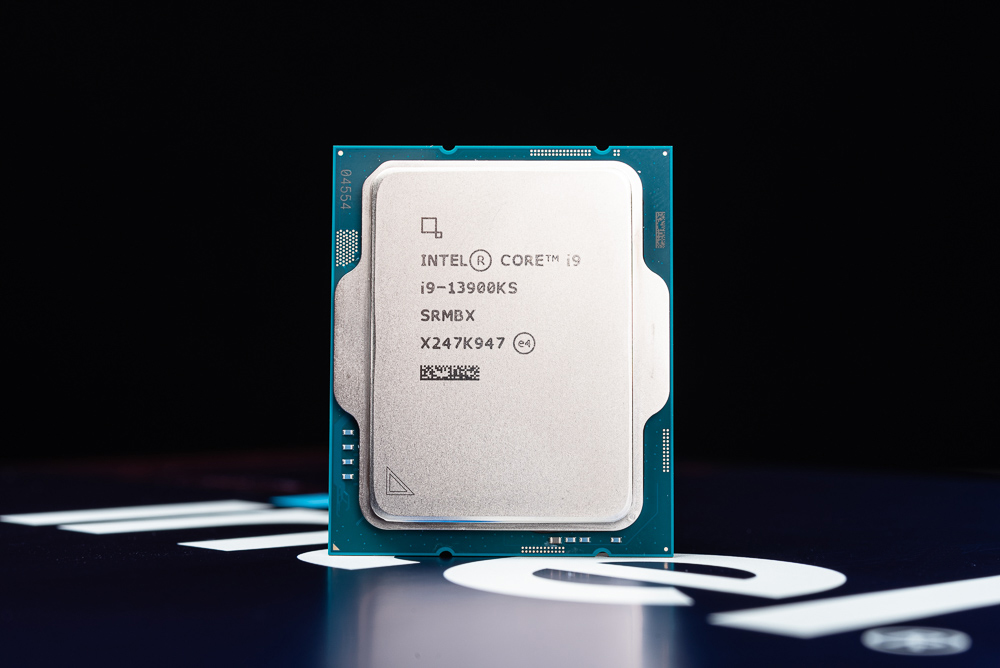
↑ Intel Core i9-13900KS。
ASRock Z790 Taichi black gold gear 24-phase 105A powerful power supply
To unlock the ultimate performance of Intel Core i9-13900KS, in addition to using 360mm AIO water cooling, it also needs the flagship motherboard “ASRock Z790 Taichi” with powerful power supply. The black gold gear has 24-phase 105A SPS power supply and fully supports PCIe 5.0 graphics card and SSD , with 8 SATA, 4 M.2, Thunderbolt 4, front USB 20Gbps and PD 3.0 60W fast charging functions.
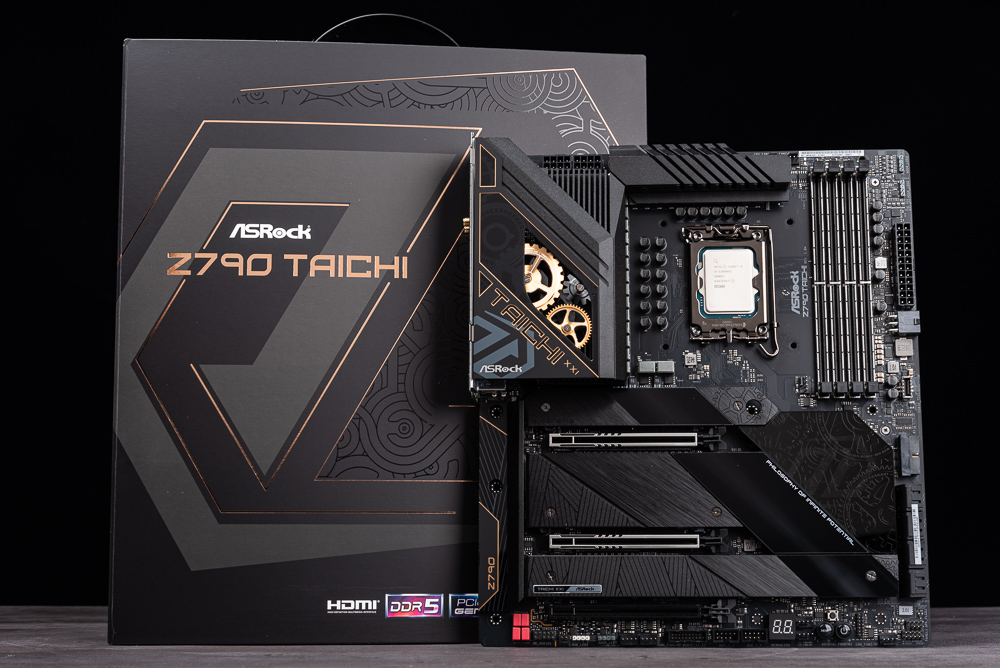
↑ ASRock Z790 Taichi and i9-13900KS.
Z790 Taichi has black and gold gear shapes intertwined with different lines such as low-key and attractive gear lines, hairline lines, and lines; the motherboard provides 4 DIMM DDR5 memory slots, supporting a maximum capacity of 128GB and the possibility of overclocking memory at a maximum of 7000MHz; The front USB 3.2 Gen 2×2 Type C also supports USB PD 3.0 20V/3A/60W fast charging function.
↑ Armor-reinforced DDR5 memory slot and front USB 3.2 Gen 2×2 Type C power supply (PCIe 6 pin).
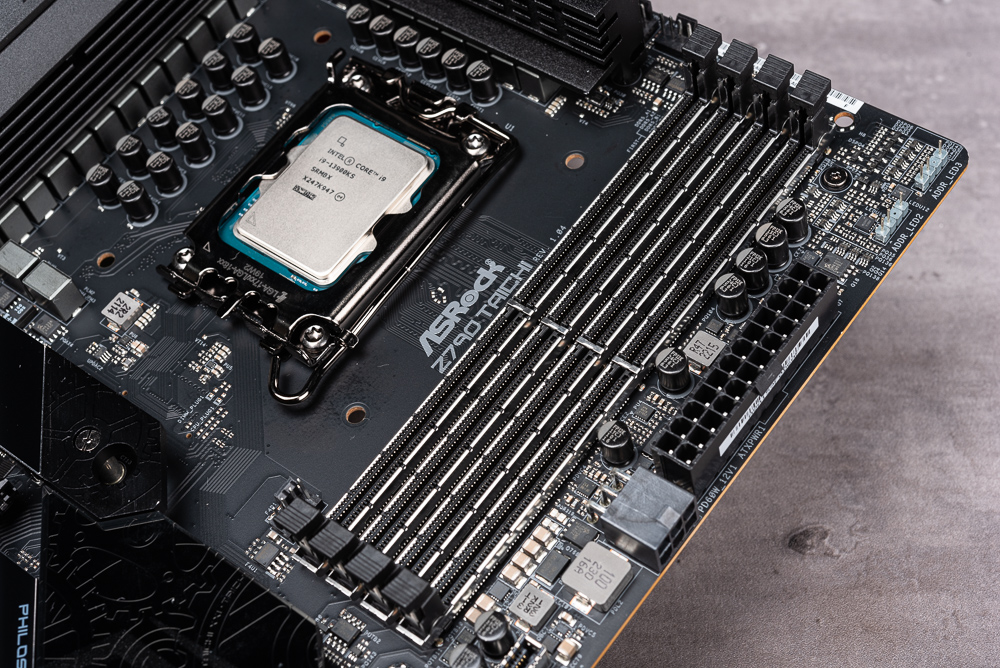
The CPU of Z790 Taichi is powered by 24-phase 105A SPS, supports 12th and 13th generation processors, LGA 1700 pins, and there is a large VRM radiator around the CPU, and a MOS FAN is hidden under the gear on the left hand side for cooling The device can actively dissipate heat for the VRM power supply components.
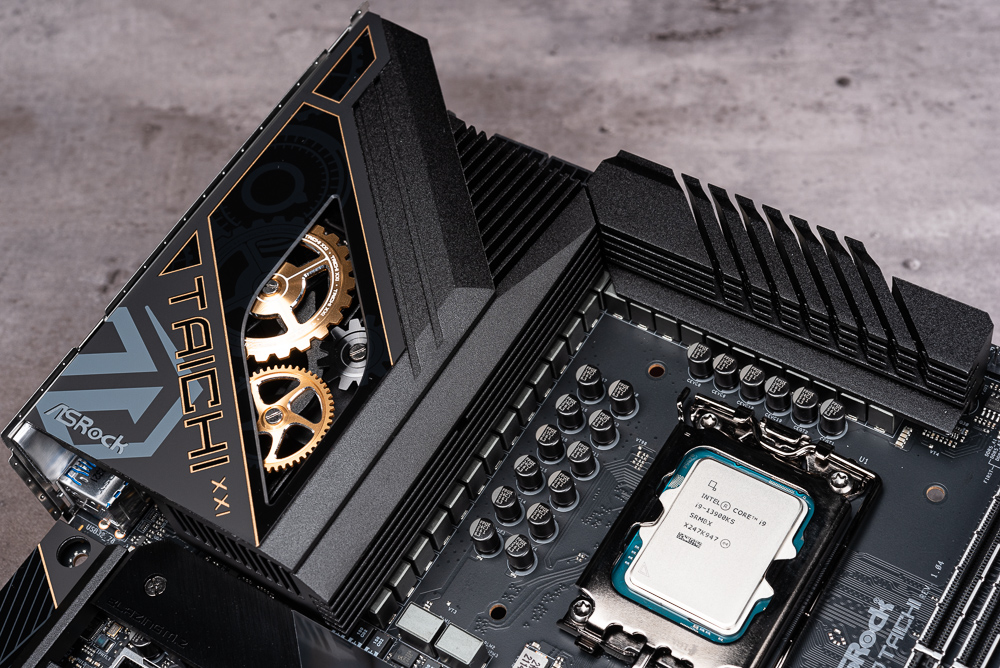
↑ CPU、VRM。
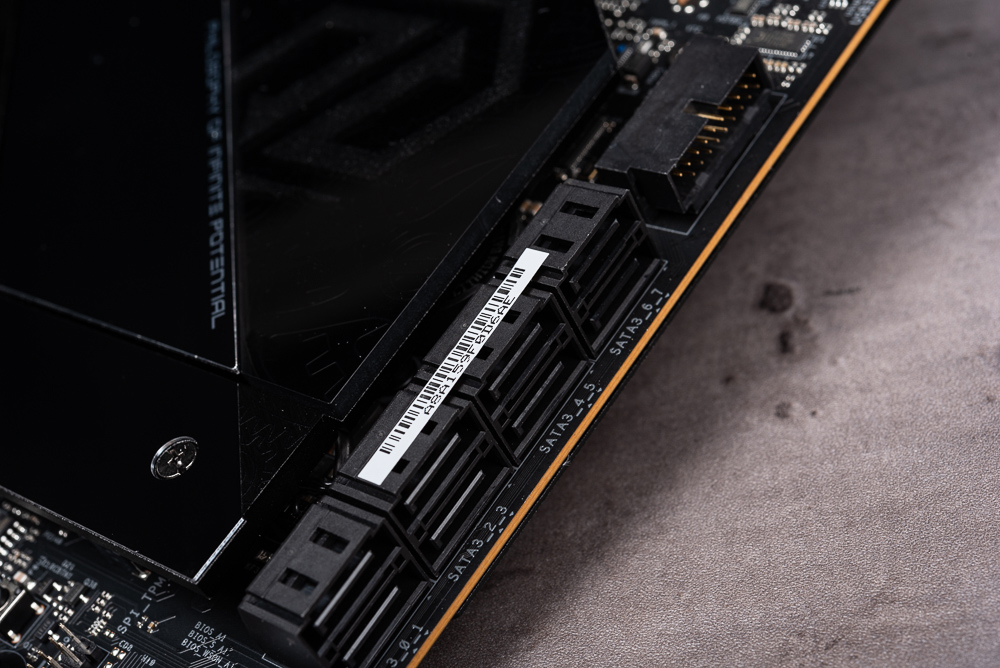
↑ There are 8 Himile SATA ports on the lower right corner of the motherboard.
PCIe slots and M.2 heat sinks, the first PCIe1 slot supports PCIe 5.0 x16, while the second PCIe2 slot is split with PCIe1, that is, dual cards use x8/x8, as for the third PCIe3 It is PCIe 4.0 x4.
In addition, the motherboard has 5 M.2 slots, but the M.2_1 and M.2_2 slots physically conflict, so you can only use one of them. First of all, the Blazing M2_1 under the CPU uses the PCIe 5.0 x4 channel split by the CPU, while the Hyper M2_2 uses the original PCIe 4.0 x4 channel of the CPU. As for the Hyper M2_3, Hyper M2_4, and Hyper M2_5, they all support the PCIe 4.0 x4 channel.
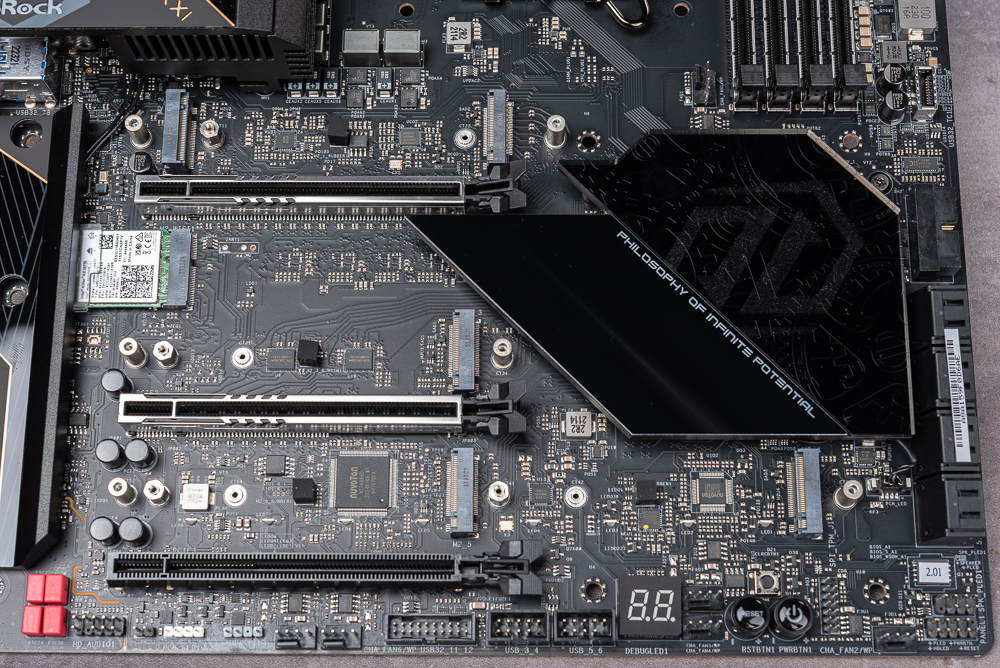
↑ PCIe and M.2 slots.
Motherboard with integrated backplane, rear I/O offers 2x USB 2.0, HDMI, Wi-Fi antenna, 3.5mm headphone/mic/SPDIF, Lighting Gaming USB, 6x 3.2 Gen 1, 2x USB 3.2 Gen 2 , 2 Thunderbolt 4 Type C.
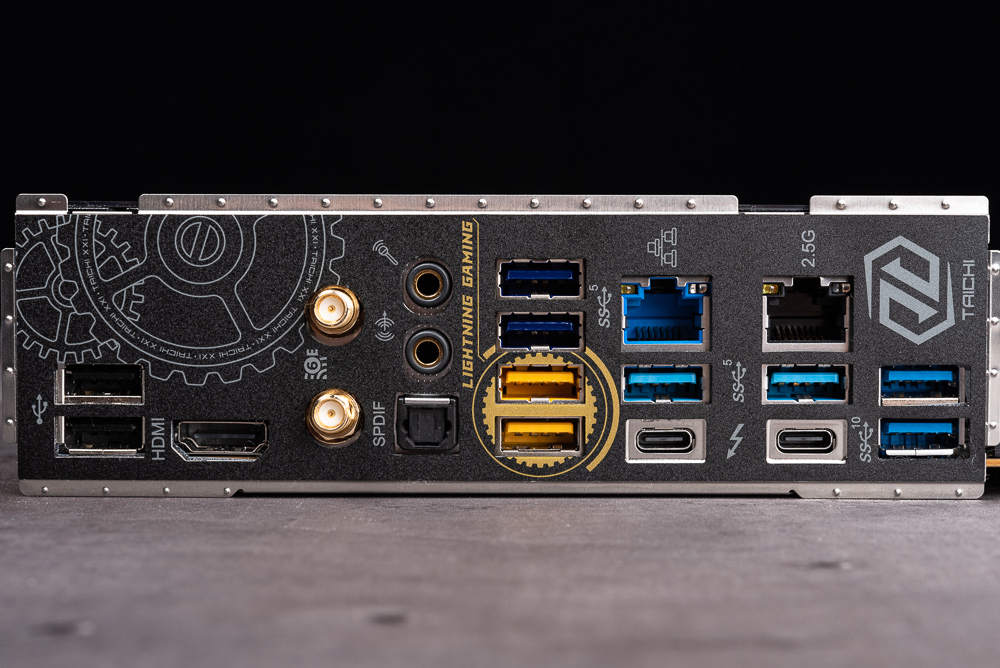
↑ Rear motherboard I/O.
Test platform and settings
This test mainly focuses on the performance of Intel Core i9-13900KS, and compares Intel Core i9-13900K and AMD Ryzen 9 7950X and other flagship processors; the radiator uses AIO 360mm water-cooled radiator uniformly, and is set to the motherboard default Auto unlock Power consumption is limited, DDR5-6000 XMP memory is applied, and PBO 200MHz overclocking is enabled on the AMD platform; the test platform is provided as follows for your reference.
testing platform
Processor: Intel Core i9-13900KS/i9-13900K, AMD Ryzen 9 7950X
Motherboard: ASRock Z790 Taichi, ROG CROSSHAIR X670E HERO
Memory: G.SKILL TRIDENT Z5 NEO DDR5-6000 16GBx2
Graphics Card: NVIDIA GeForce RTX 4090
System drive: Solidigm P41 Plus 1TB PCIe 4.0 SSD
Radiator: 360mm AIO liquid cooler
Power supply: Seasonic PRIME PX-1000
OS: Windows 11 Pro 22H2
CPU-Z Check the Intel Core i9-13900KS processor information, it belongs to Raptor Lake, 10nm process generation, TDP 150W, has 8P + 16E core, 32 execution threads, the tested board is Z790 Taichi, and the memory is DDR6 6000 16GBx2.
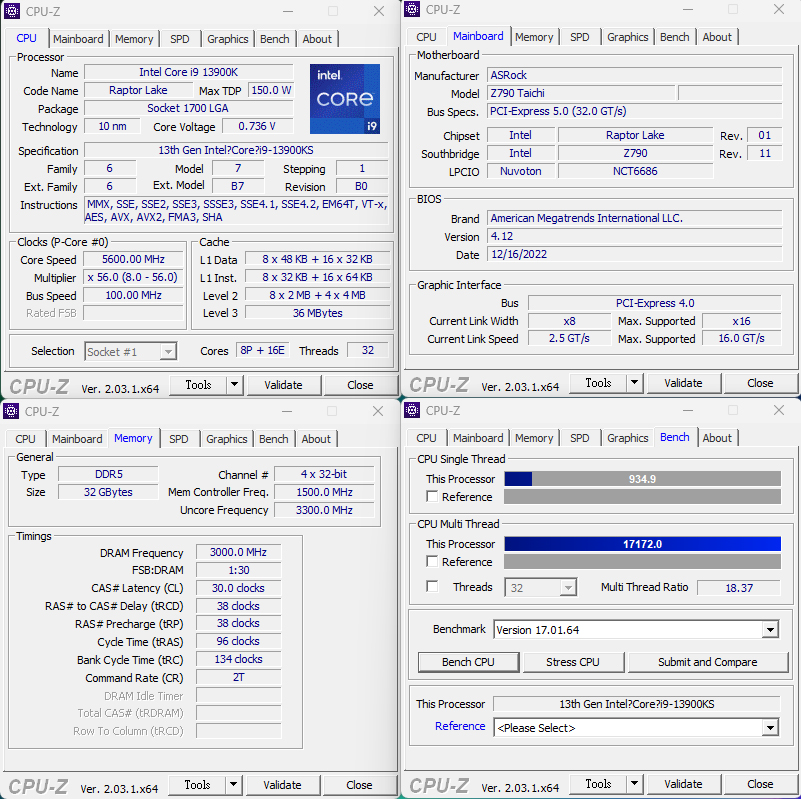
↑ CPU-Z。
Processor computing performance Cinebench, VRay rendering test
CINEBENCH R20developed by MAXON based on Cinema 4D, can be used to evaluate the 3D rendering performance of computer processors. It is also a reliable test software that can quickly evaluate the performance of CPU multi-core computing.
nT multi-threaded i9-13900KS achieved a score of 15659 points, 1T single-threaded 900 points, compared to i9-13900K, nT has not grown much but 1T has a 4% increase, and compared with 7950X PBO, nT has a small win of 4.5% , 1T won 14.2%.
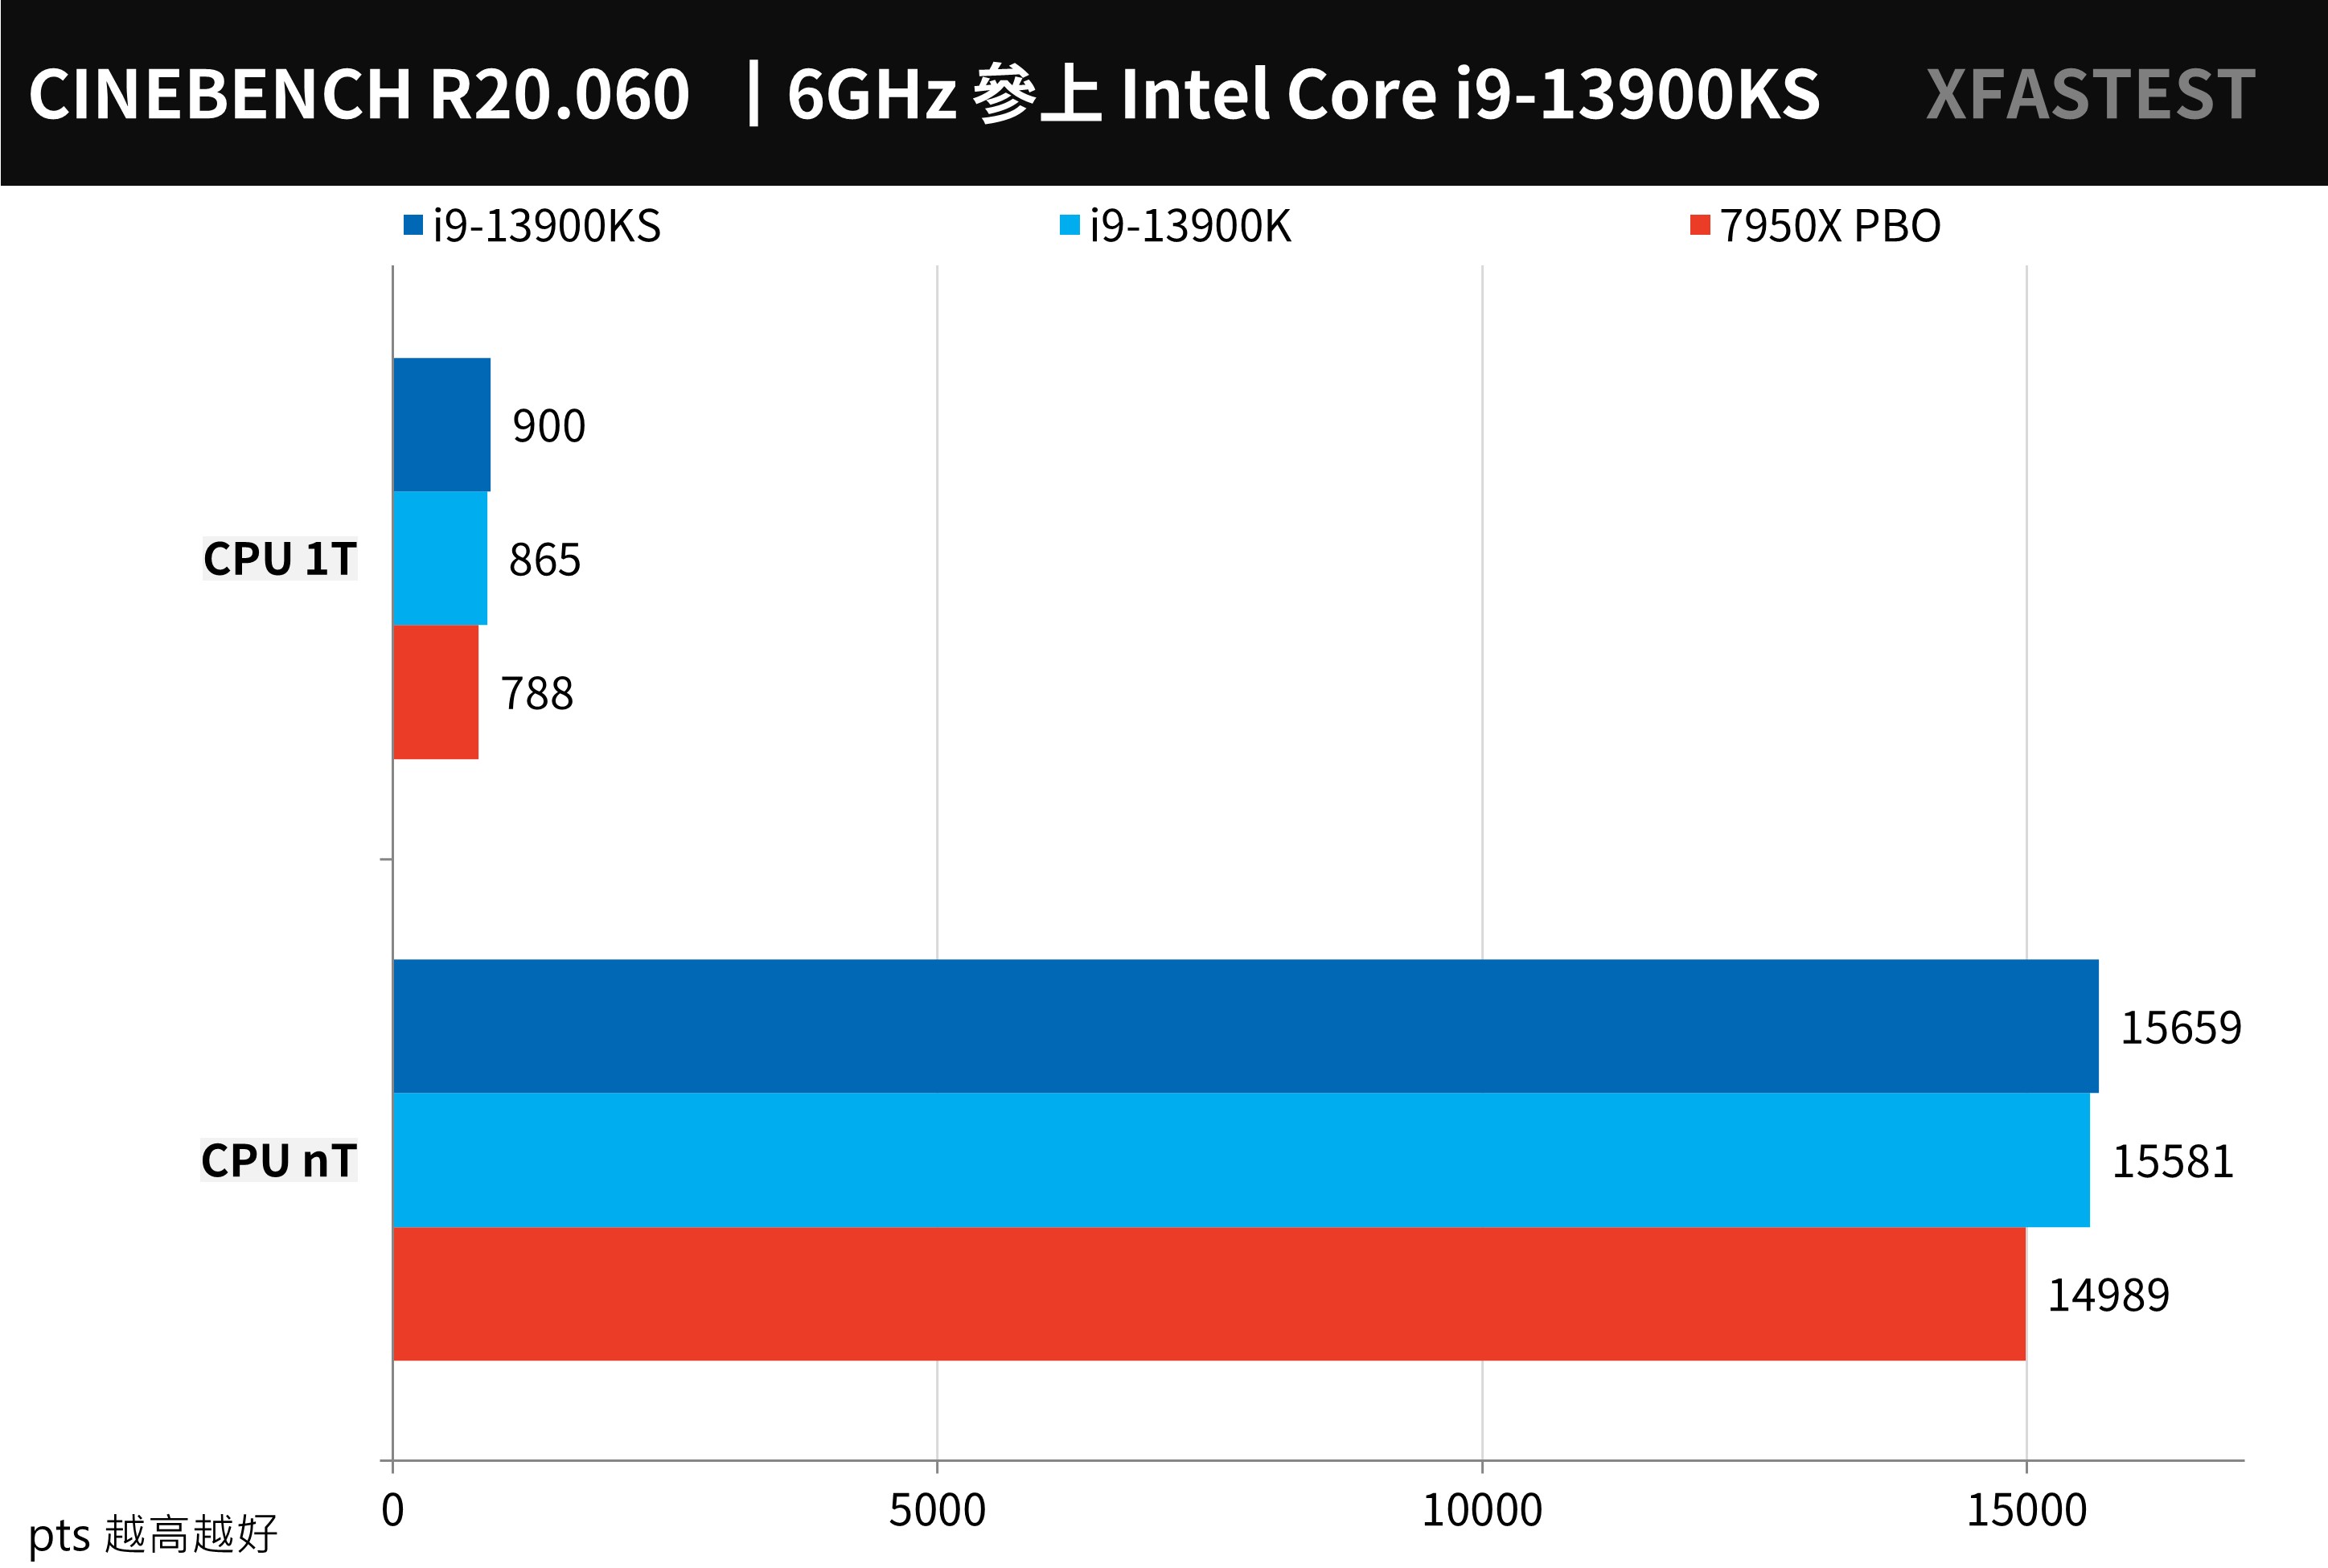
↑ CINEBENCH R20, the higher the score, the better.
CINEBENCH R23 The test scenario is the same as R20, with a new compiler and a stress test function. Players can customize the Minimum Test Duration time, such as 10 or 30 minutes to test the stability of the computer; however, the results of R23 cannot be compared with R20.
nT multi-threaded i9-13900KS achieved a score of 41318 points, 1T single-threaded 2346 points, compared to i9-13900K, the performance of nT increased by 1.9%, 1T increased by 3.5%, as for the comparison of 7950X PBO, nT has a small win of 7.1 %, 1T wins 20.1%.
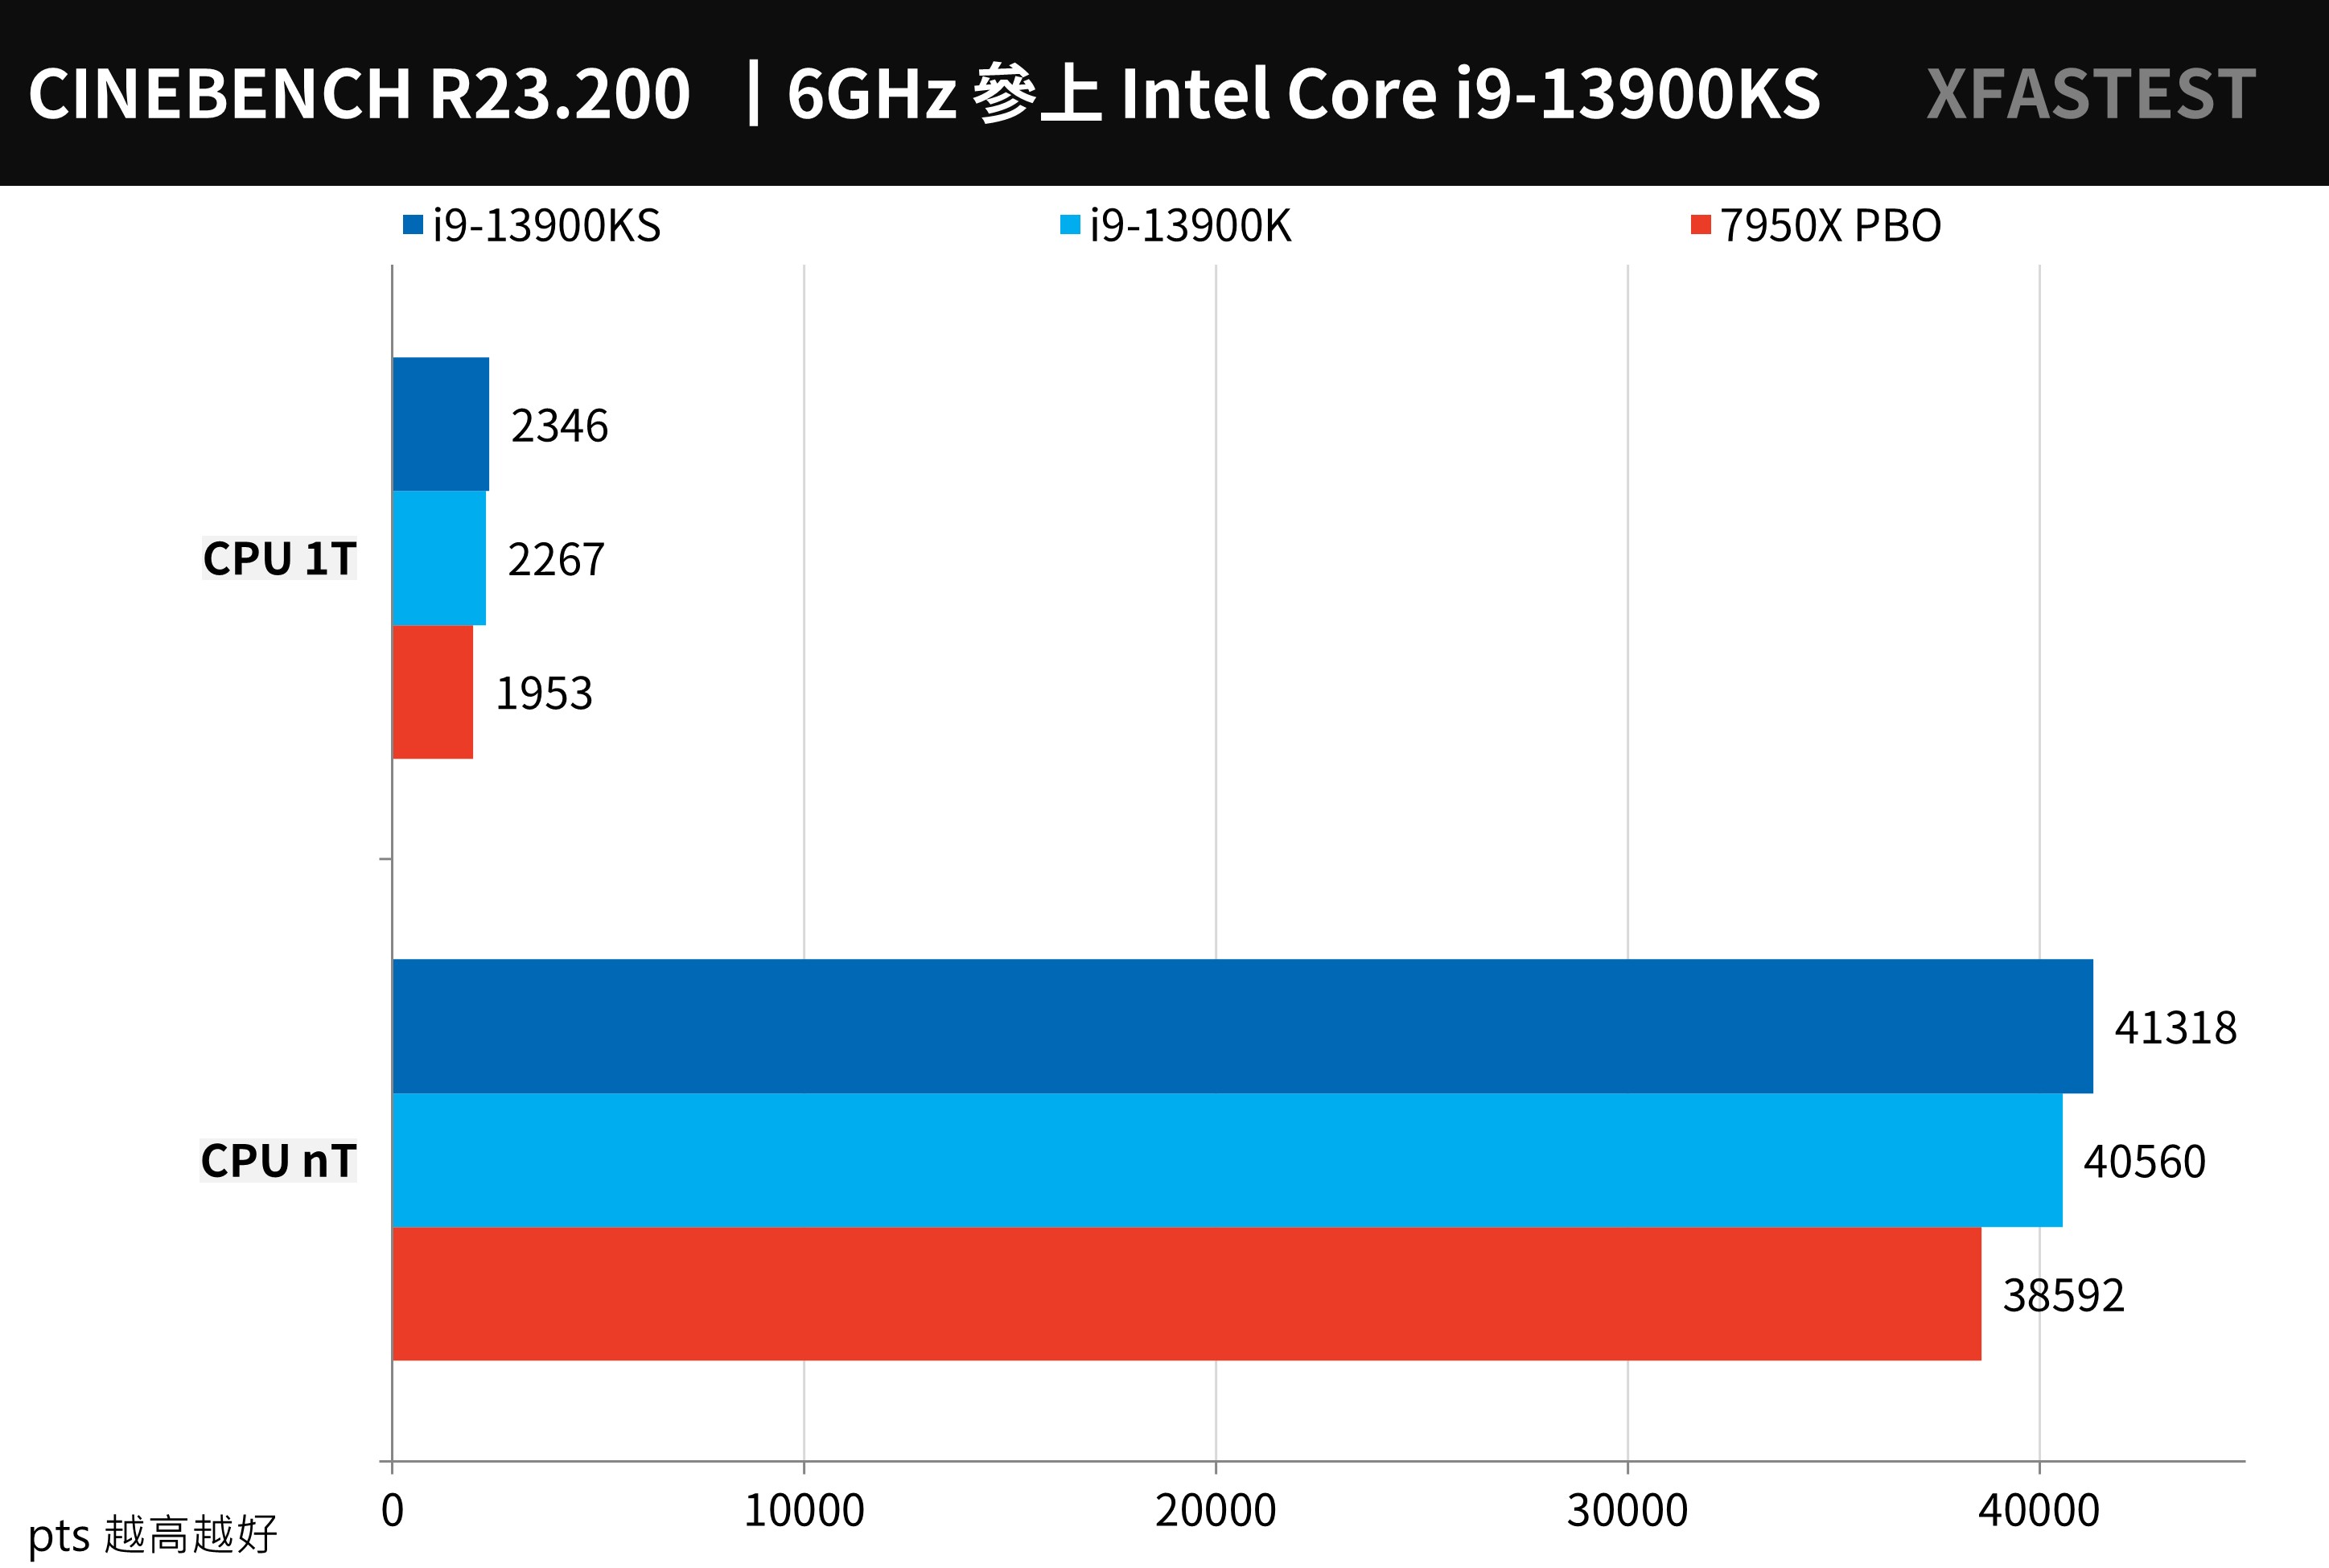
↑ CINEBENCH R23, the higher the score, the better.
Corona Benchmark It is a very easy-to-operate testing tool. It uses the Corona Renderer 1.3 renderer to test, compare the rendering speed of the processor and the performance of Rays/s, and score the timing in seconds.
Unexpectedly, the scores of i9-13900KS, i9-13900K, and 7950X PBO were all tied in 0:35 seconds.
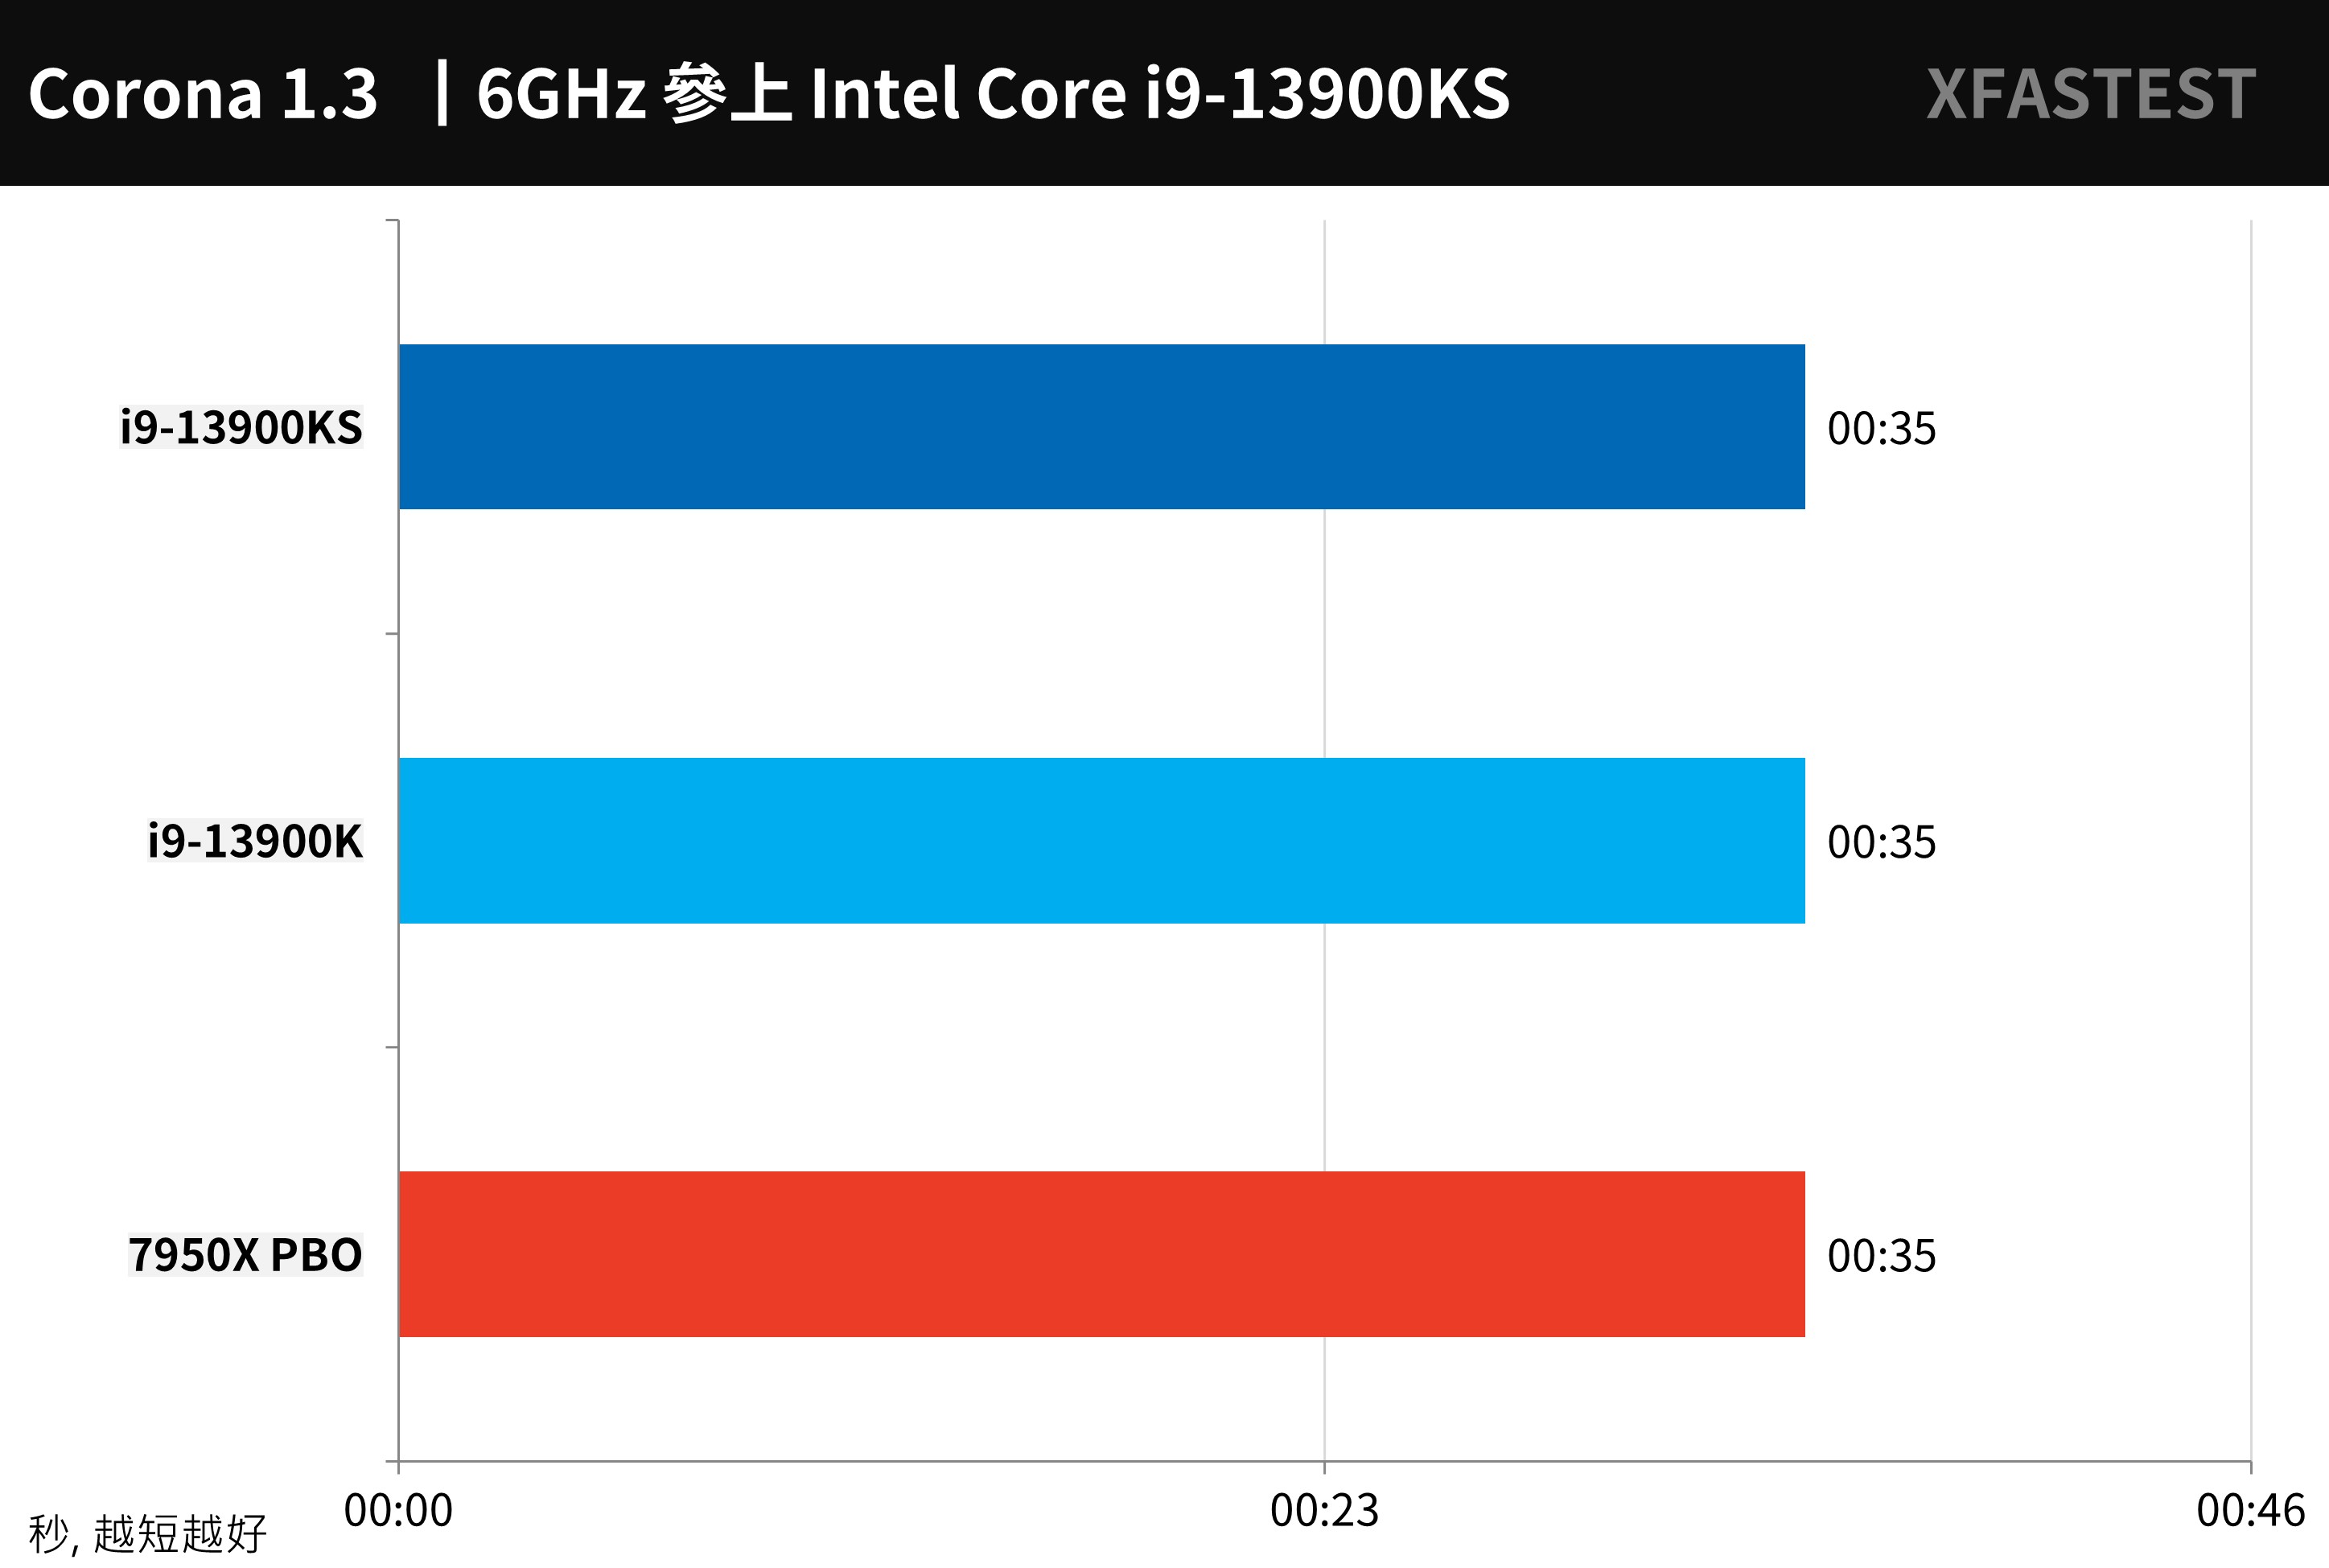
↑ Corona Benchmark, the shorter the better.
V-Ray Benchmark Developed by Chaos Group, V-Ray is a ray rendering software designed based on the laws of physics. This tool can test the computing performance of the rendered image for ray tracing on the CPU. The CPU score is calculated in units of vsamples per second.
The i9-13900KS achieved a score of 28330, which is 1.5% faster than the i9-13900K, but I did not expect that the 7950X PBO of this project had a higher score of 30168 and lost -6.1%.
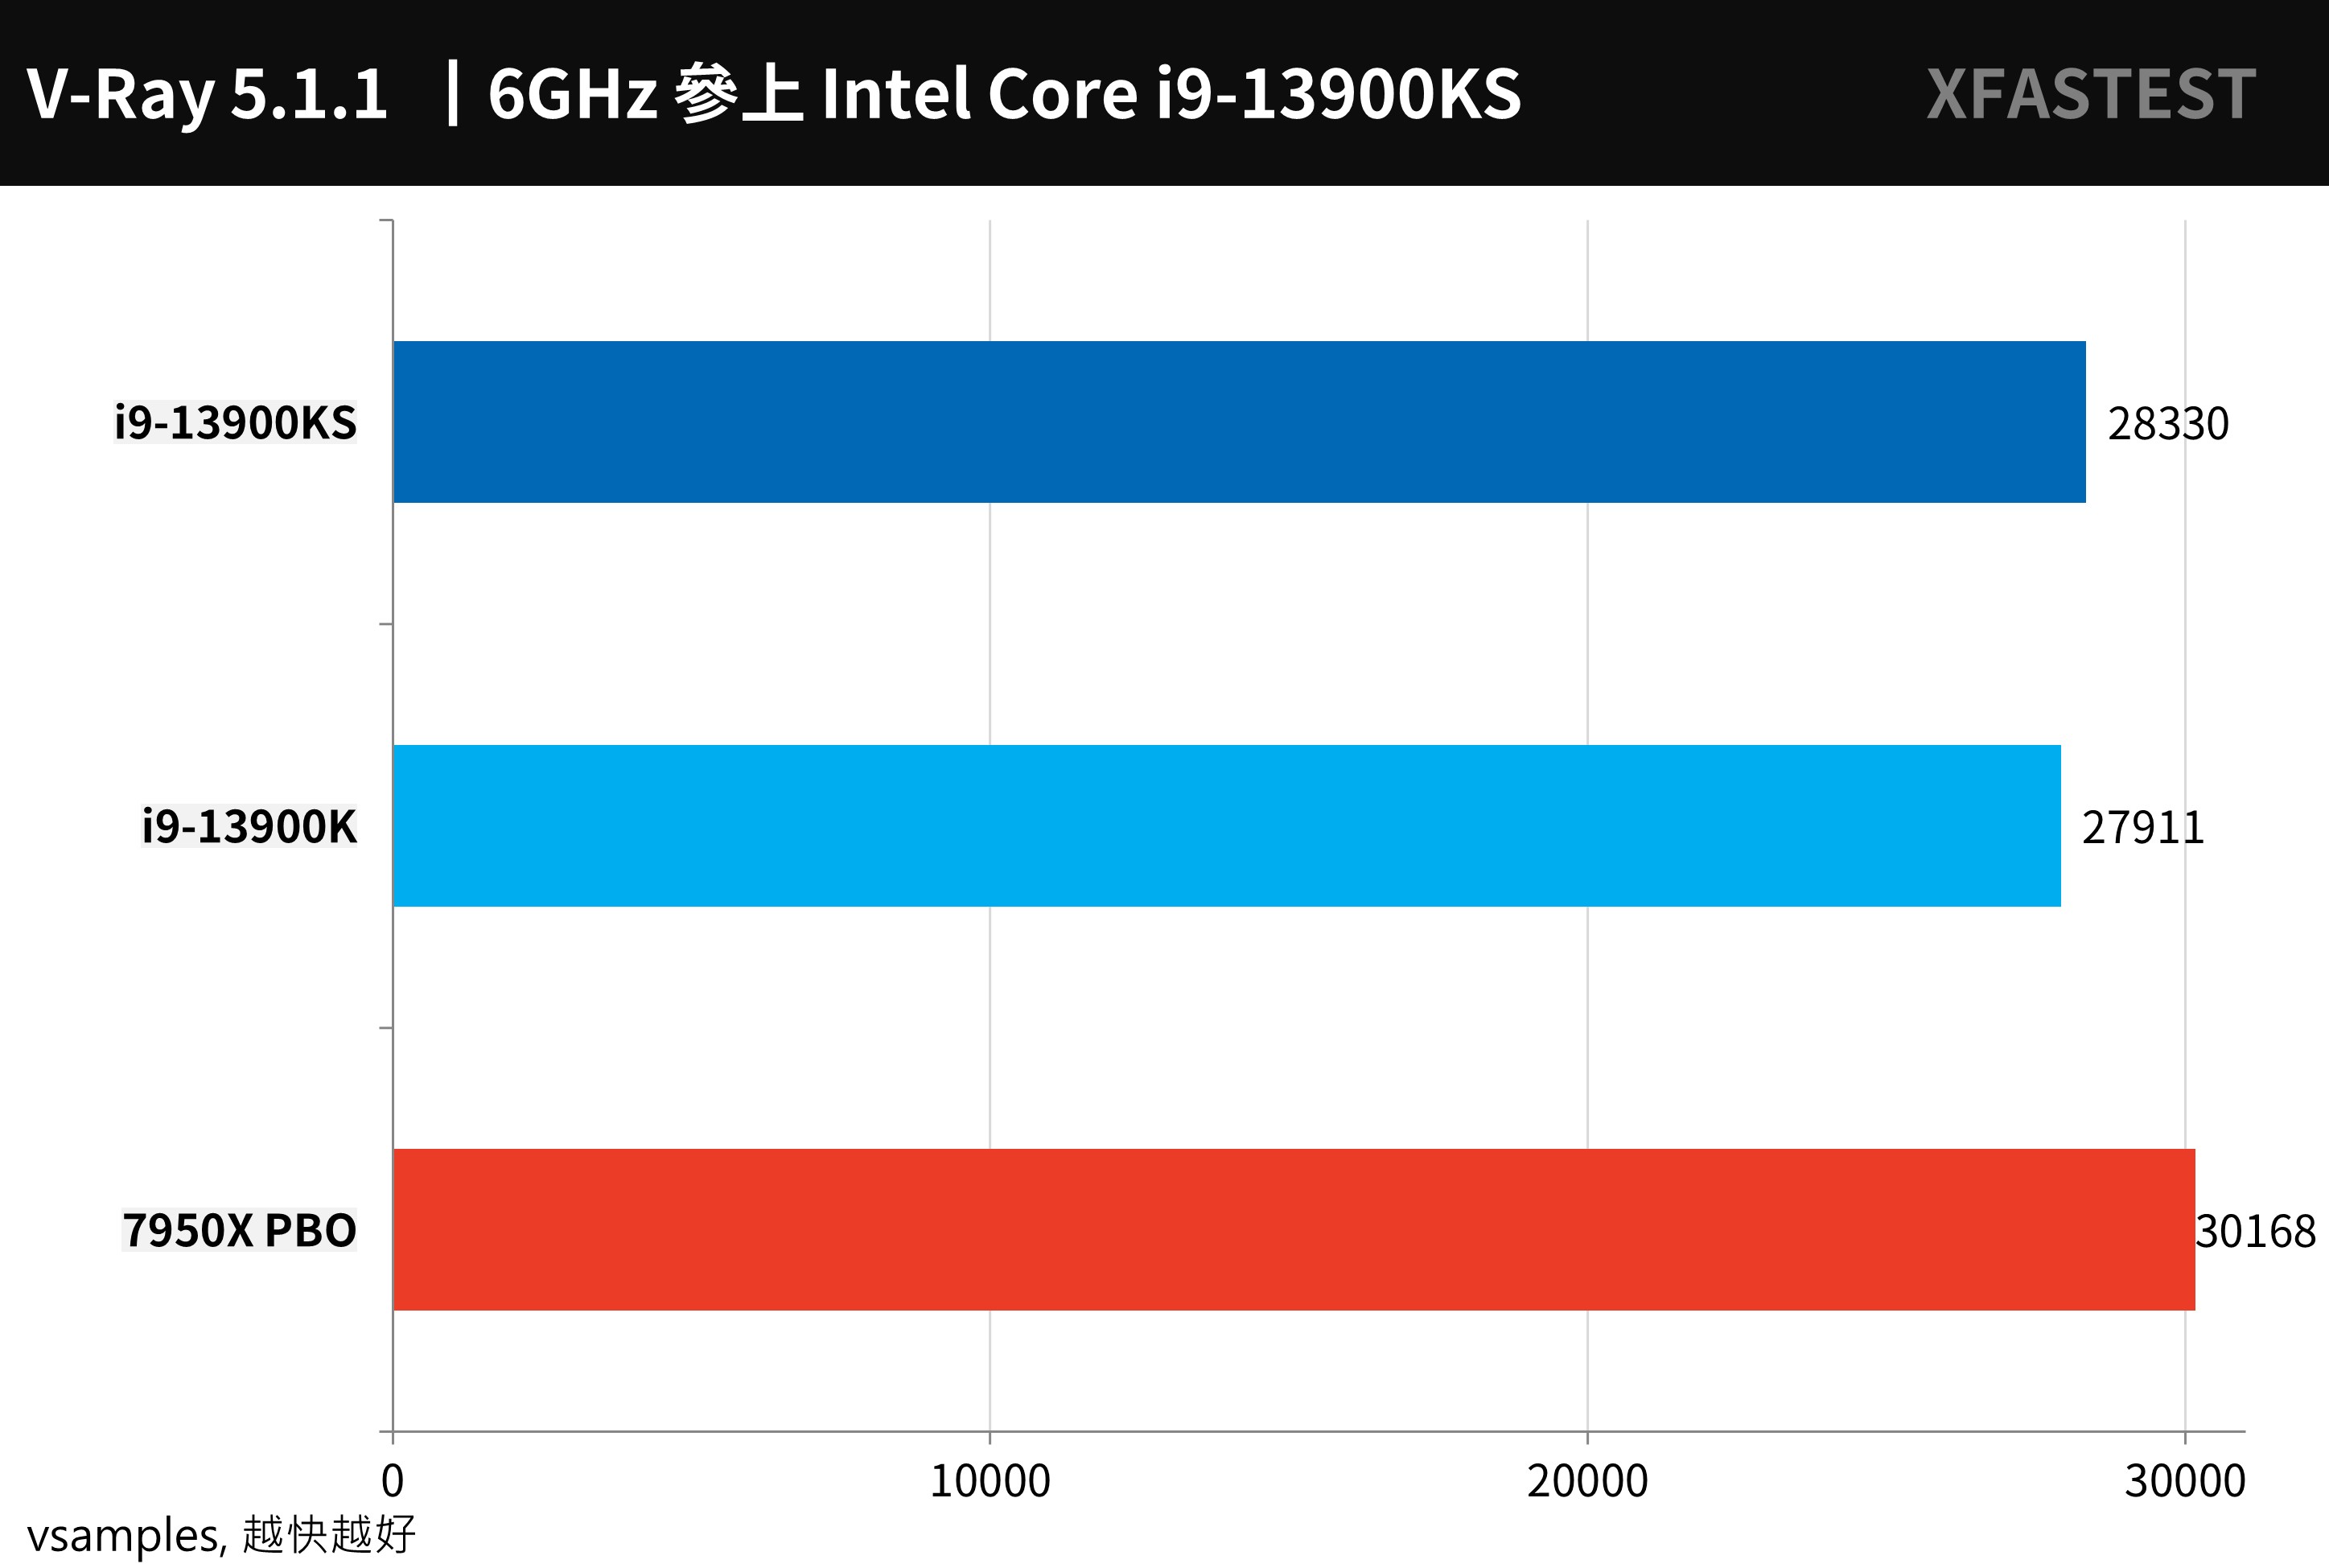
↑ V-Ray Benchmark, higher scores are better.
POV-Ray It is another set of free ray tracing 3D rendering tools, which uses the computing power of multi-core CPU to calculate the rendering of light and shadow and 3D images.
The i9-13900KS achieves 13444.66 PPS which is comparable to the i9-13900K but 6.3% faster than the 7950X PBO.
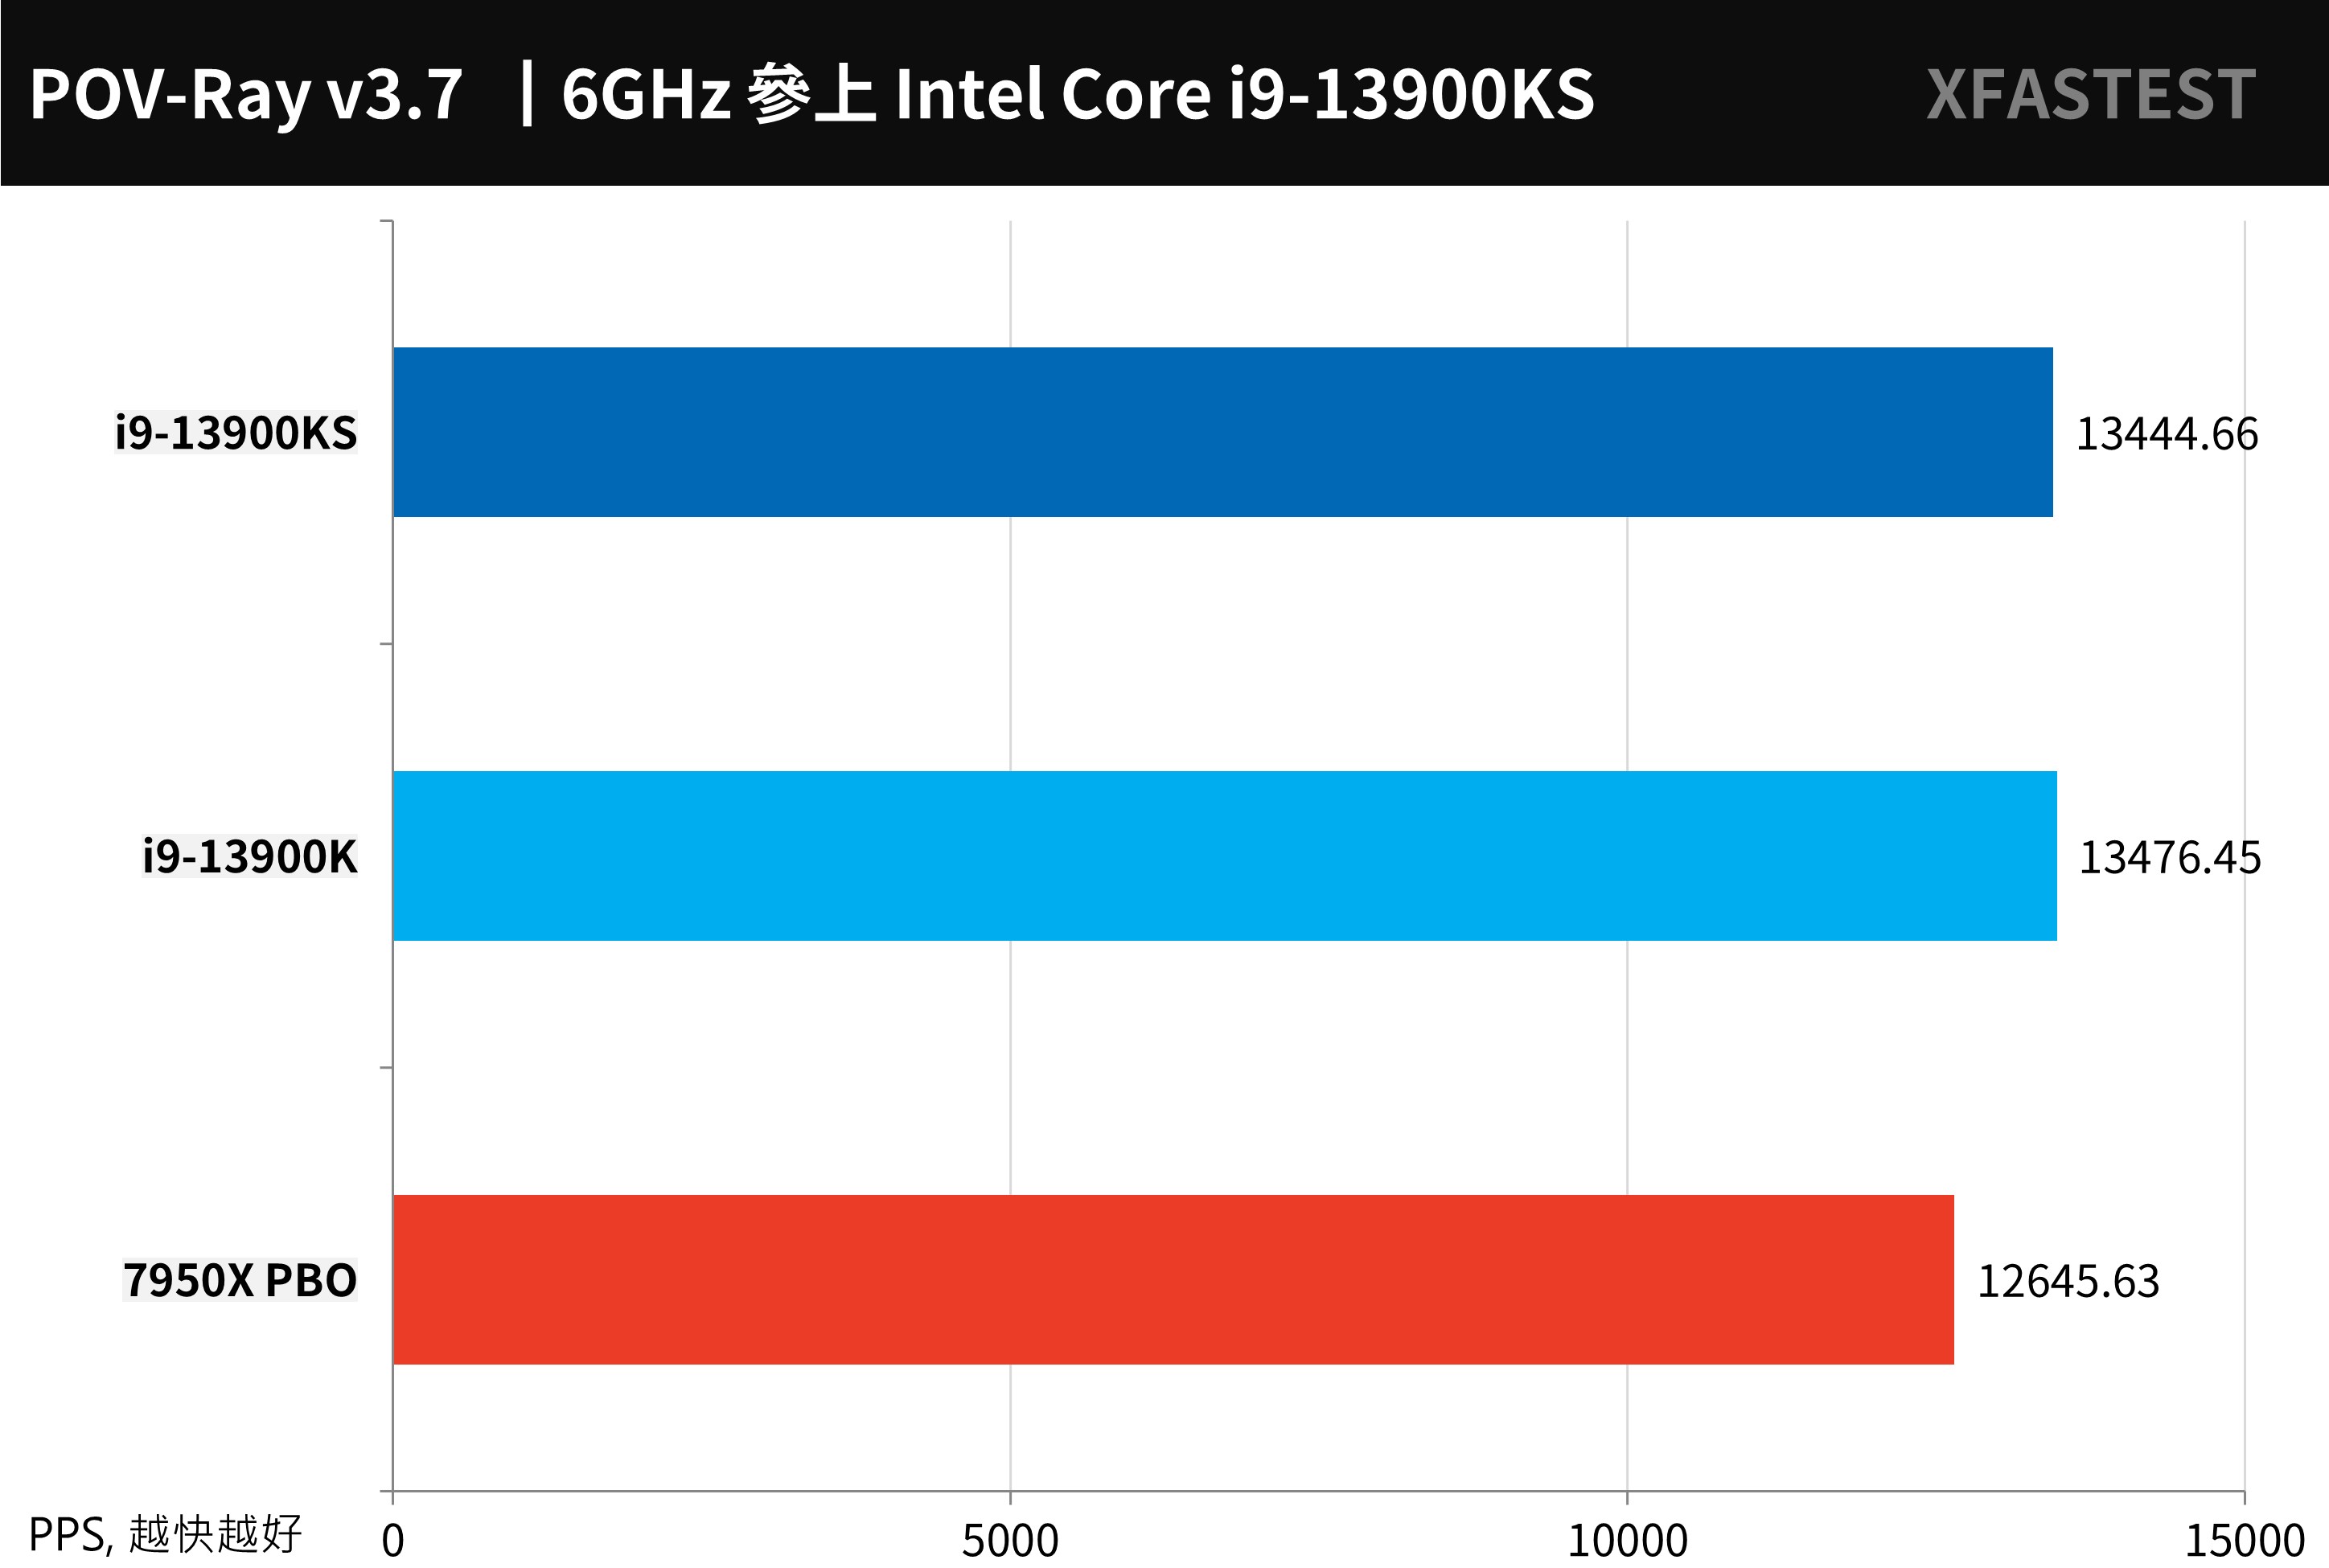
↑ POV-Ray, the higher the score the better.
Blender It is a cross-platform, open-source 3D creation tool that supports CPU and GPU rendering acceleration functions, as well as various 3D operations: Modeling, Rigging, Animation, Simulation, Rendering, Compositing and Motion Tracking, etc.
The performance of the i9-13900KS in the three test scenarios is higher than that of the i9-13900K, but in this project it loses to the 7950X PBO.
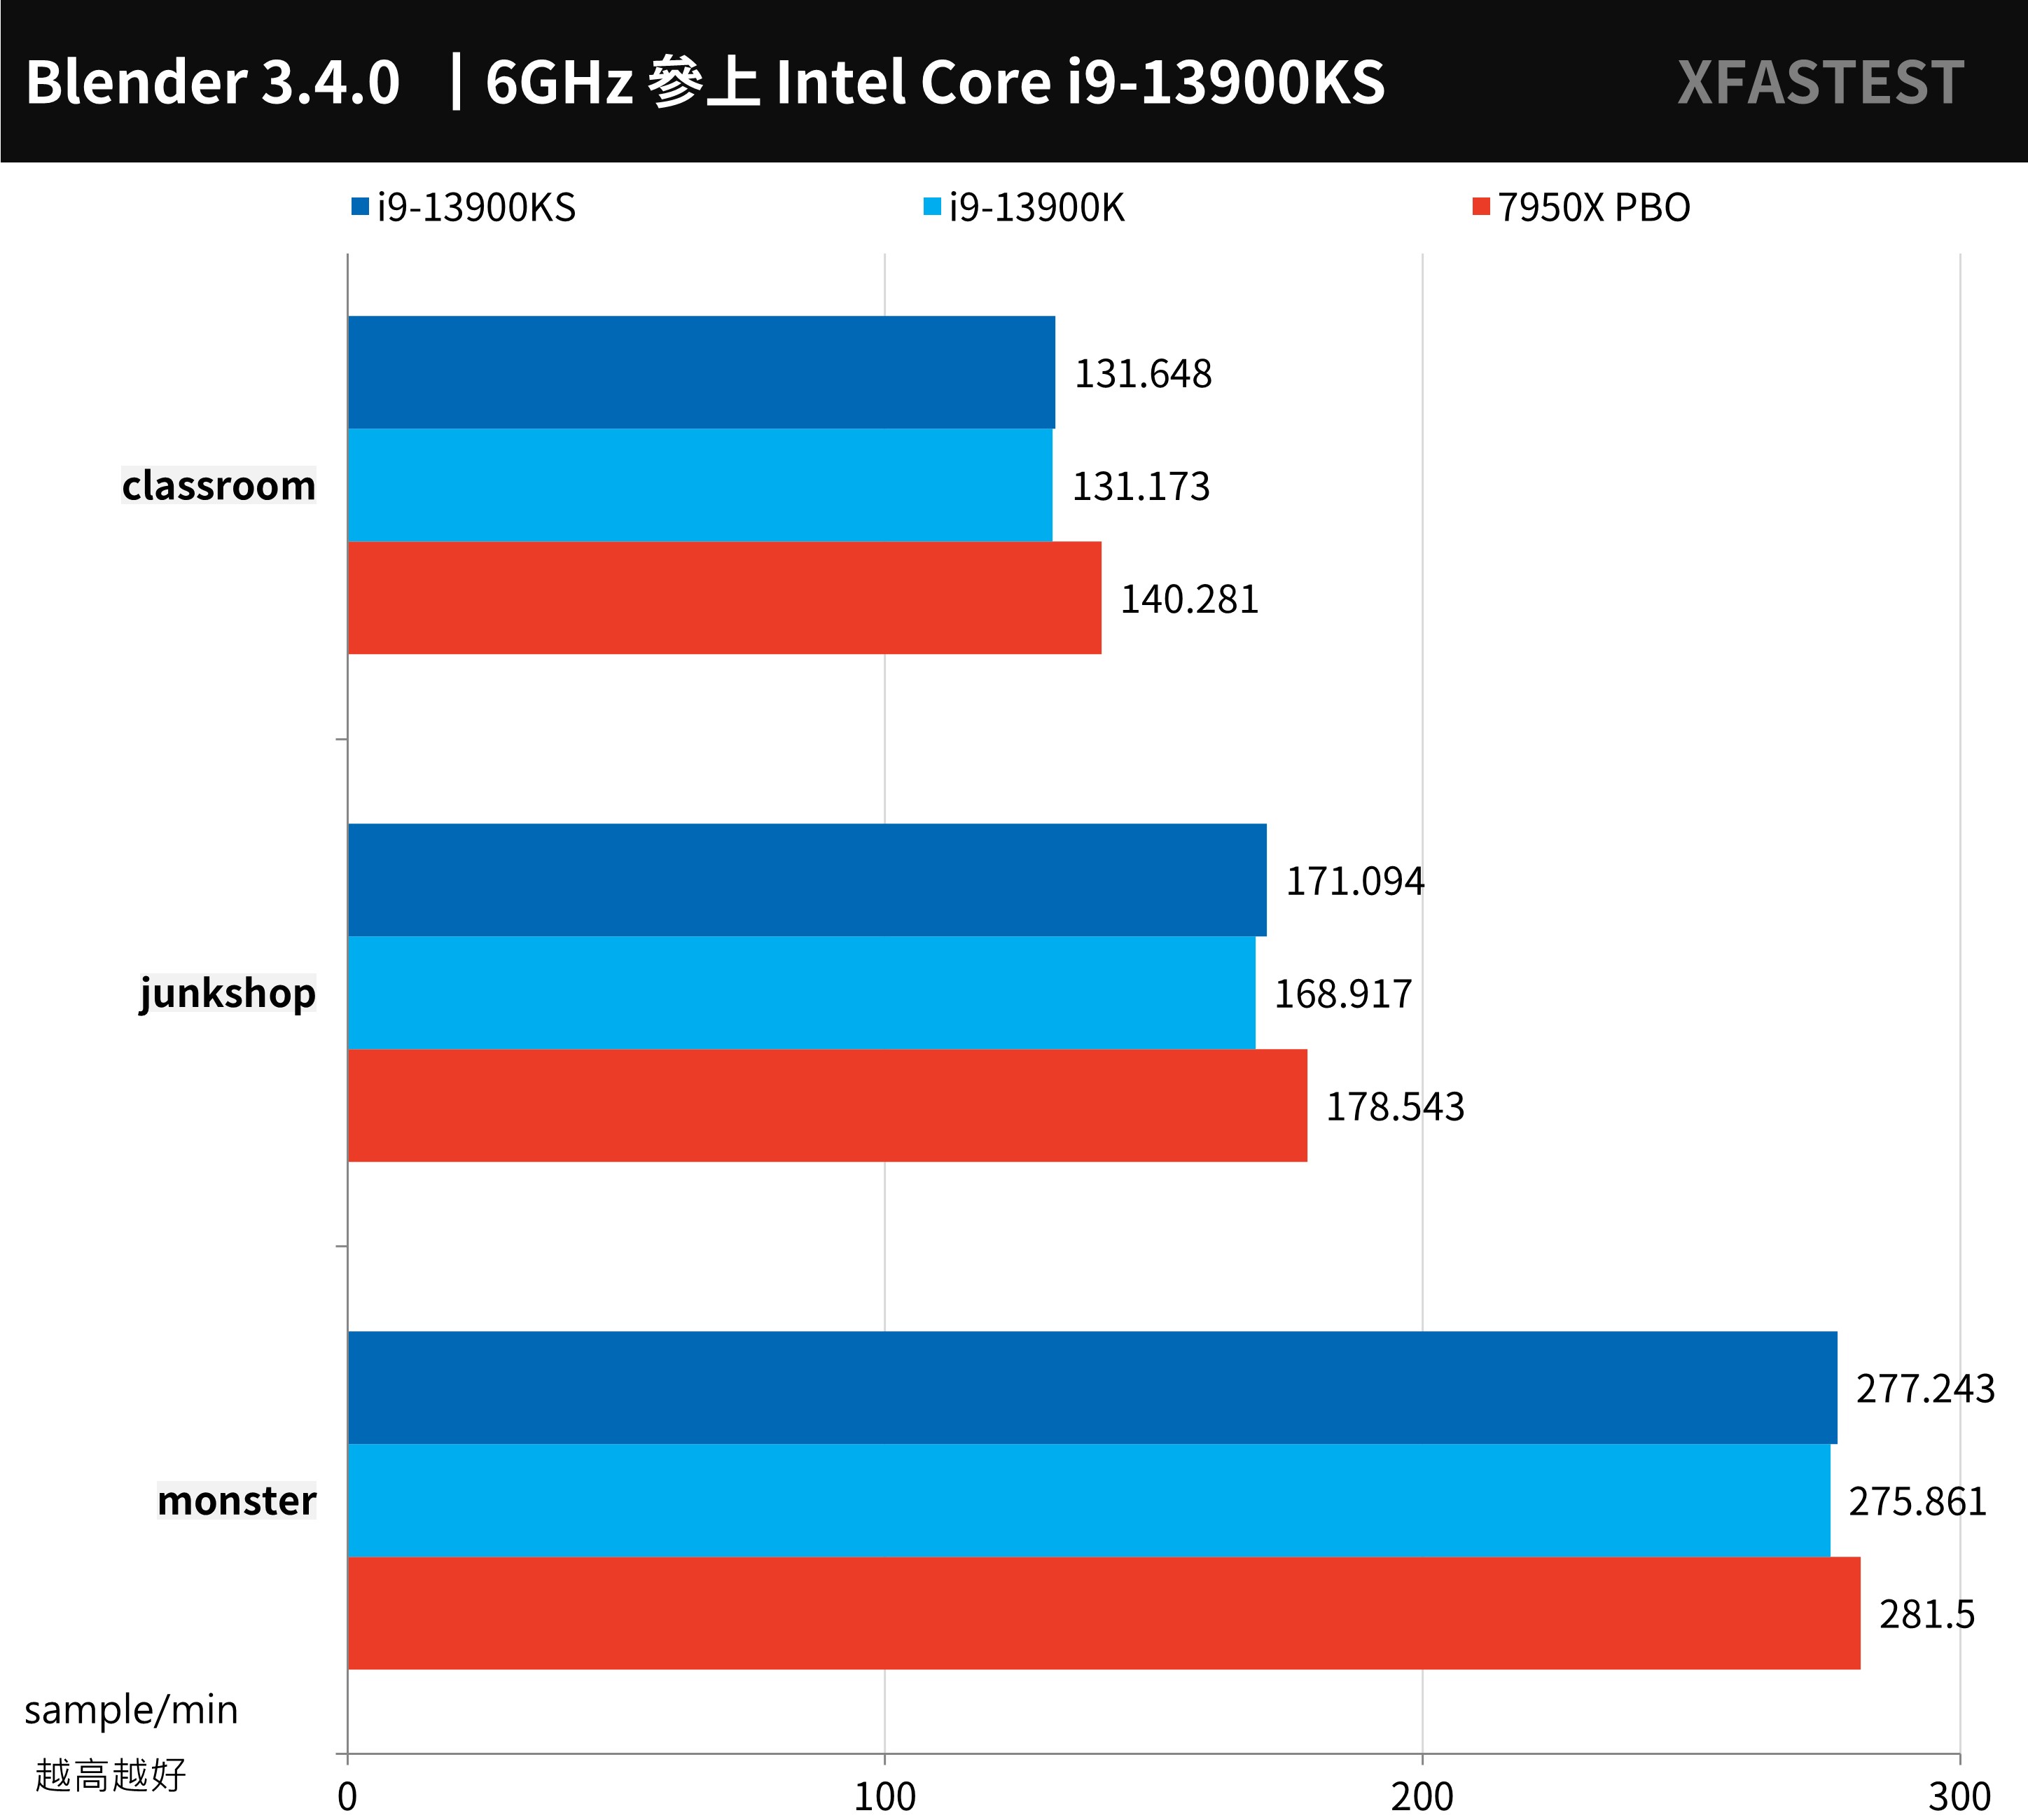
↑ Blender, the higher the score the better.
Creative PR image output, LR and PS photo editing performance test
For the conversion output test of Adobe Premiere Pro 2020, this time using UL Procyon Video Editing Benchmark Test tool, the test scenario is to use 2160p 30/60 FPS video, output as H.264 – YouTube 1080p Full HD and HEVC (H.265) – 4K UHD format respectively, and compare the output performance of pure CPU output and adding GPU acceleration . Tested using RX 7900 XTX graphics card.
The reason why i9-13900KS and i9-13900K achieve higher results is that the video output by the CPU alone is about 1 minute faster, but if the performance of GPU acceleration is the same, the performance of the three is comparable; if it is just to compare the performance of video output, the current GPU acceleration is the dominant The CPU difference is relatively insignificant under the circumstances, unless the video effects that can only be calculated by the CPU are used, or the editing operation, playback and other test items are added, the obvious difference of video editing for different CPUs can be tested.
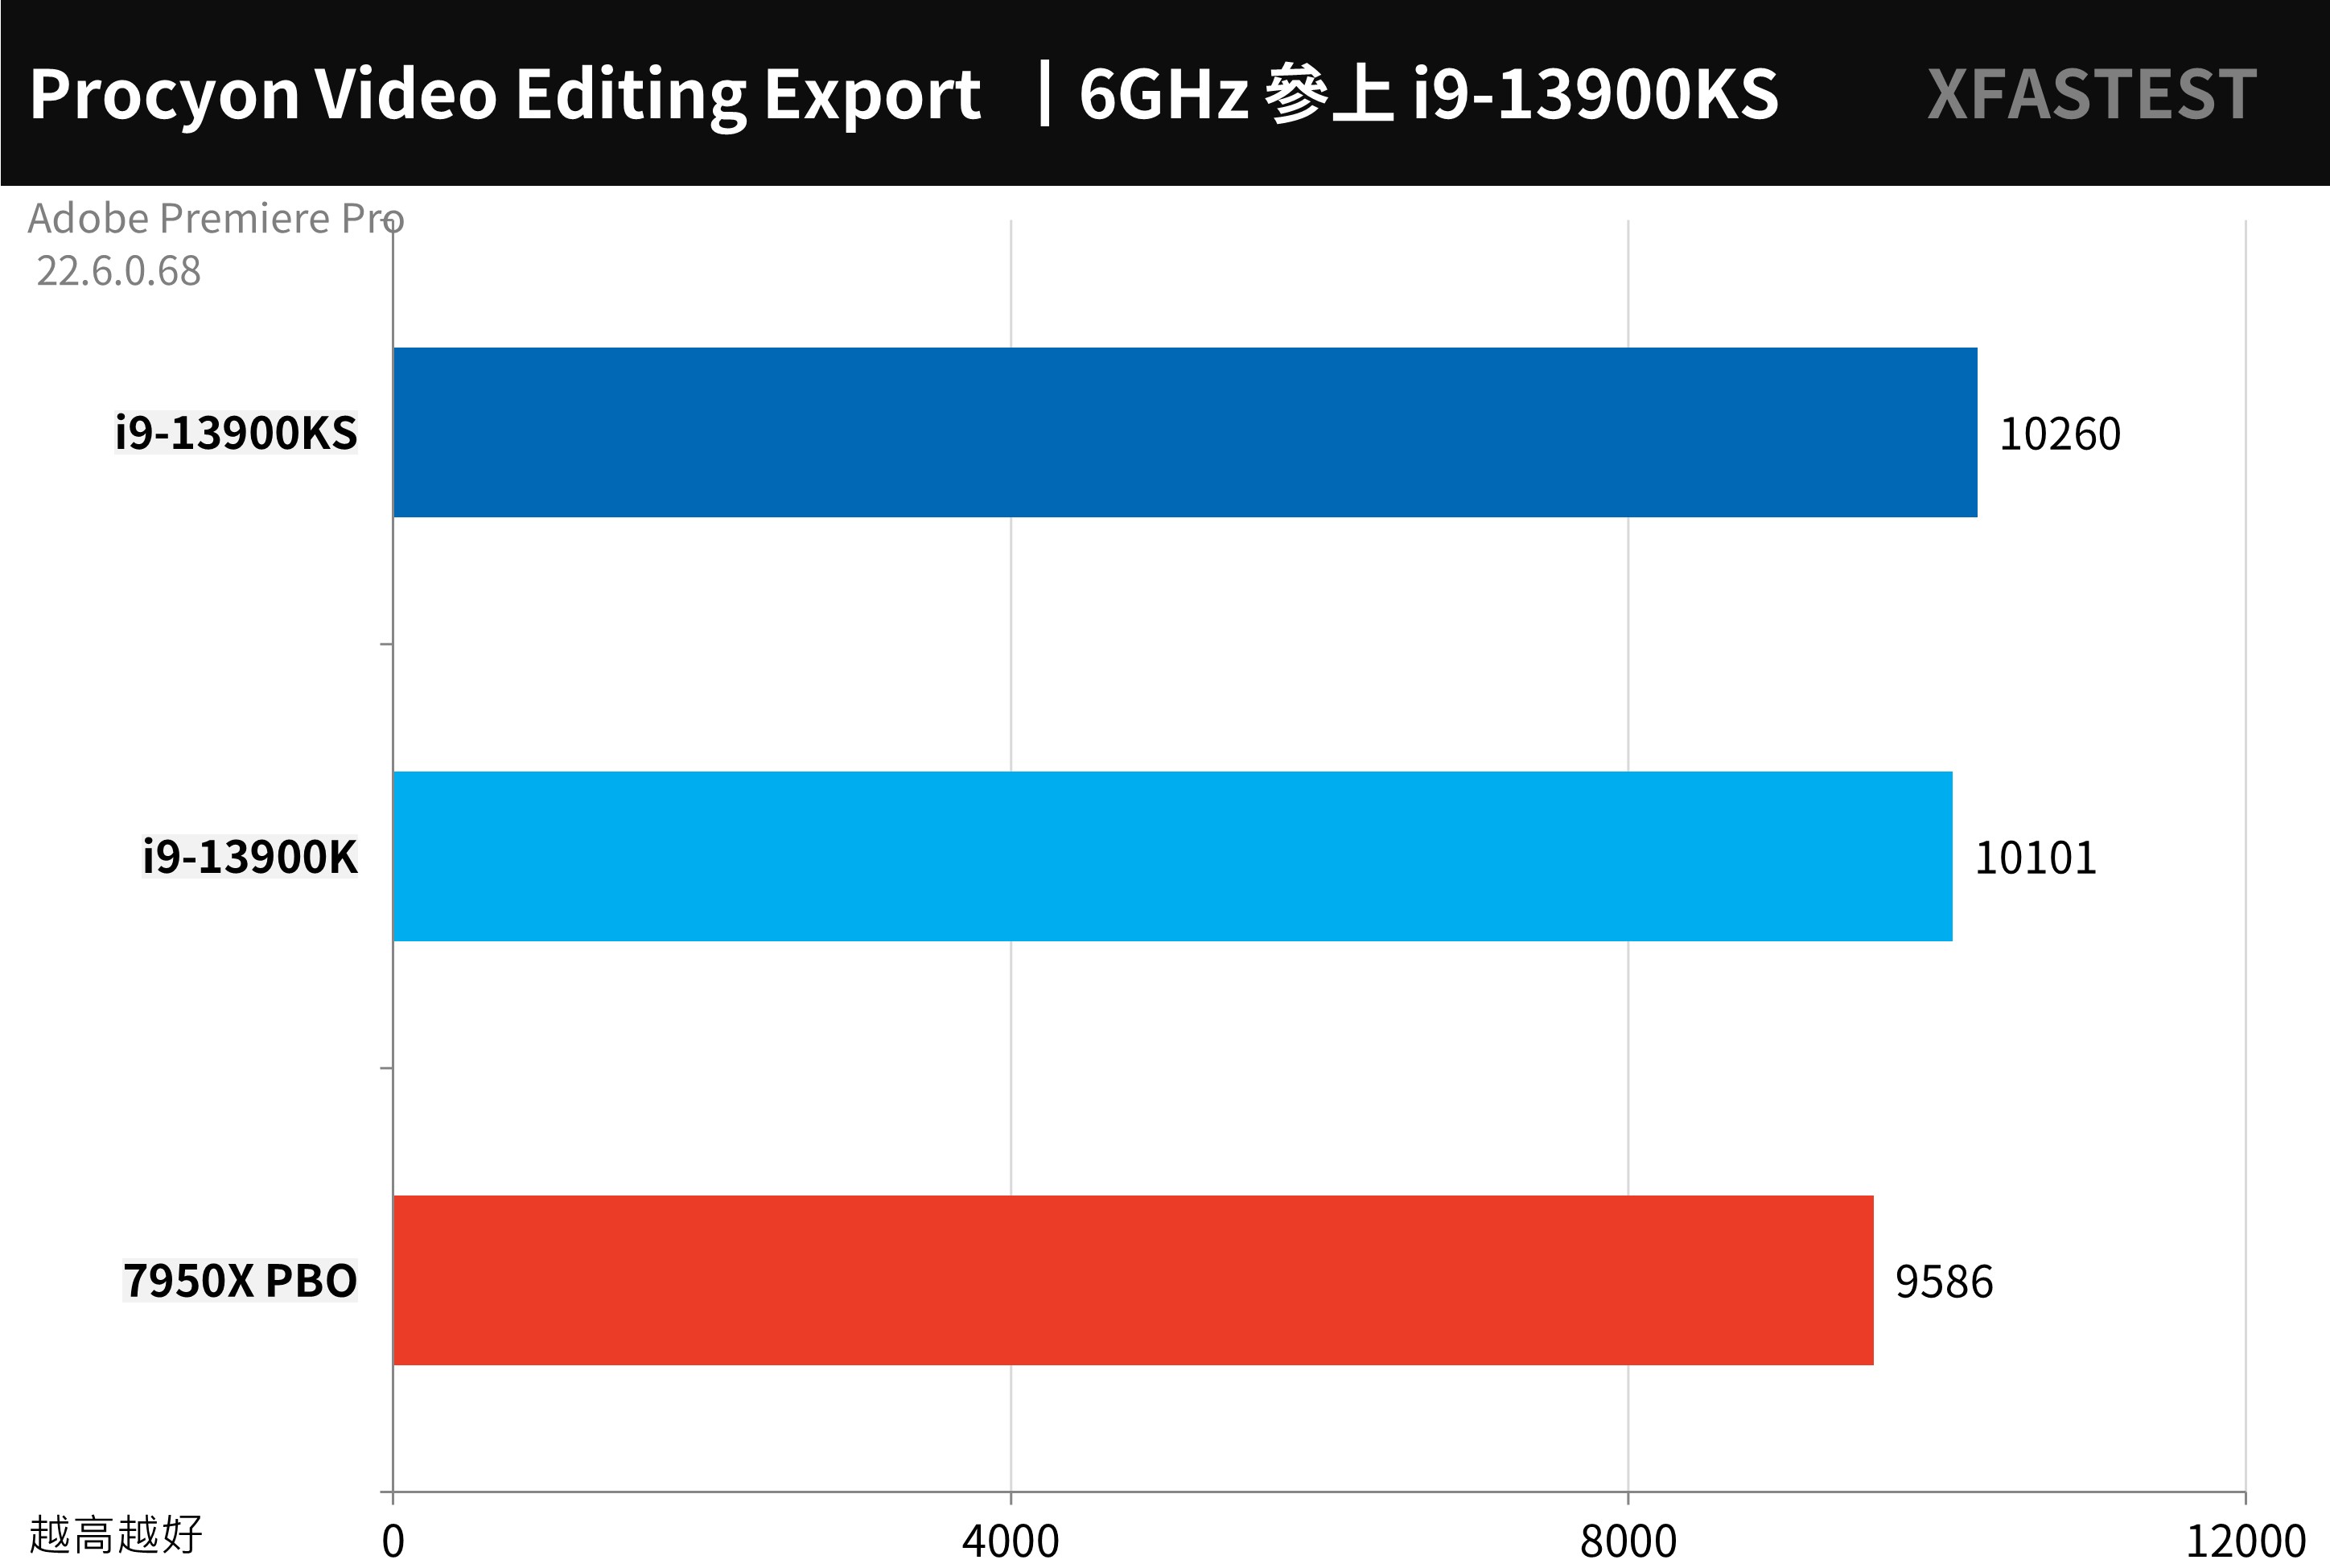
↑ UL Procyon Video Editing Benchmark, the higher the score, the better.
Adobe Photoshop and Lightroom Classic through UL Procyon Photo Editing Benchmark Test tool; the two working conditions of the test, Image Retouching test is to use Photoshop to retouch photos, and record the time of each step, while Batch Processing test is to use Lightroom to adjust and output a large number of photos in batches.
The i9-13900KS scored 11105 points and beat the 7950X PBO, but the 7950X PBO is stronger in photo editing, but the i9-13900KS has an advantage in batch processing.
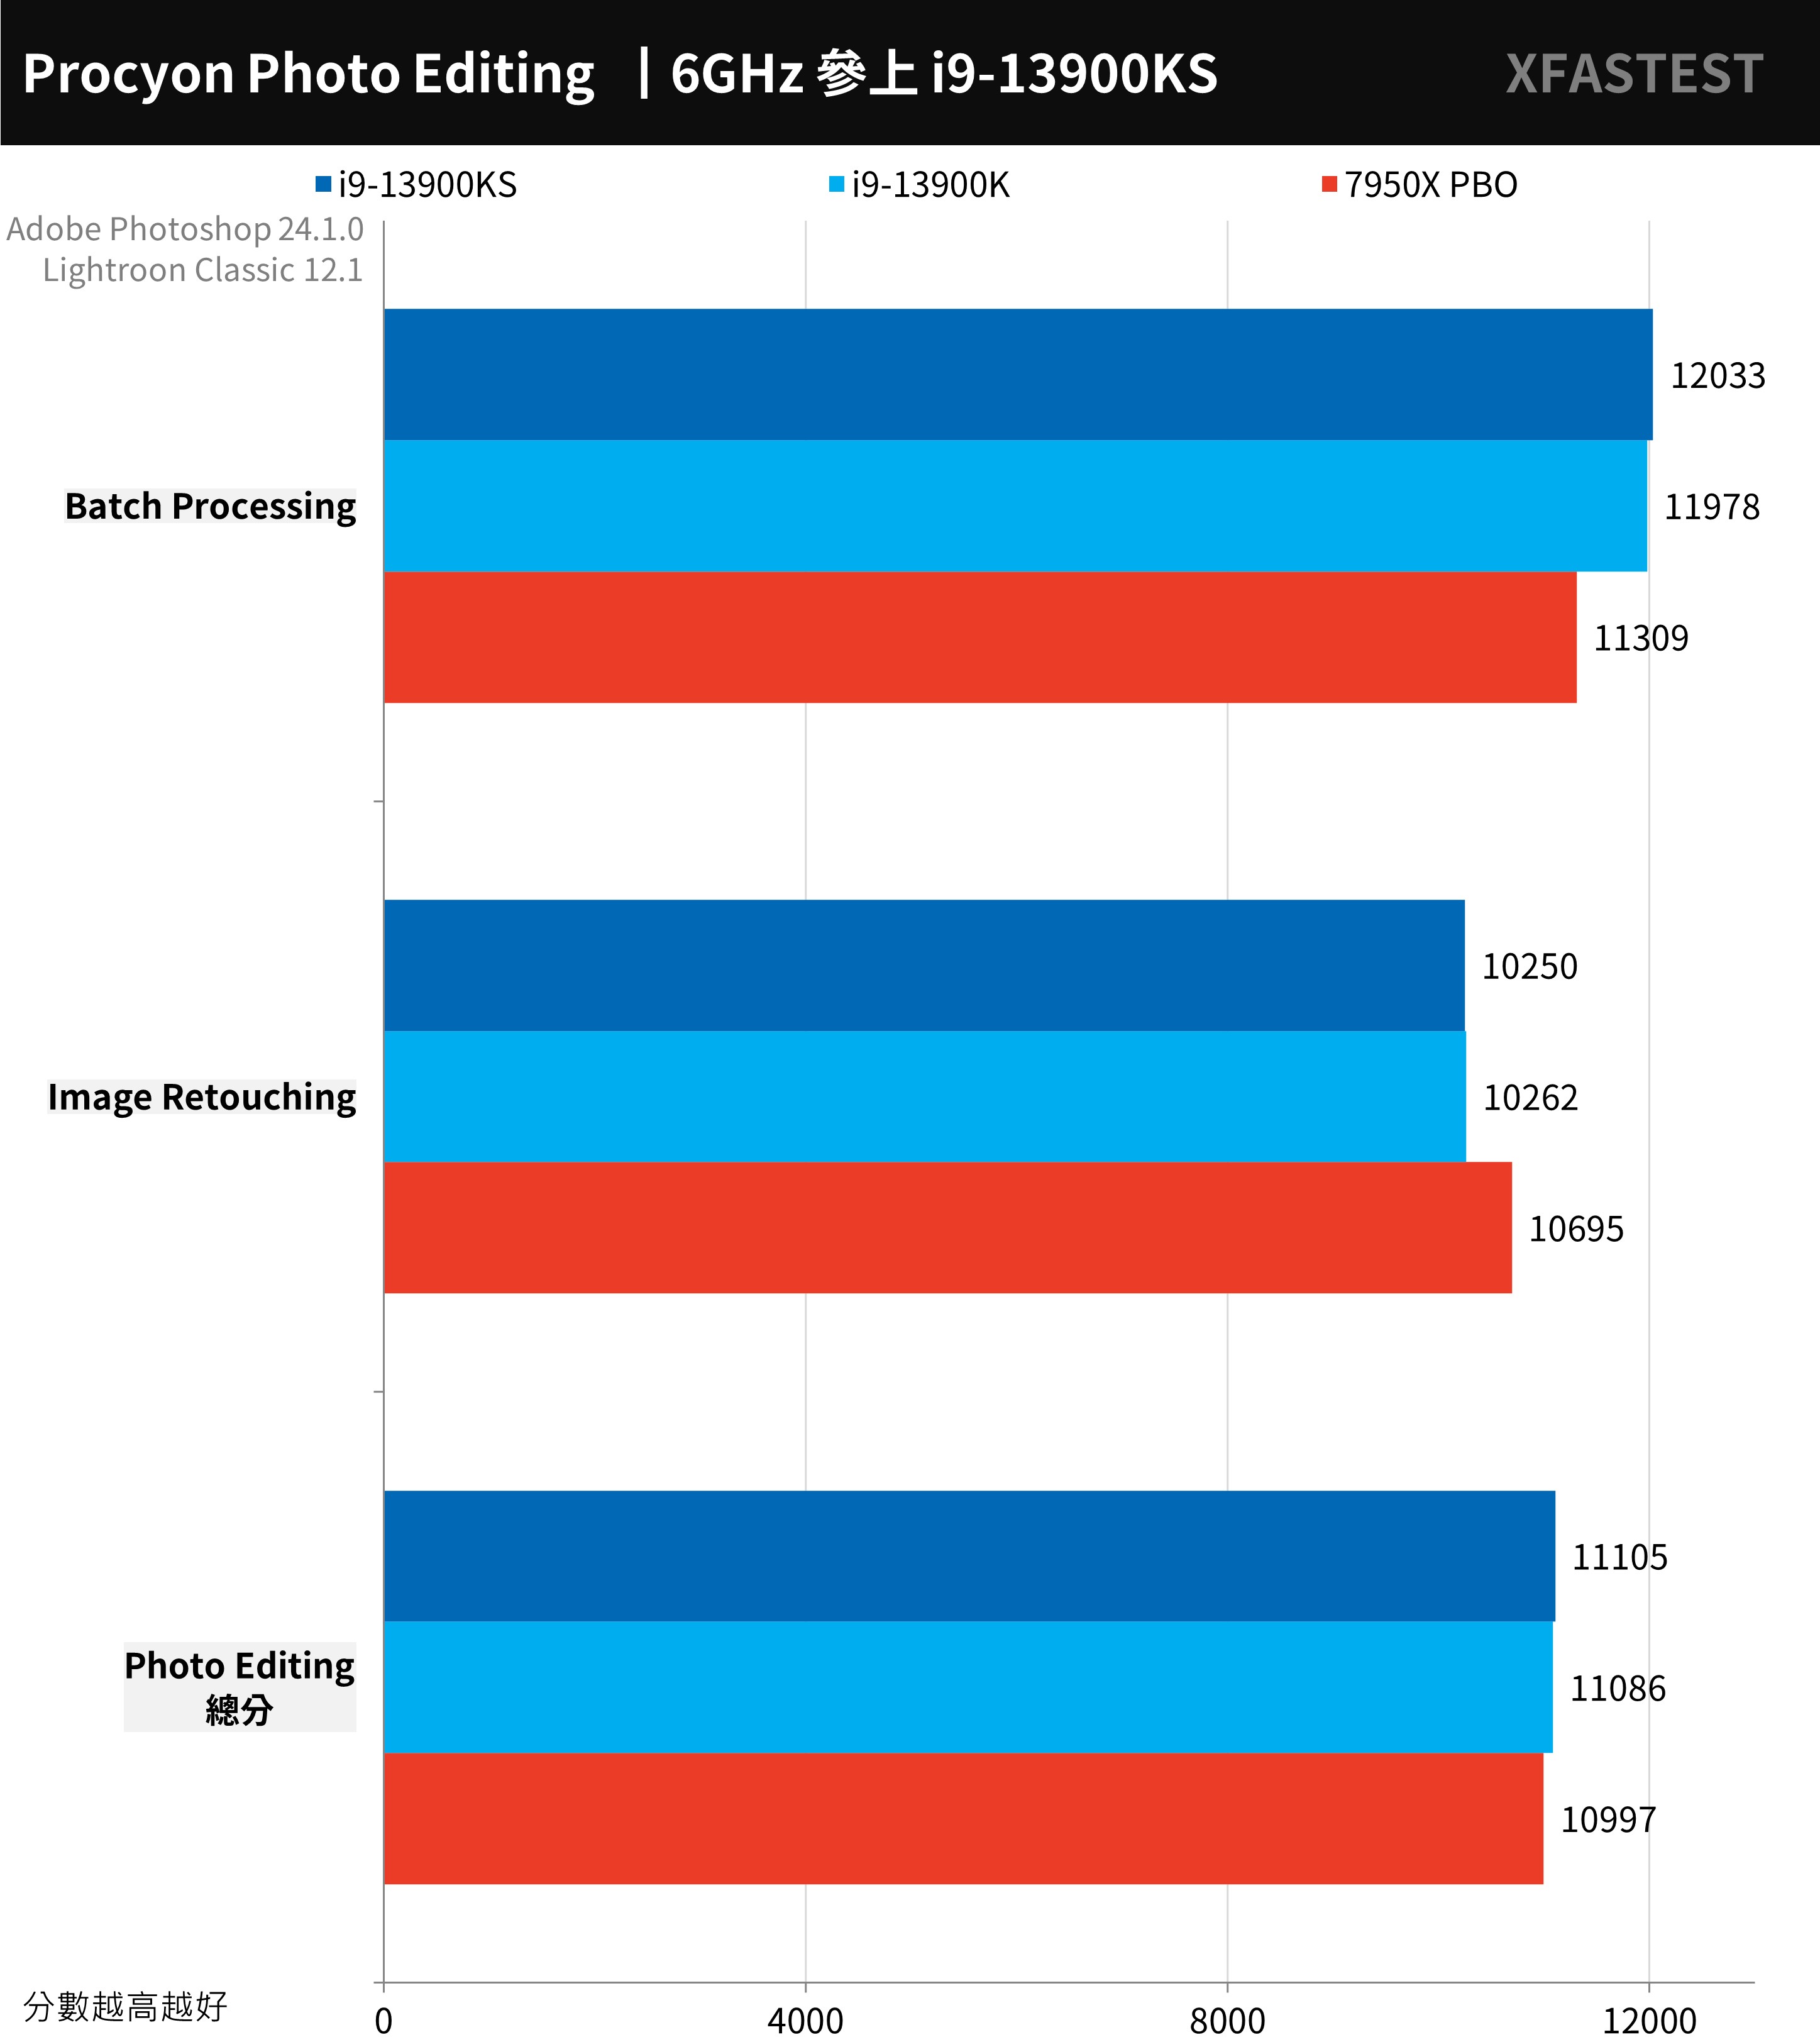
↑ UL Procyon Photo Editing Benchmark, the higher the score, the better.
AIDA64 processor memory, 7-Zip compression test
Memory tests use AIDA64 To carry out, use G.SKILL TRIDENT Z5 NEO DDR5-6000 16GBx2 memory. The i9-13900KS is equivalent to the i9-13900K, the memory reads 95837 MB/s, writes 84497 MB/s, and delays 66.5ns.
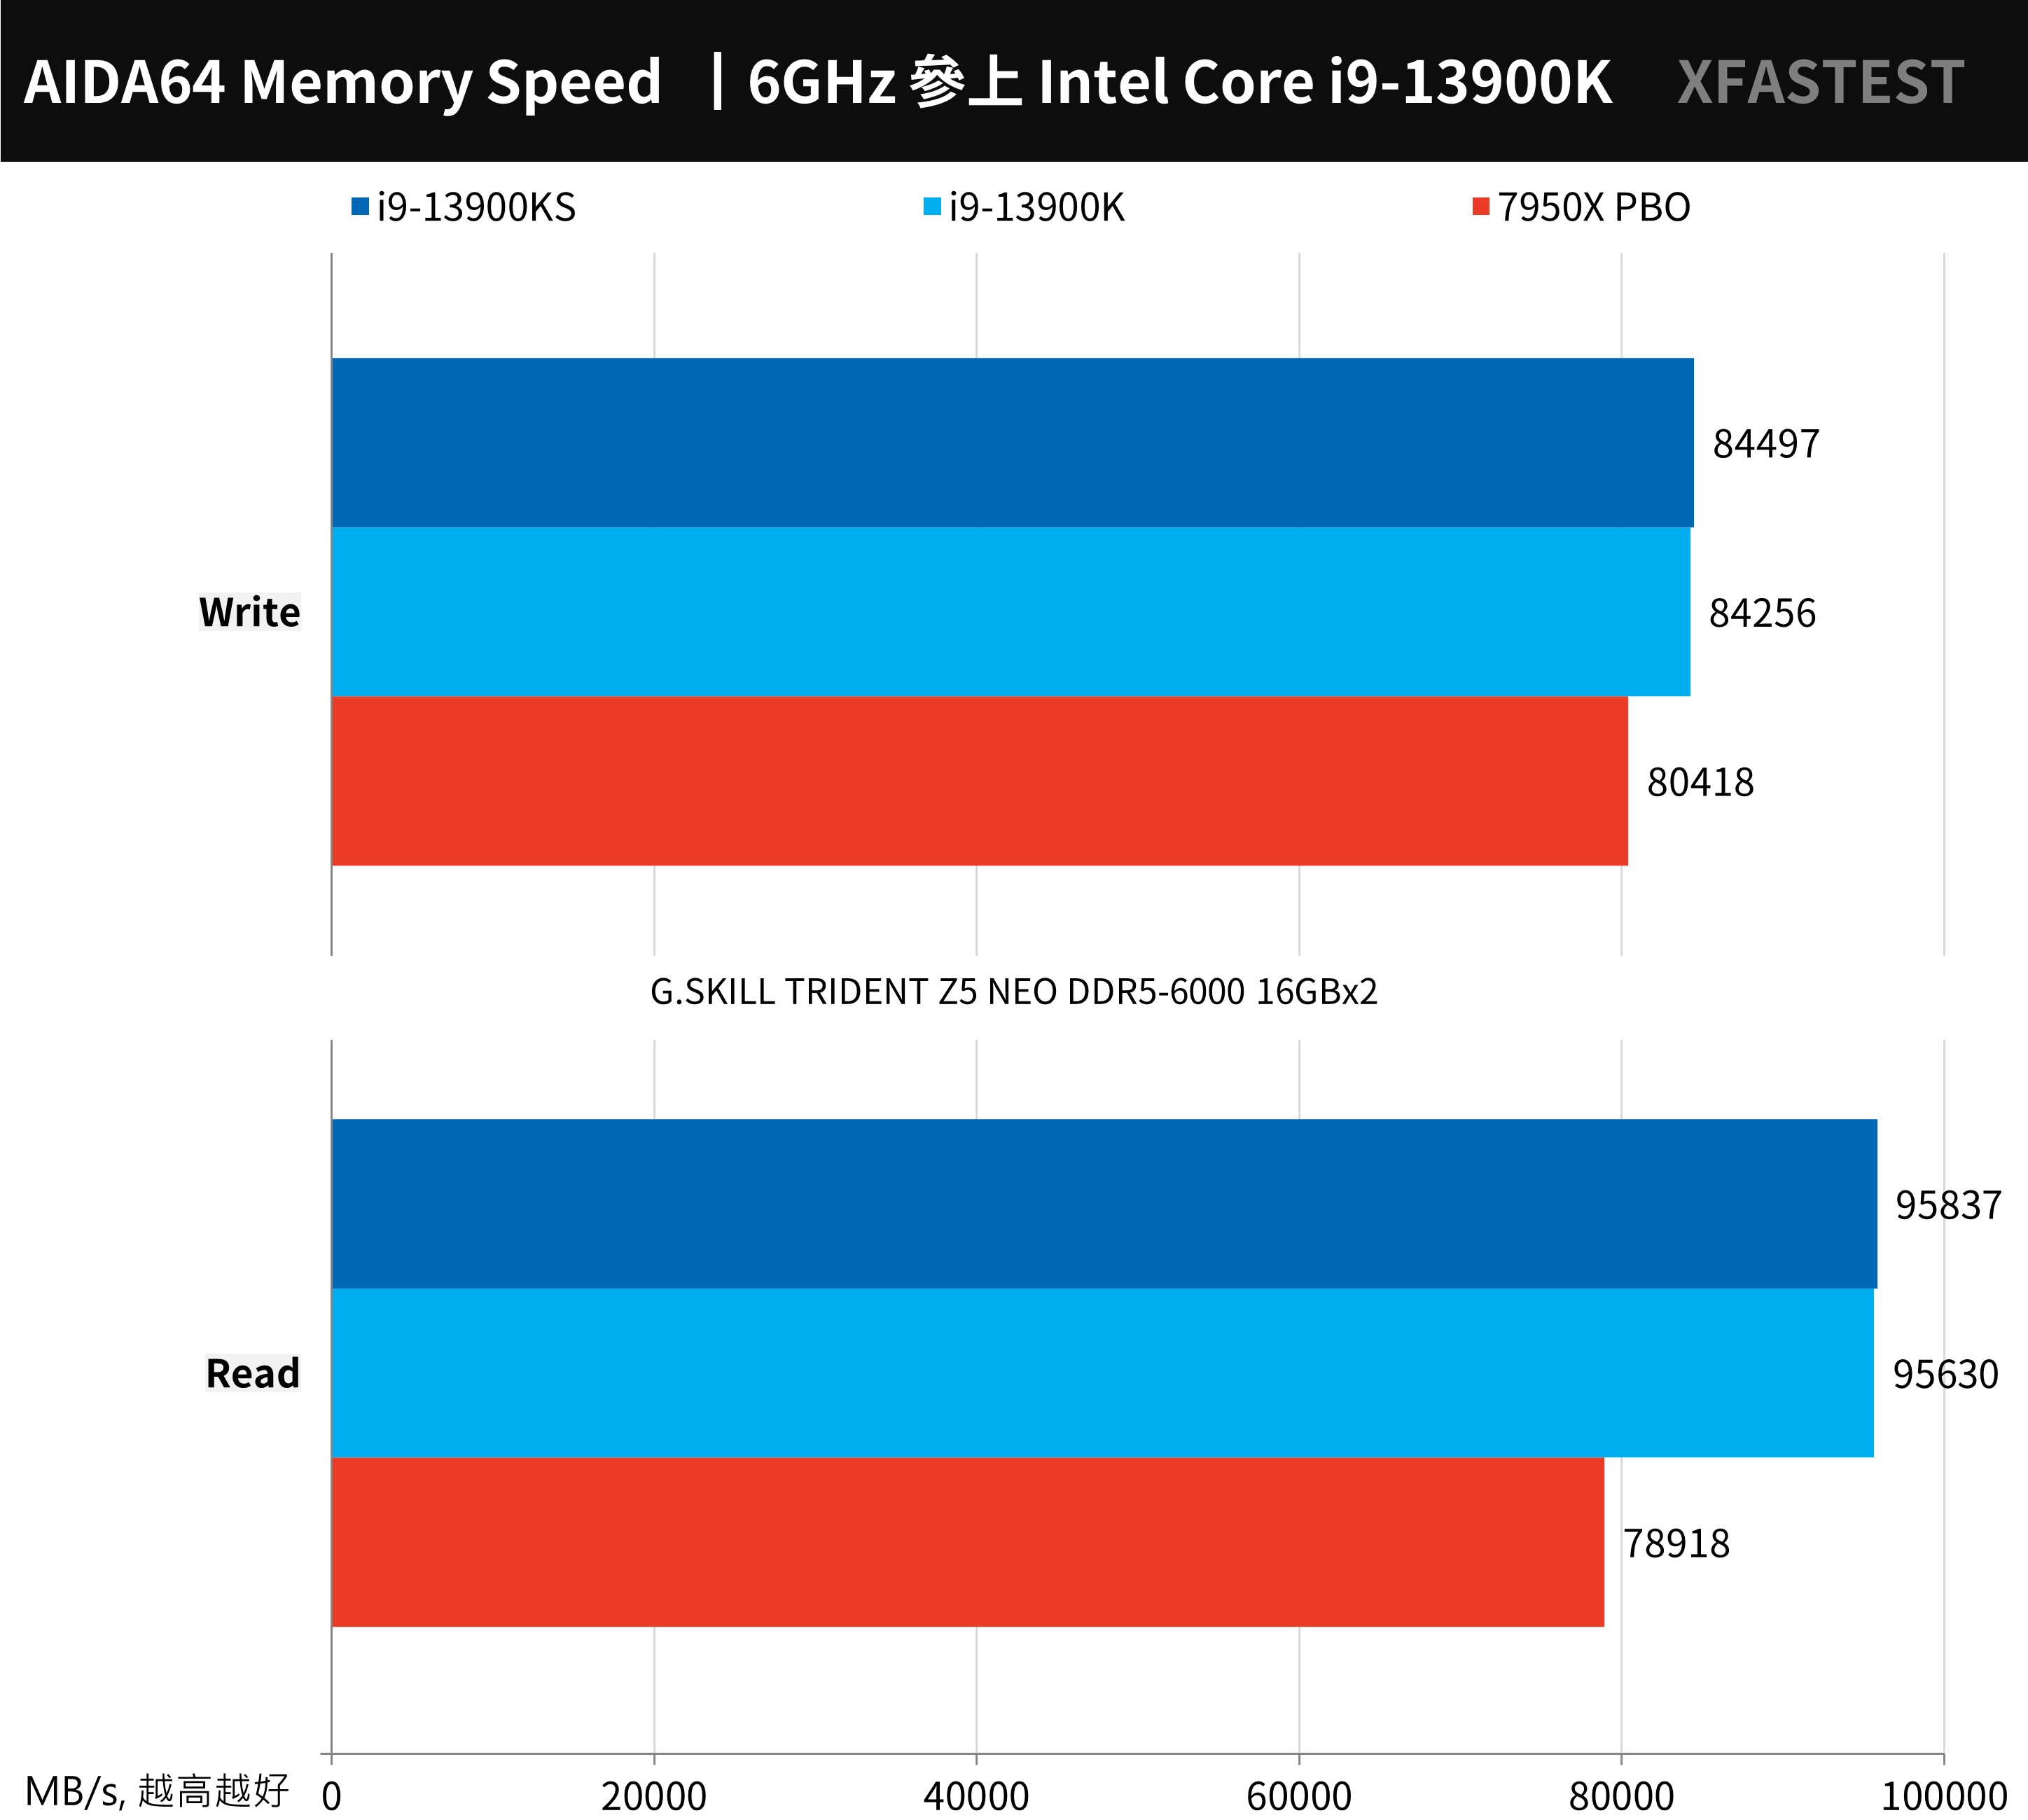
↑ AIDA64 memory test.
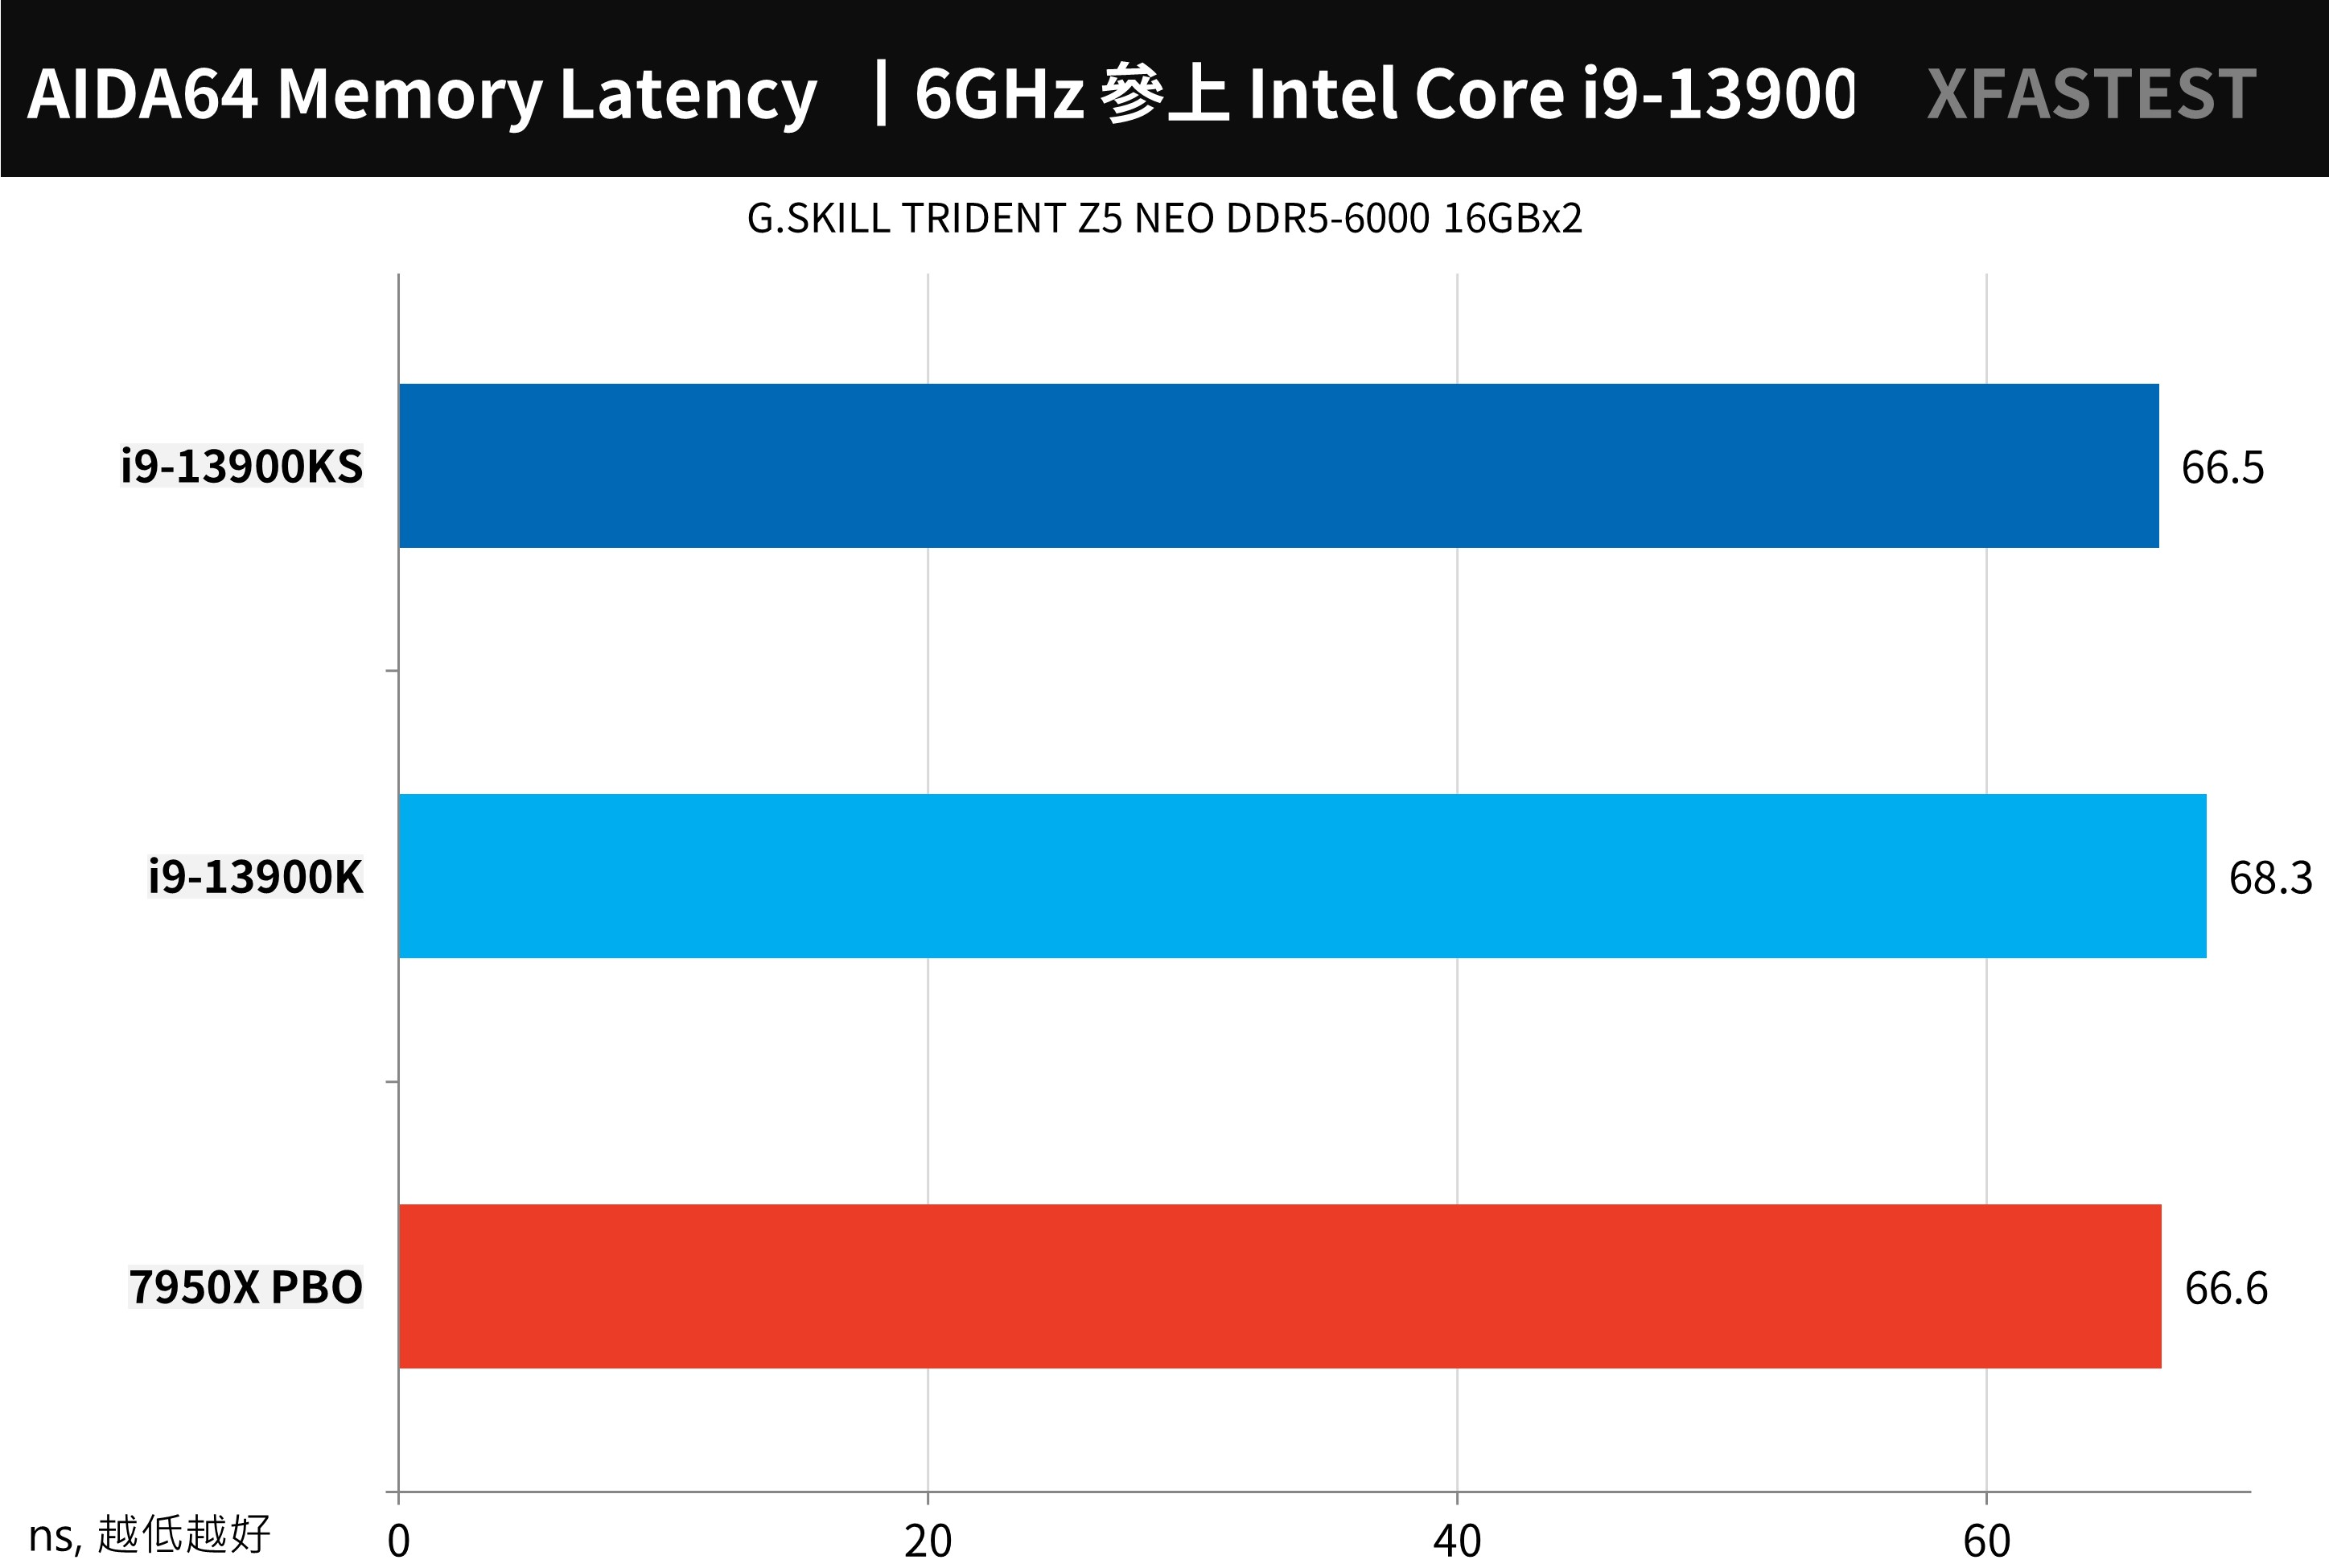
↑ AIDA64 memory test.
WinRAR The most commonly used compression tool, the performance of i9-13900KS reaches 57006 KB/s, but the performance of 7950X PBO dominates with 59233 KB/s.
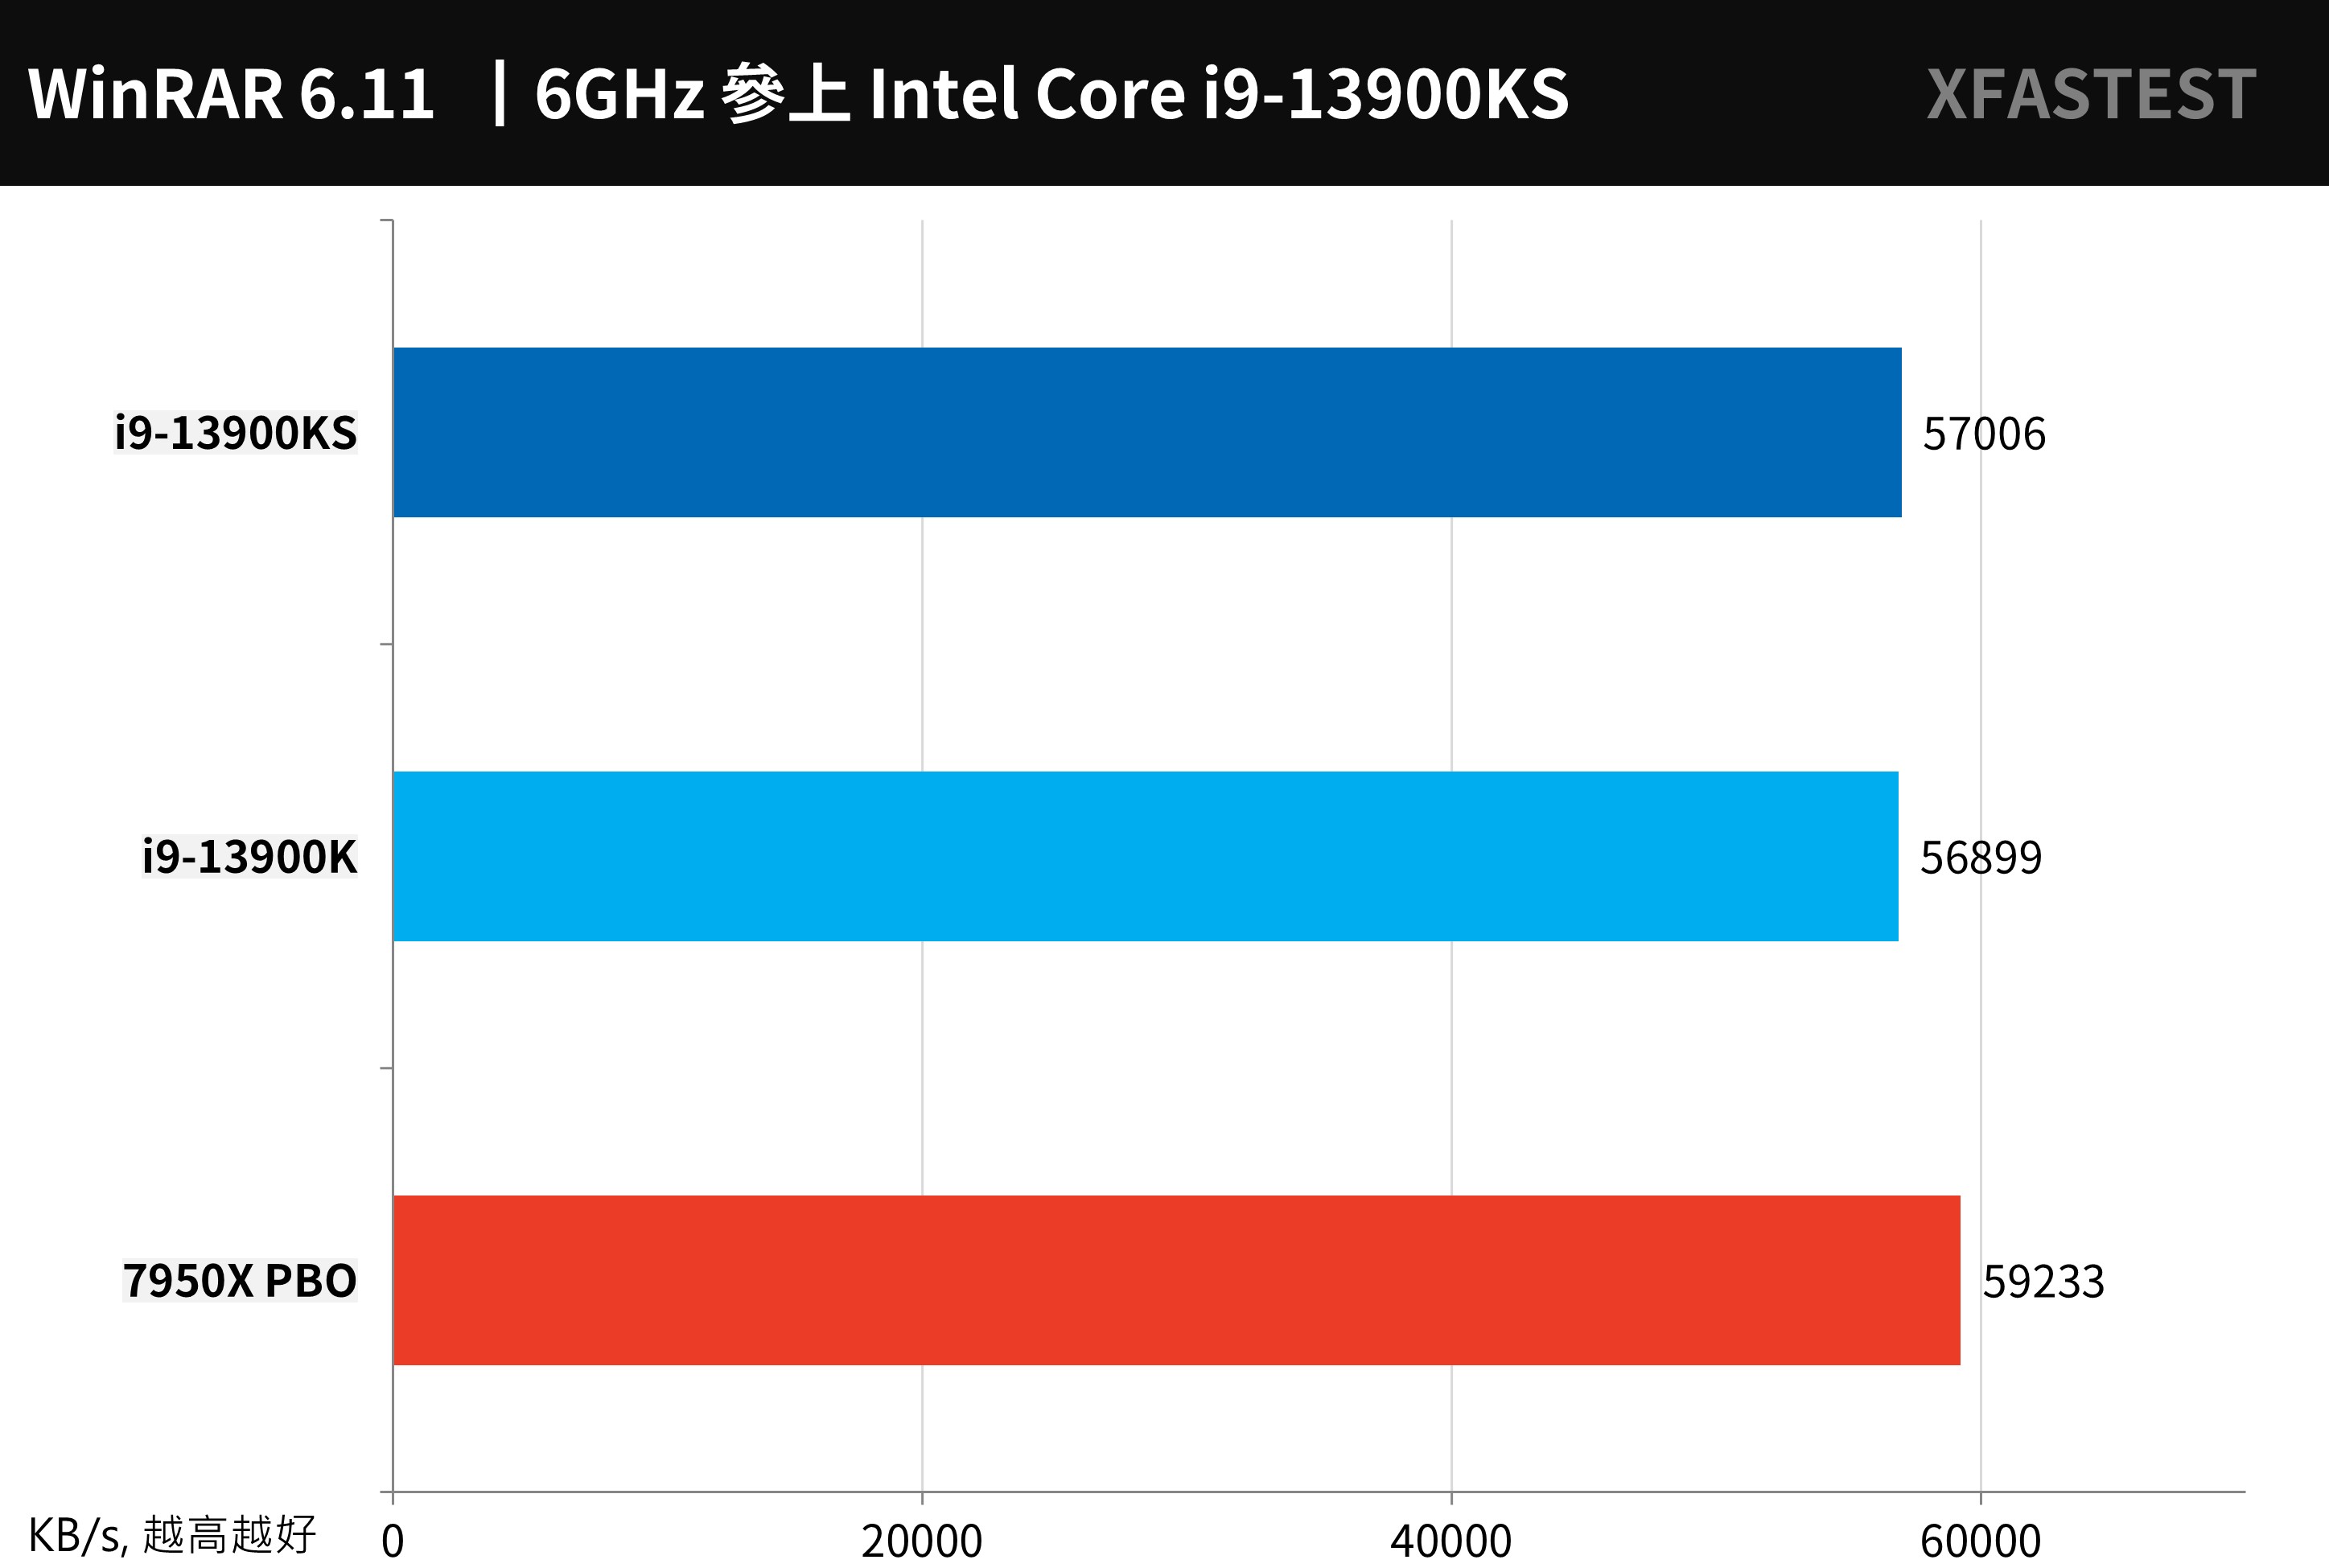
↑ WinRAR, the more performance the better.
7-Zip Another well-known and free compression tool can effectively use the performance of multi-core, i9-13900KS compresses 184.7 GIPS, decompresses 227.2 GIPS, and still loses to 7950X PBO compression 186.2 GIPS, decompresses 270.4 GIPS.
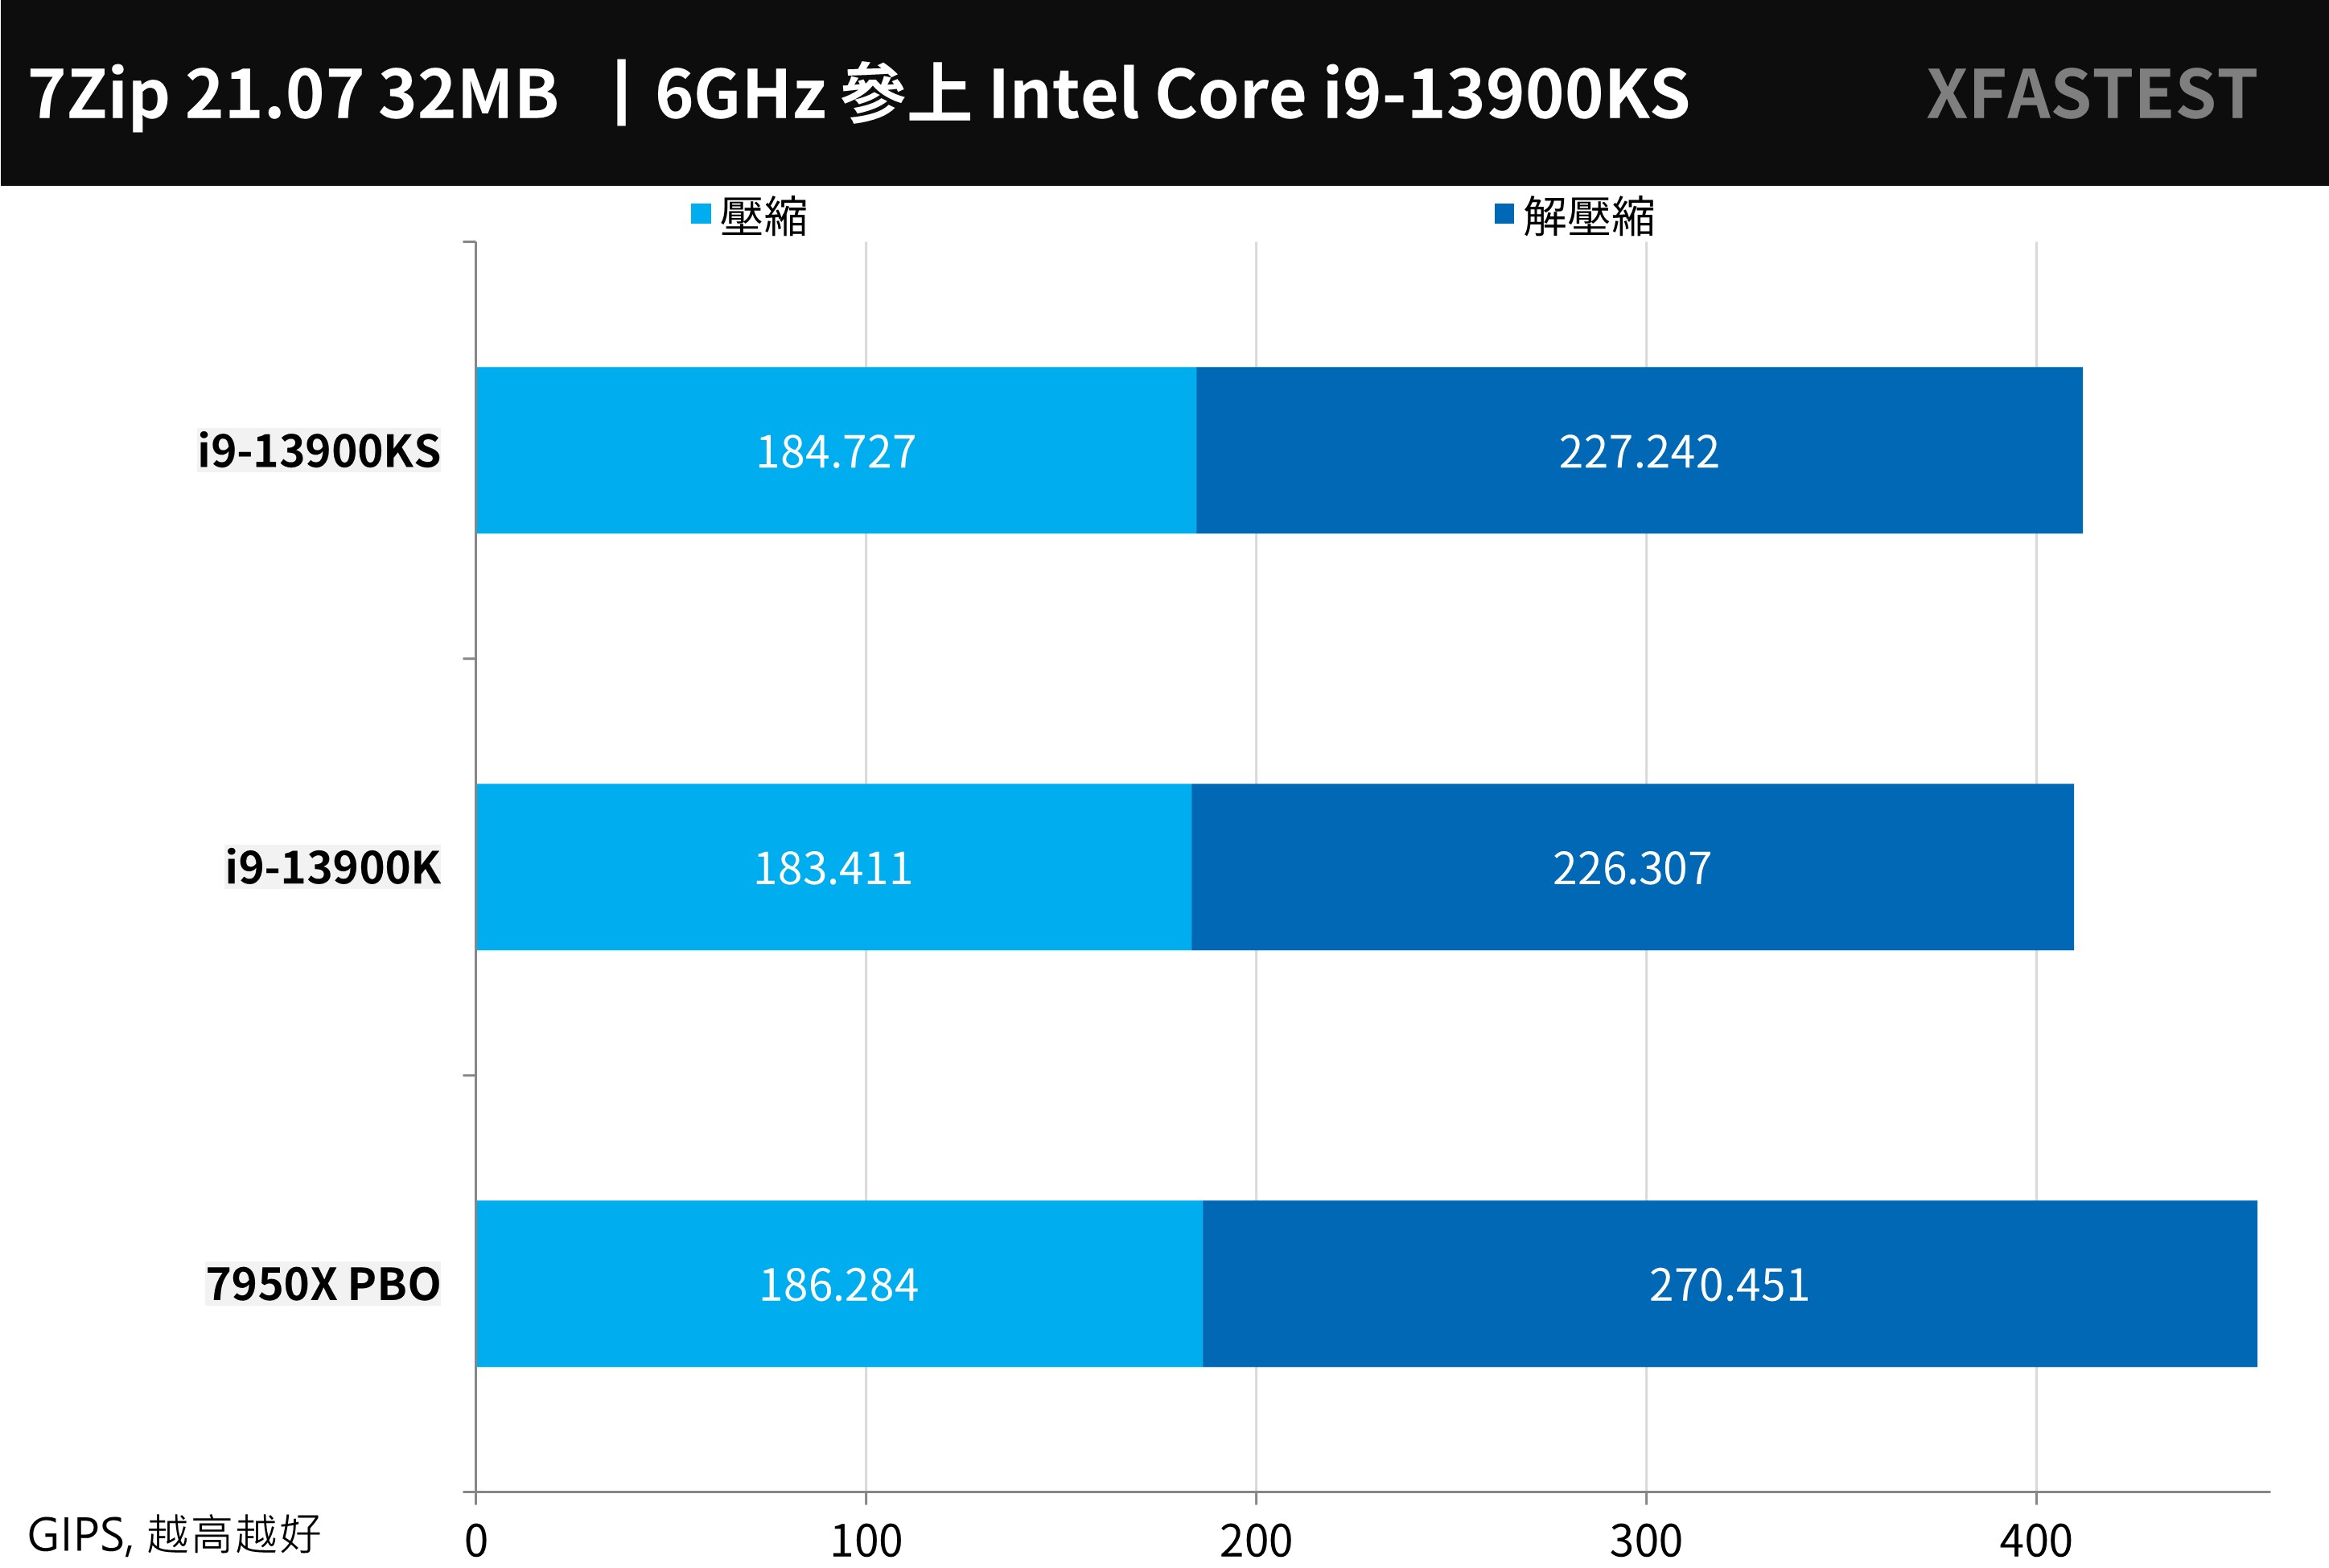
↑ 7-Zip, the more performance the better.
PCMark 10, CrossMark and Office PC Benchmarks
The overall performance of the computer is first PCMark 10 For the test, you can score the basic computer work of Essentials, such as App startup speed, video conferencing, and web browsing performance. The Productivity productivity test uses spreadsheets and paperwork as test items. Digital Content Creation video content creation, then Tested on photo/video editing, rendering and visualization.
The i9-13900KS achieved a score of 10637, but the three flagship processors are equally effective for general paperwork, Internet access, and digital content creation.
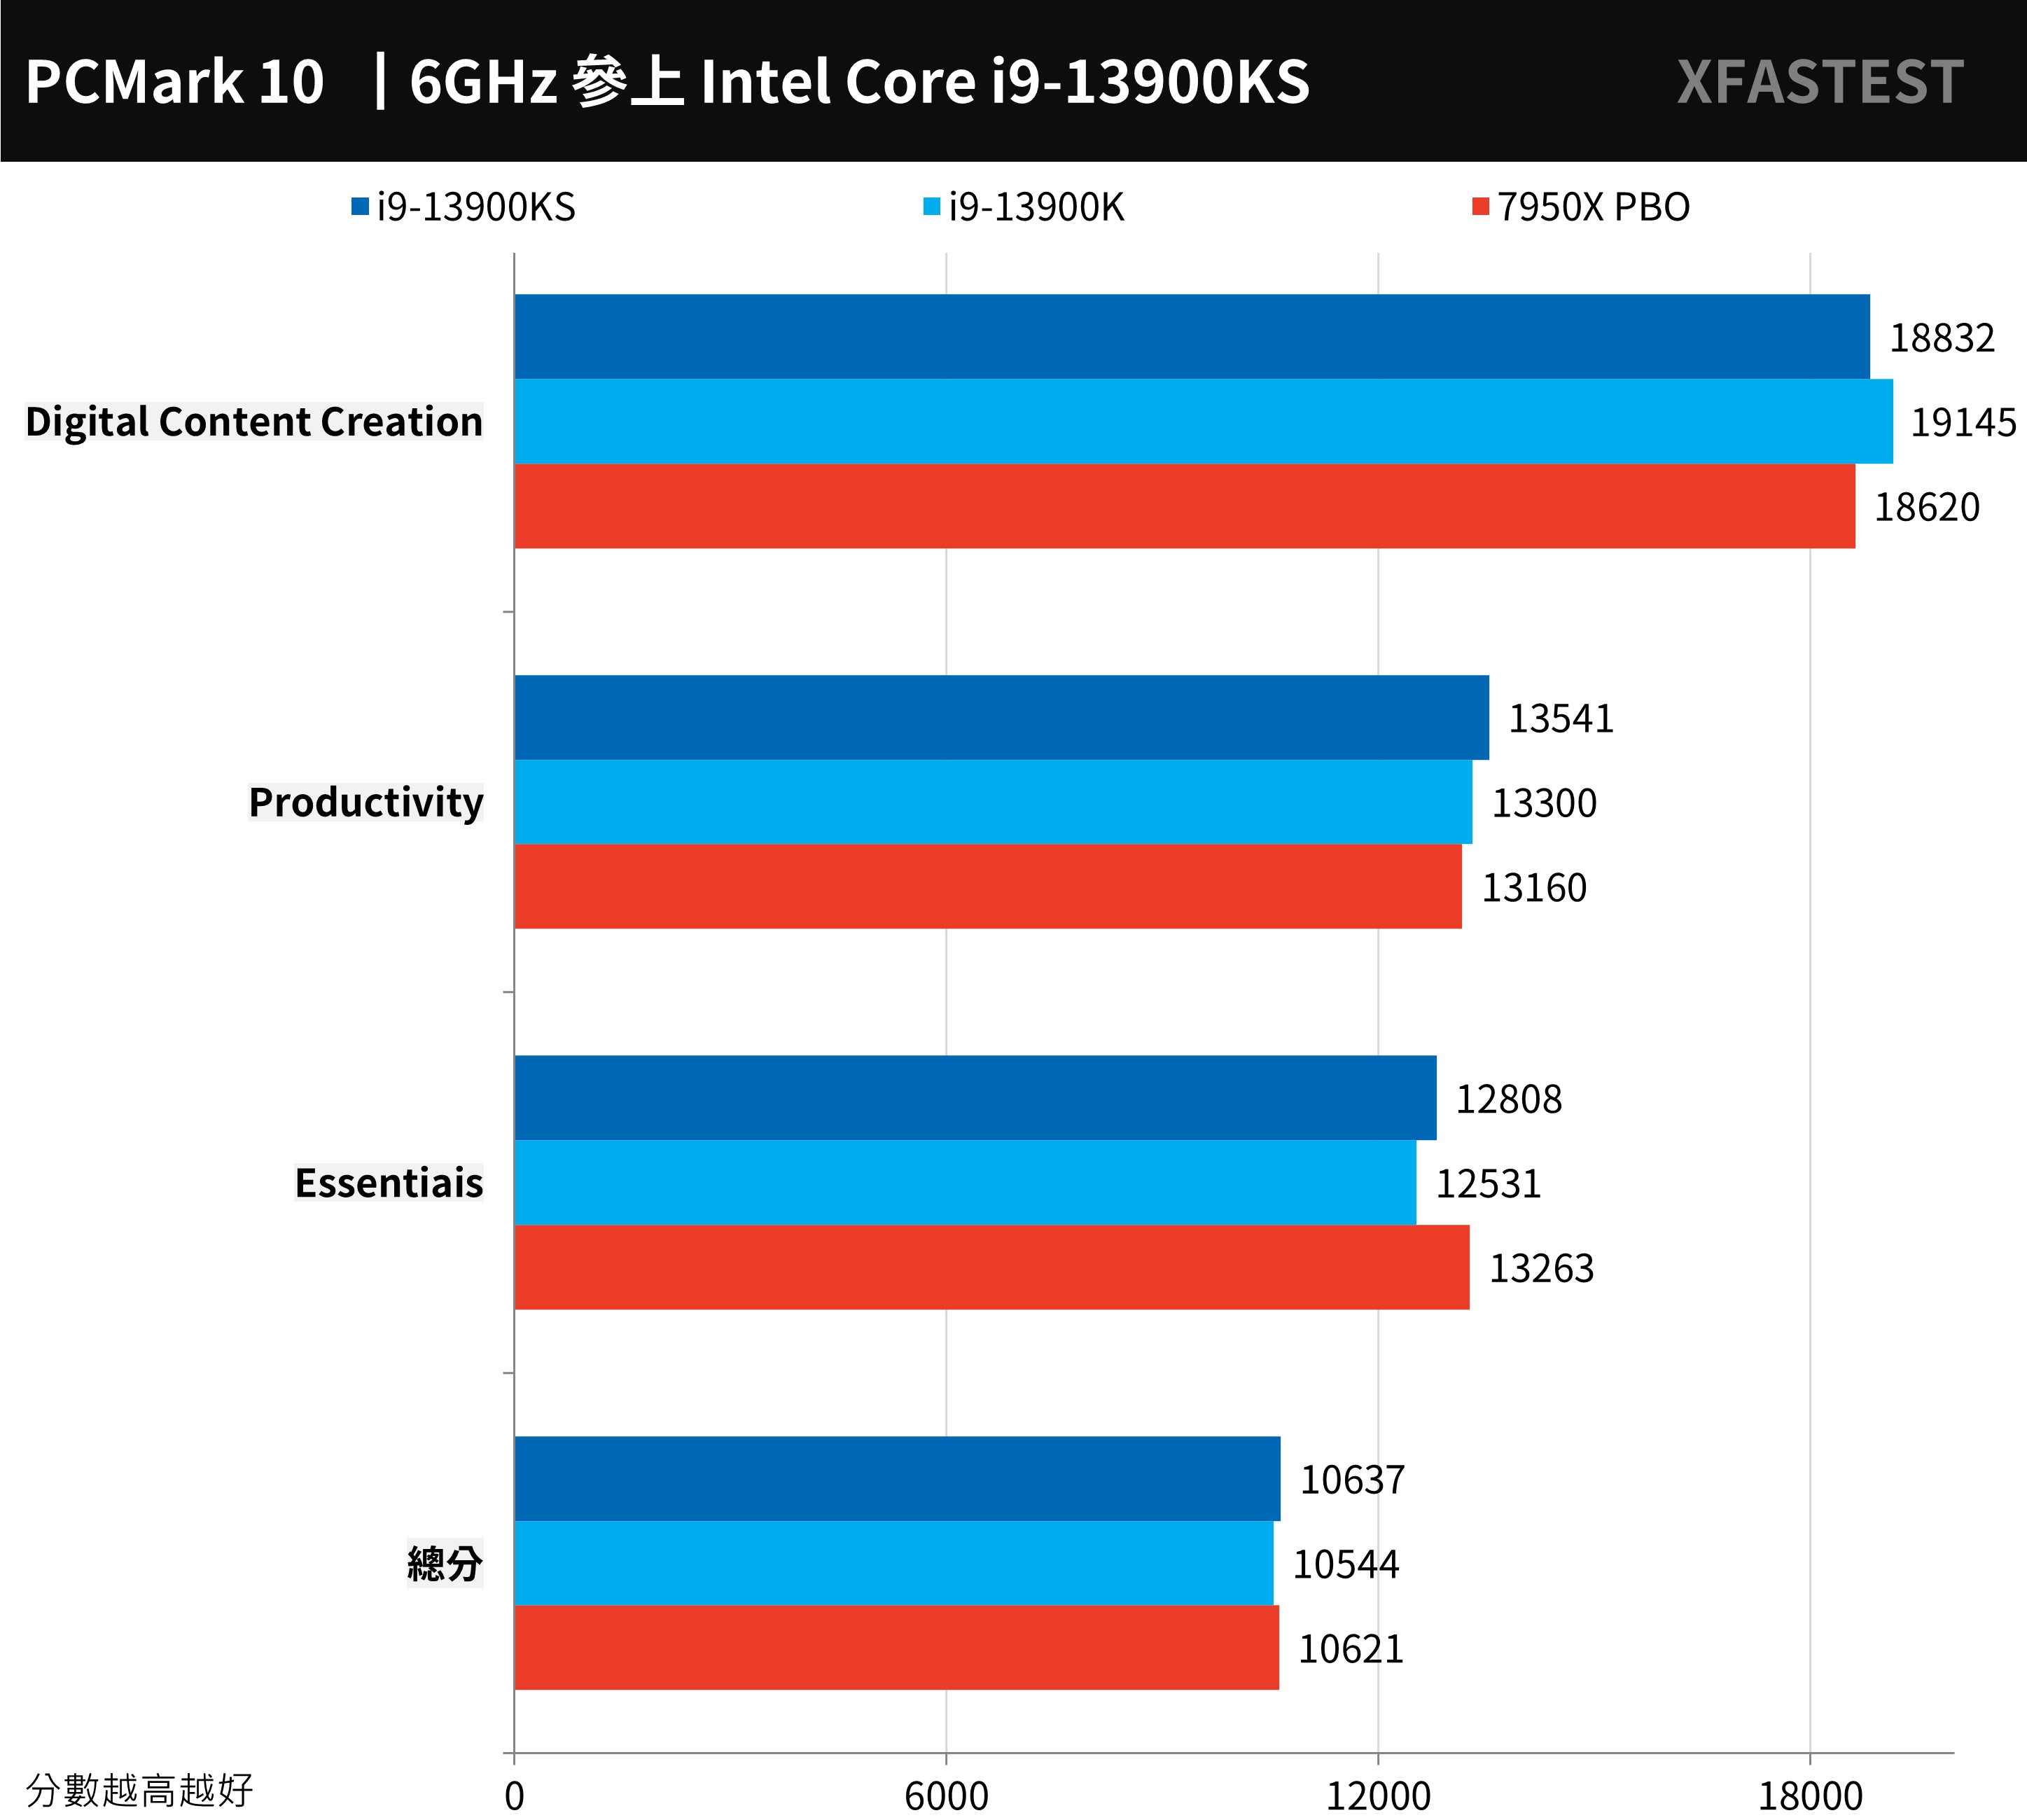
↑ PCMark 10, higher scores are better.
Cross-platform computer performance testing tool CrossMarkis a free test tool developed by BAPCo that supports platforms such as Windows, iOS/iPadOS, macOS, and Android, and is aimed at computer productivity, such as text editing, spreadsheets, web browsing, and creative photo editing, organizing, and Video editing and other work, plus computer response speed for testing.
The i9-13900KS achieved a score of 2595 points, but this project can reflect the advantages of Intel processors in response speed, latency and high clock speed.
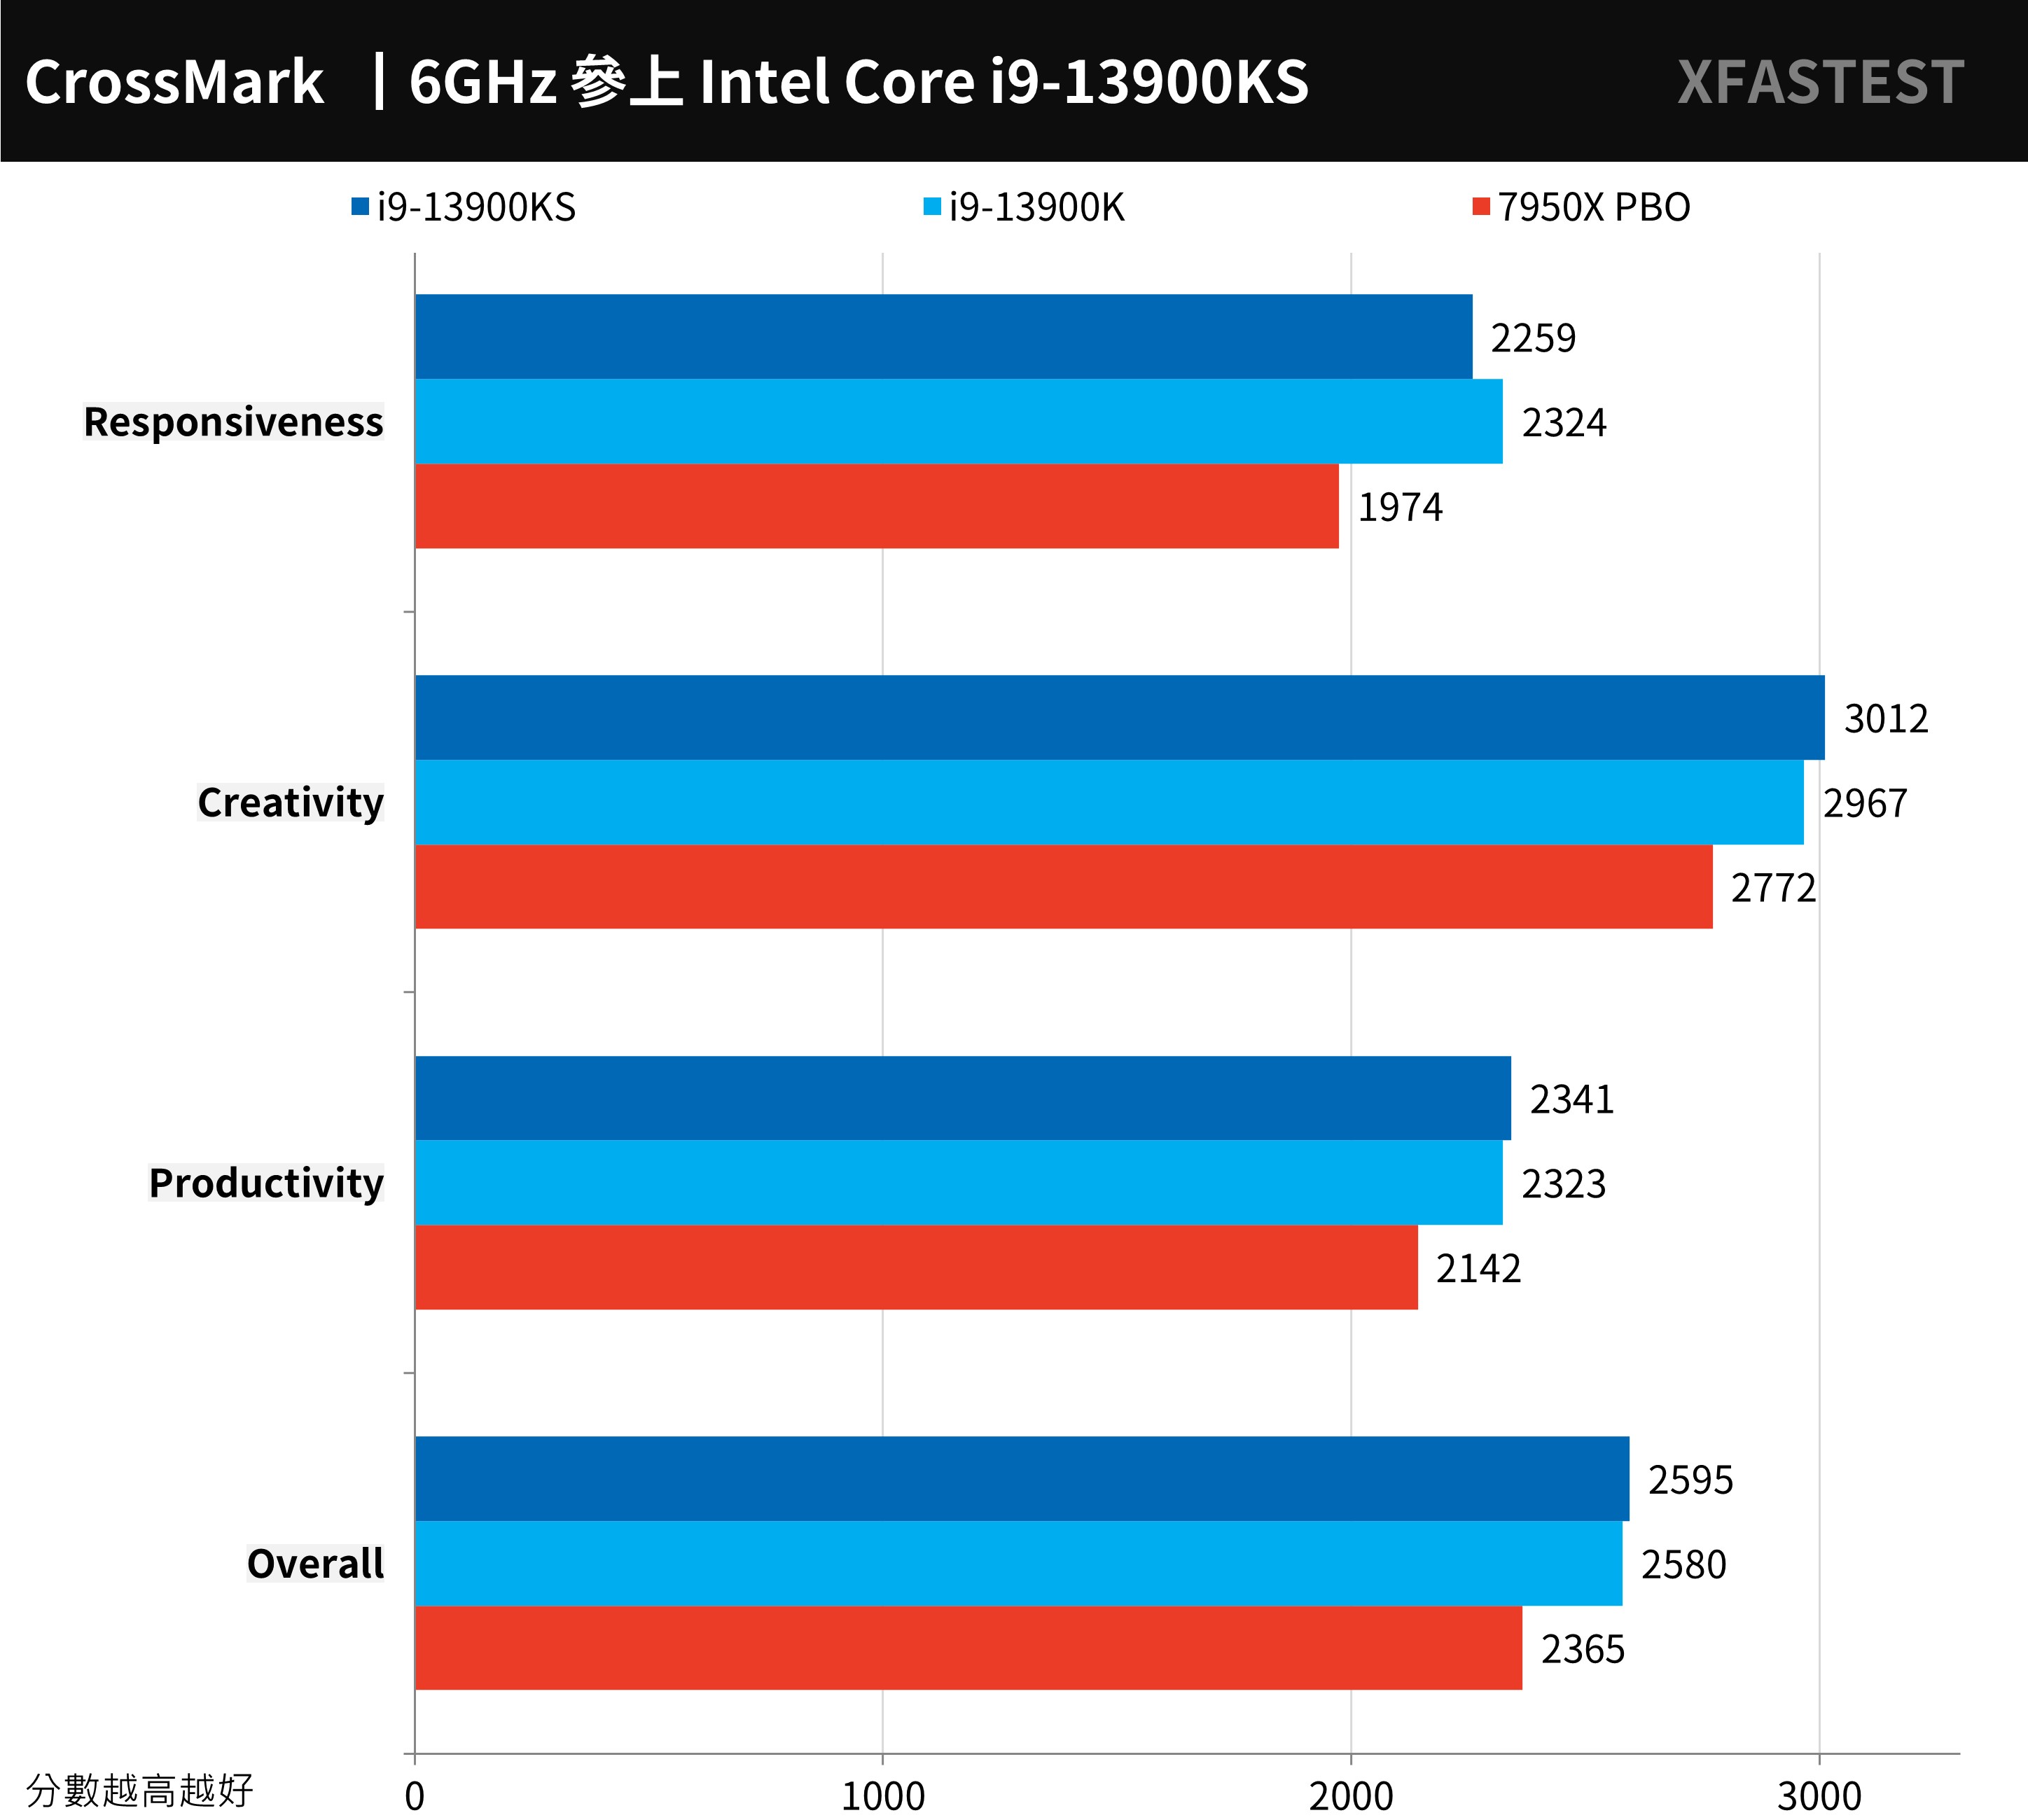
↑ CrossMark, the higher the score, the better.
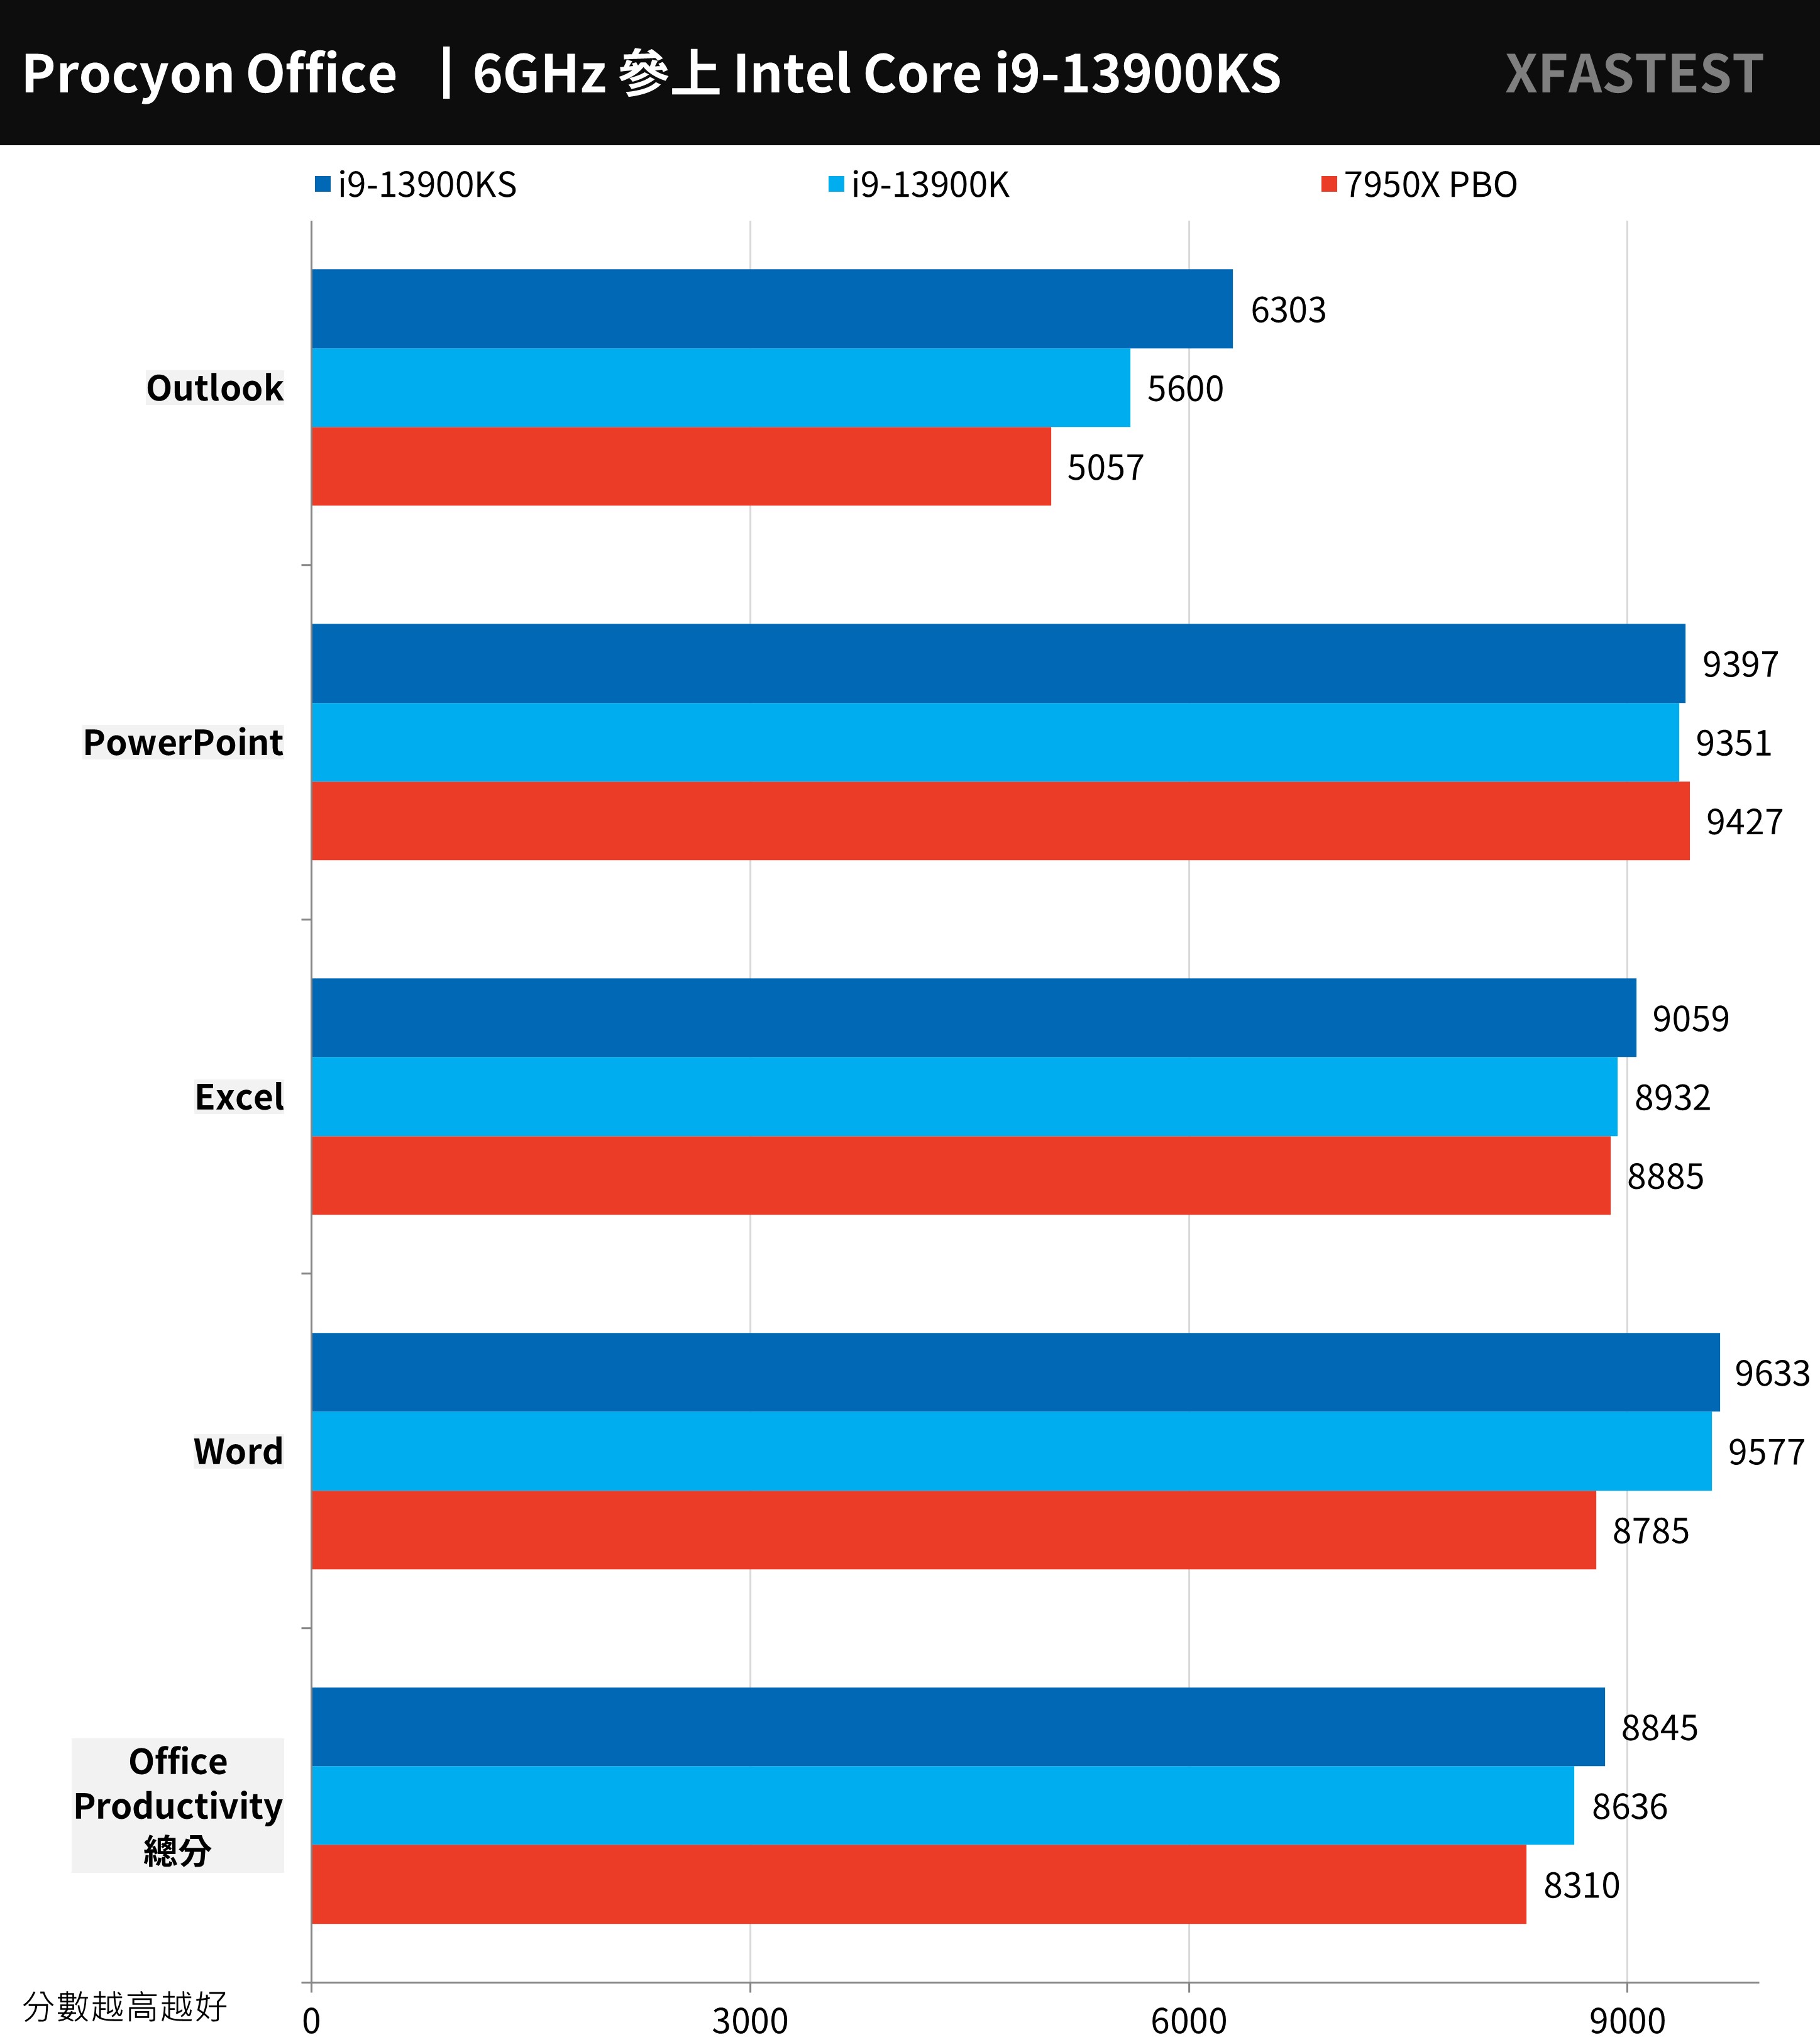
UL Procyon The office productivity benchmark test uses Microsoft Word, Excel, PowerPoint and Outlook to test the practical and real performance of Windows computers in daily work, and uses common paperwork to design test situations, from document opening, copying, input, and spreadsheet Calculation, sorting, exporting, adding files, image files, videos, and sending and receiving emails to presentations.
The i9-13900KS achieved a score of 8845 points. Although it has won the i9-13900K and 7950X PBO, the performance of the three is enough to meet the needs of paperwork.
↑ UL Procyon, the higher the score the better.
3DMark CPU Performance and Fire Strike, Time Spy Benchmark Test
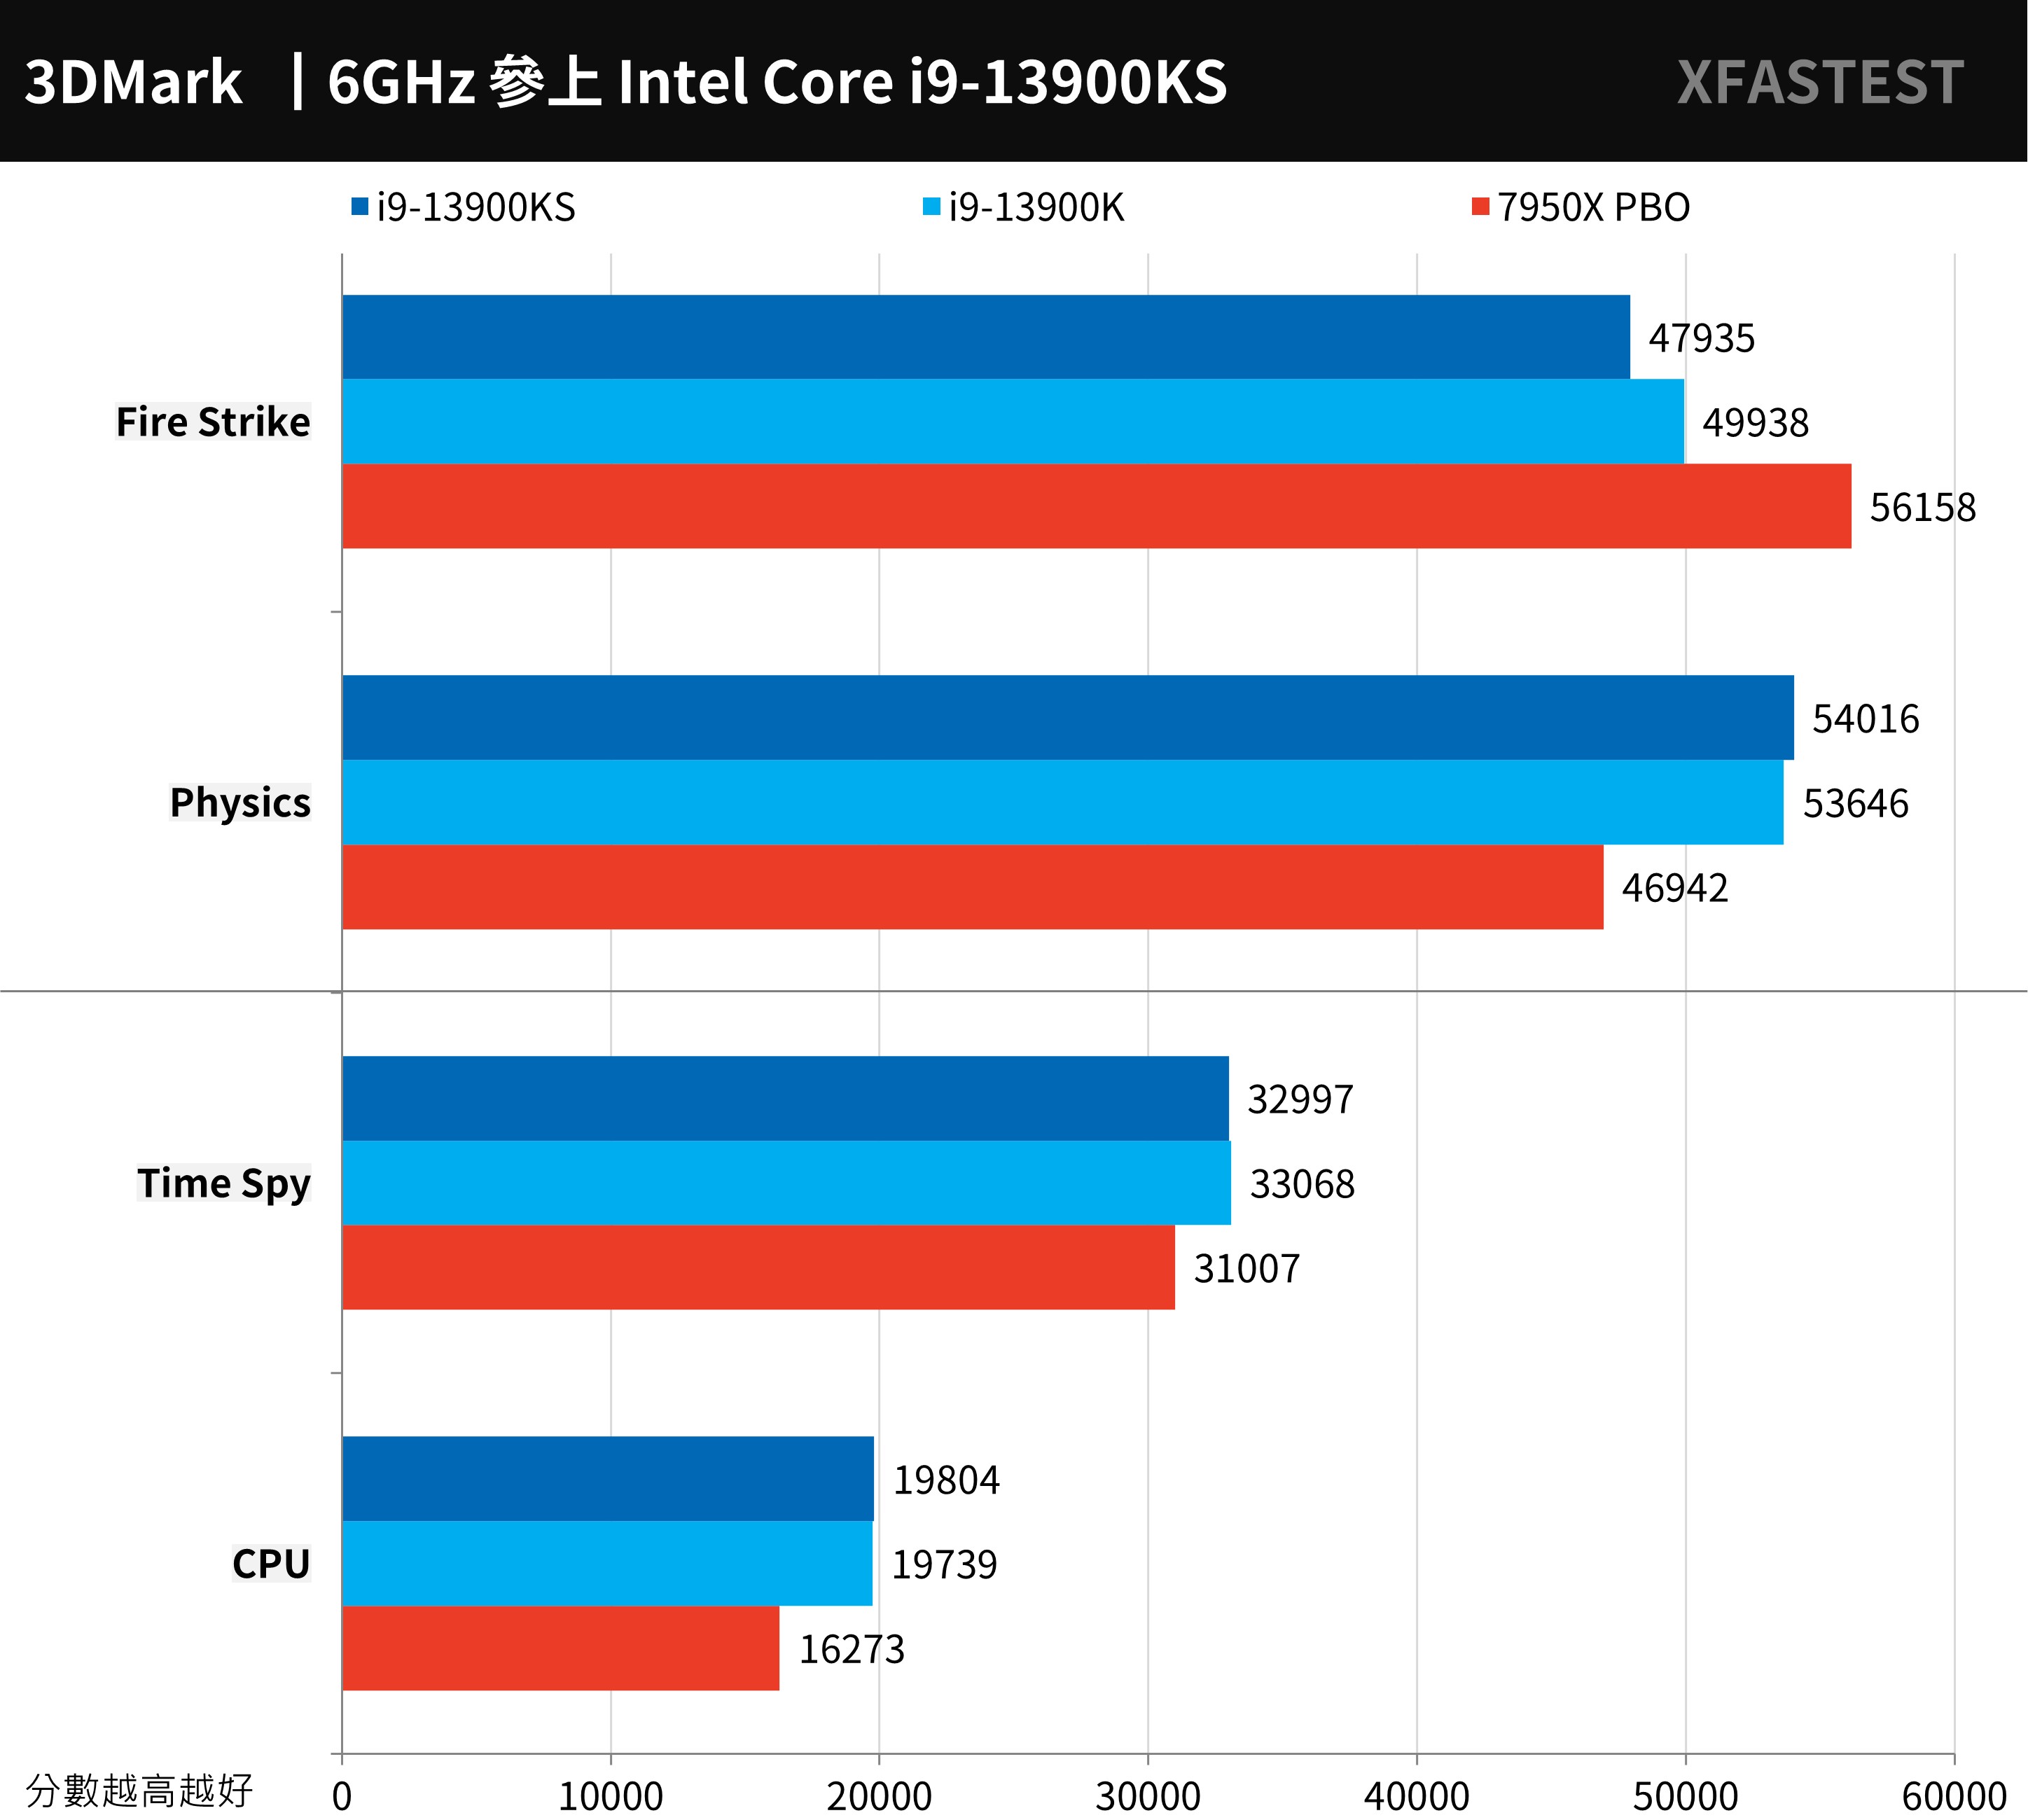
Computer graphics game performance testing tool 3DMarkthe mainstream Direct X11 test Fire Strike and Direct X12 Time Spy test.
The Fire Strike score is 7950X PBO is higher, but in the Fire Strike Physics physical score is i9-13900KS has a high score of 54016 points.
As for the total score and CPU score of Time Spy, the i9-13900KS is higher and equal to the i9-13900K.
↑ 3DMark, the higher the score, the better.
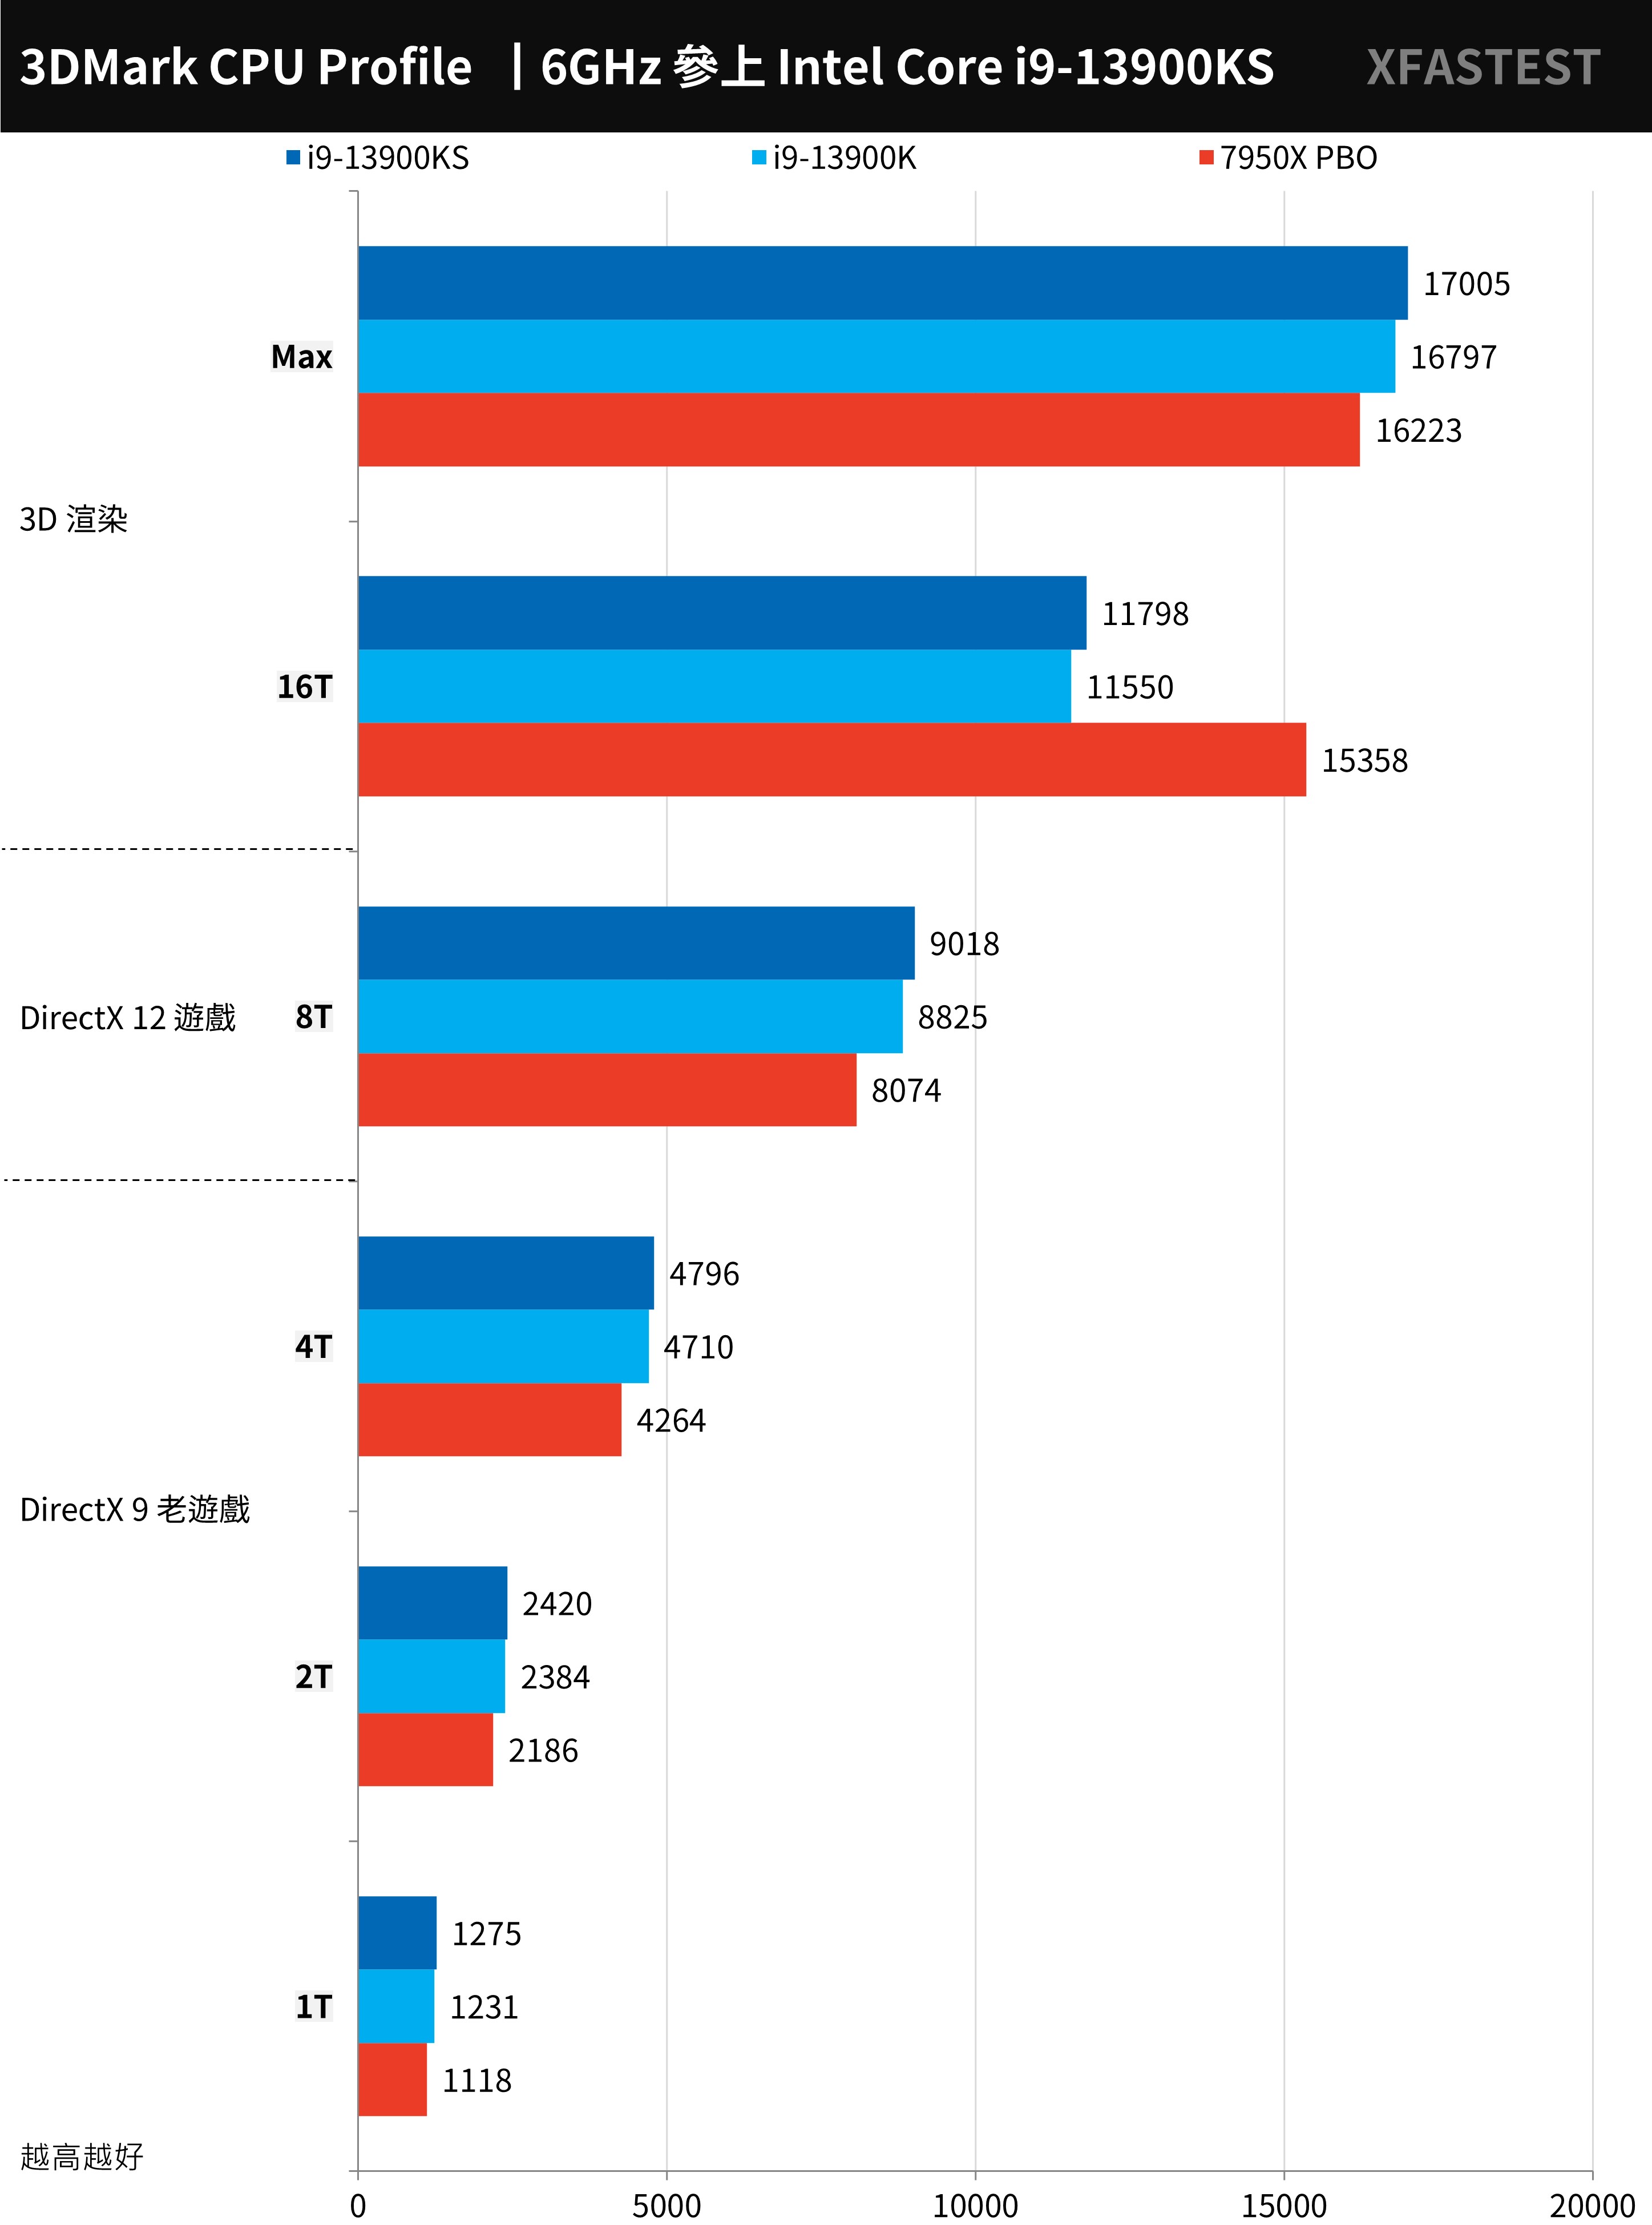
3DMark CPU The test mainly tests the physical operation and custom simulation of the CPU, and tests the performance of 1, 2, 4, 8, 16 and the maximum execution threads of the processor respectively, and the performance above 16 execution threads will belong to 3D rendering, Audio and video output will be used. Generally, Direct X12 games prefer 8T execution threads, while the following execution threads are the preferences of old games.
In the 1T-4T test, the i9-13900KS still has better performance. In the 8T, the i9-13900KS has a slight gap. However, the 7950X PBO score is inexplicably high at 16T. As for the Max thread, it is determined by i9-13900KS won the championship with 17005 points.
↑ 3DMark CPU, the higher the score, the better.
9+2 AAA e-sports games for processor performance test
9 AAA game performance tests, respectively the entry-level “F1® 22”, “Forza Horizon 5” racing game, the adventurous “Tomb Raider: Shadow”, “Horizon: Waiting for Dawn”, and the performance-oriented “Edge Realm 3”, “Assassin’s Creed: Viking Era”, and games such as “Polar Trenches 6”, “Marvel Interstellar Attack Team” and “Device 2077” that support ray pursuit.
The tests were all performed on the In Game Benchmark test with 1080p resolution and the game’s highest default settings.
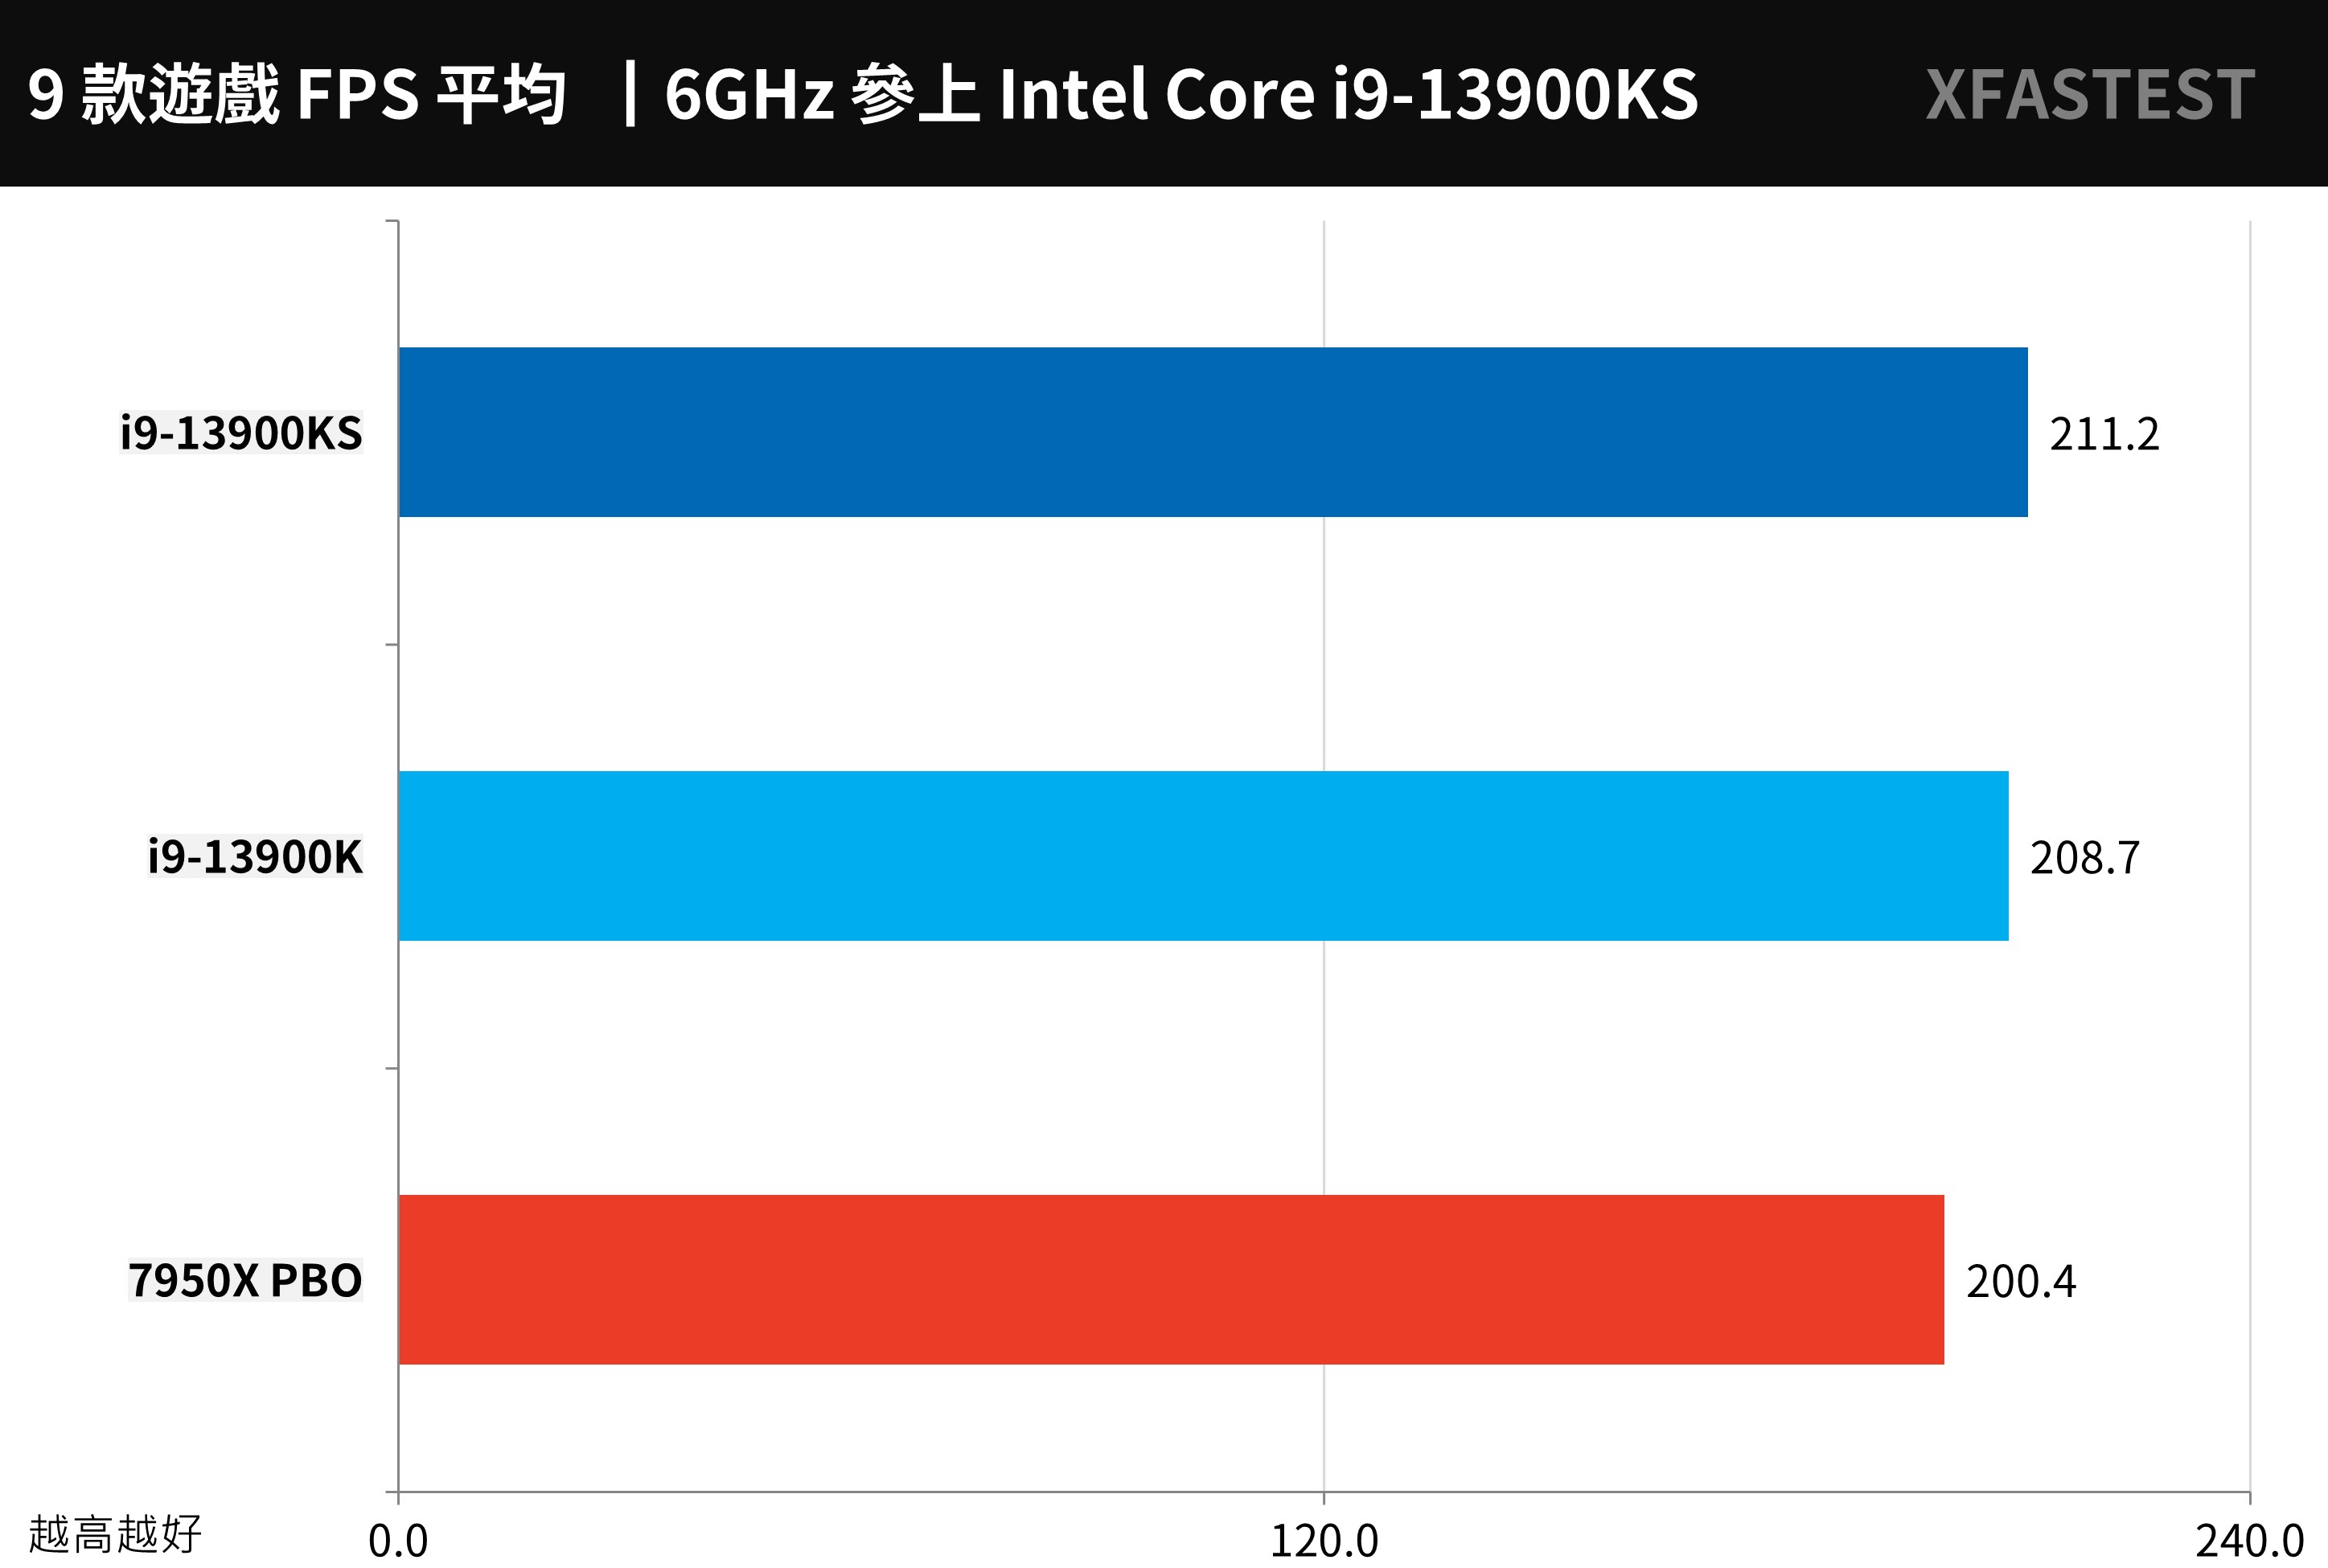
Among the 9 games, the i9-13900KS reached an average of 211.2 FPS, the i9-13900K averaged 208.7 FPS, and the 7950X PBO averaged 200.4 FPS. This shows that the i9-13900KS is undoubtedly the strongest game processor at present.
↑ The higher the average FPS of the 9 games, the better.
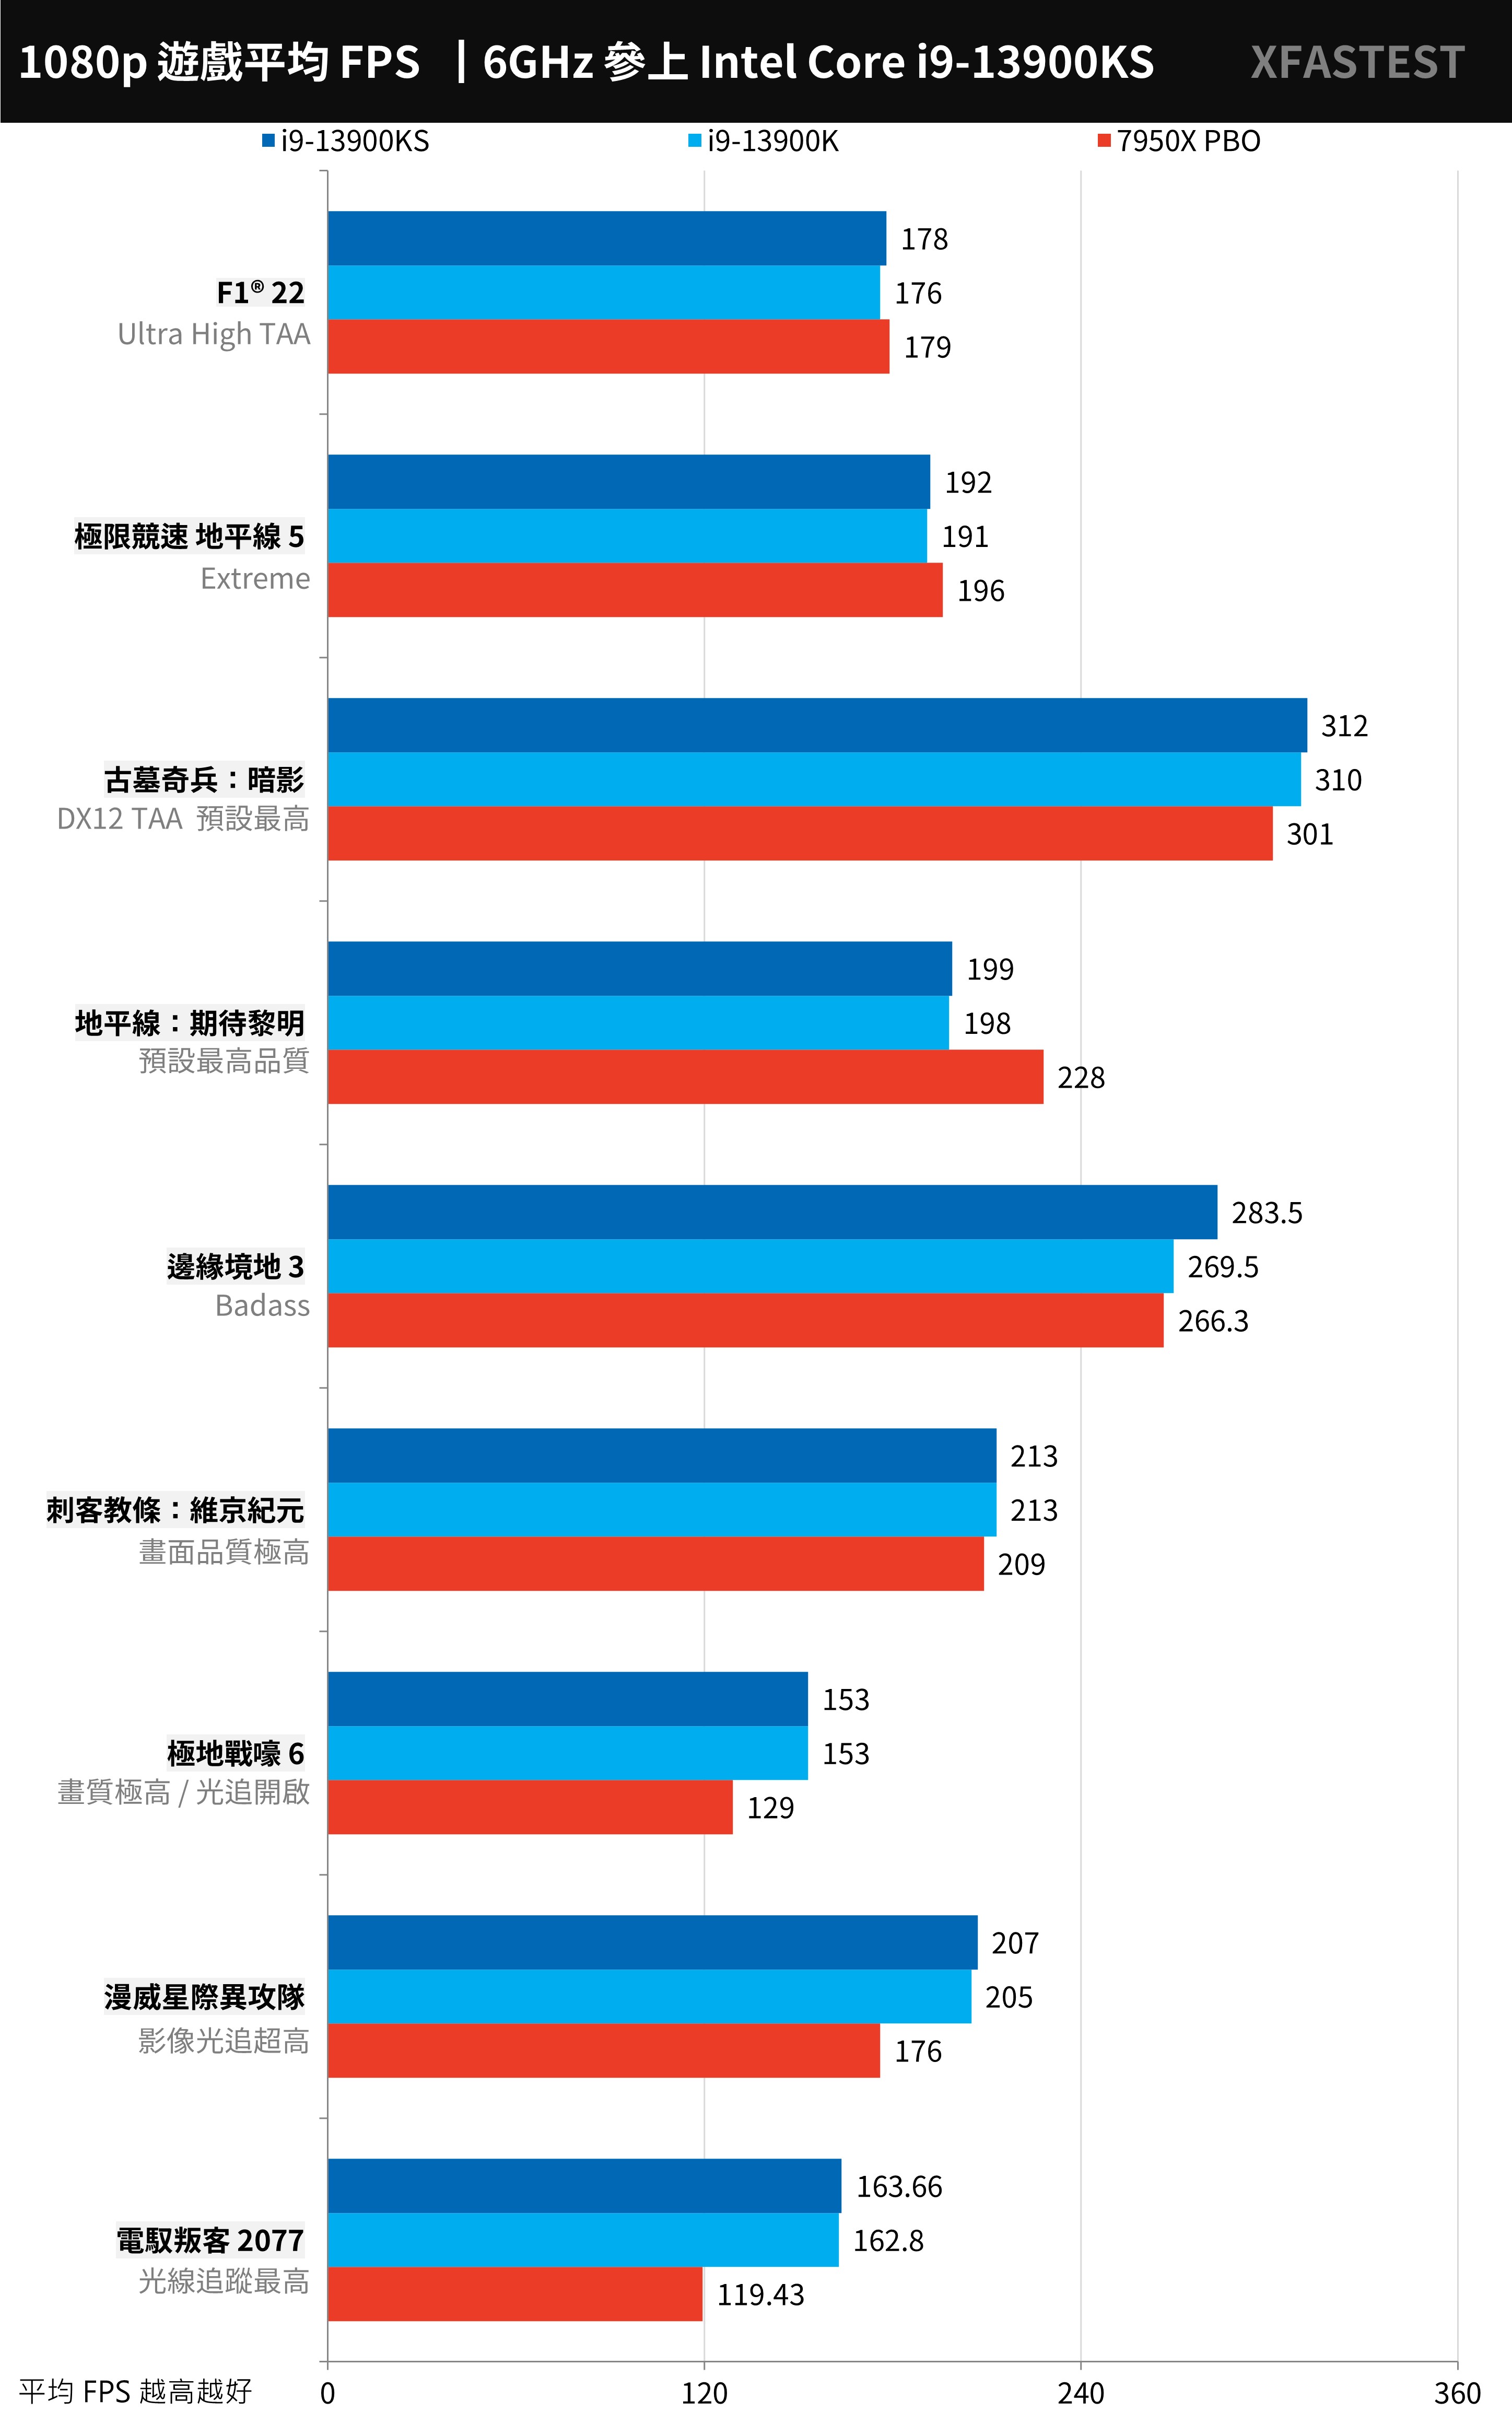
↑ Game test, the higher the average FPS, the better.
E-sports games focus on the tactical and technical competition between players and teams, so they don’t have high requirements for the image quality of the game. This also allows such games to have a fairly high average FPS performance on high-end CPUs and GPUs, especially in 1080p resolution. Under high speed, the improvement of CPU performance and clock can increase the FPS performance of the game.
The test uses two games, “Counter-Strike: Global Offensive” (CS:GO) and “Tom Clancy’s Rainbow Six: Siege” (R6), and tests at 1080p resolution and the game’s highest settings.
The CS:GO game i9-13900KS reaches the highest performance of 892.32 FPS, and the R6 has 753 FPS.
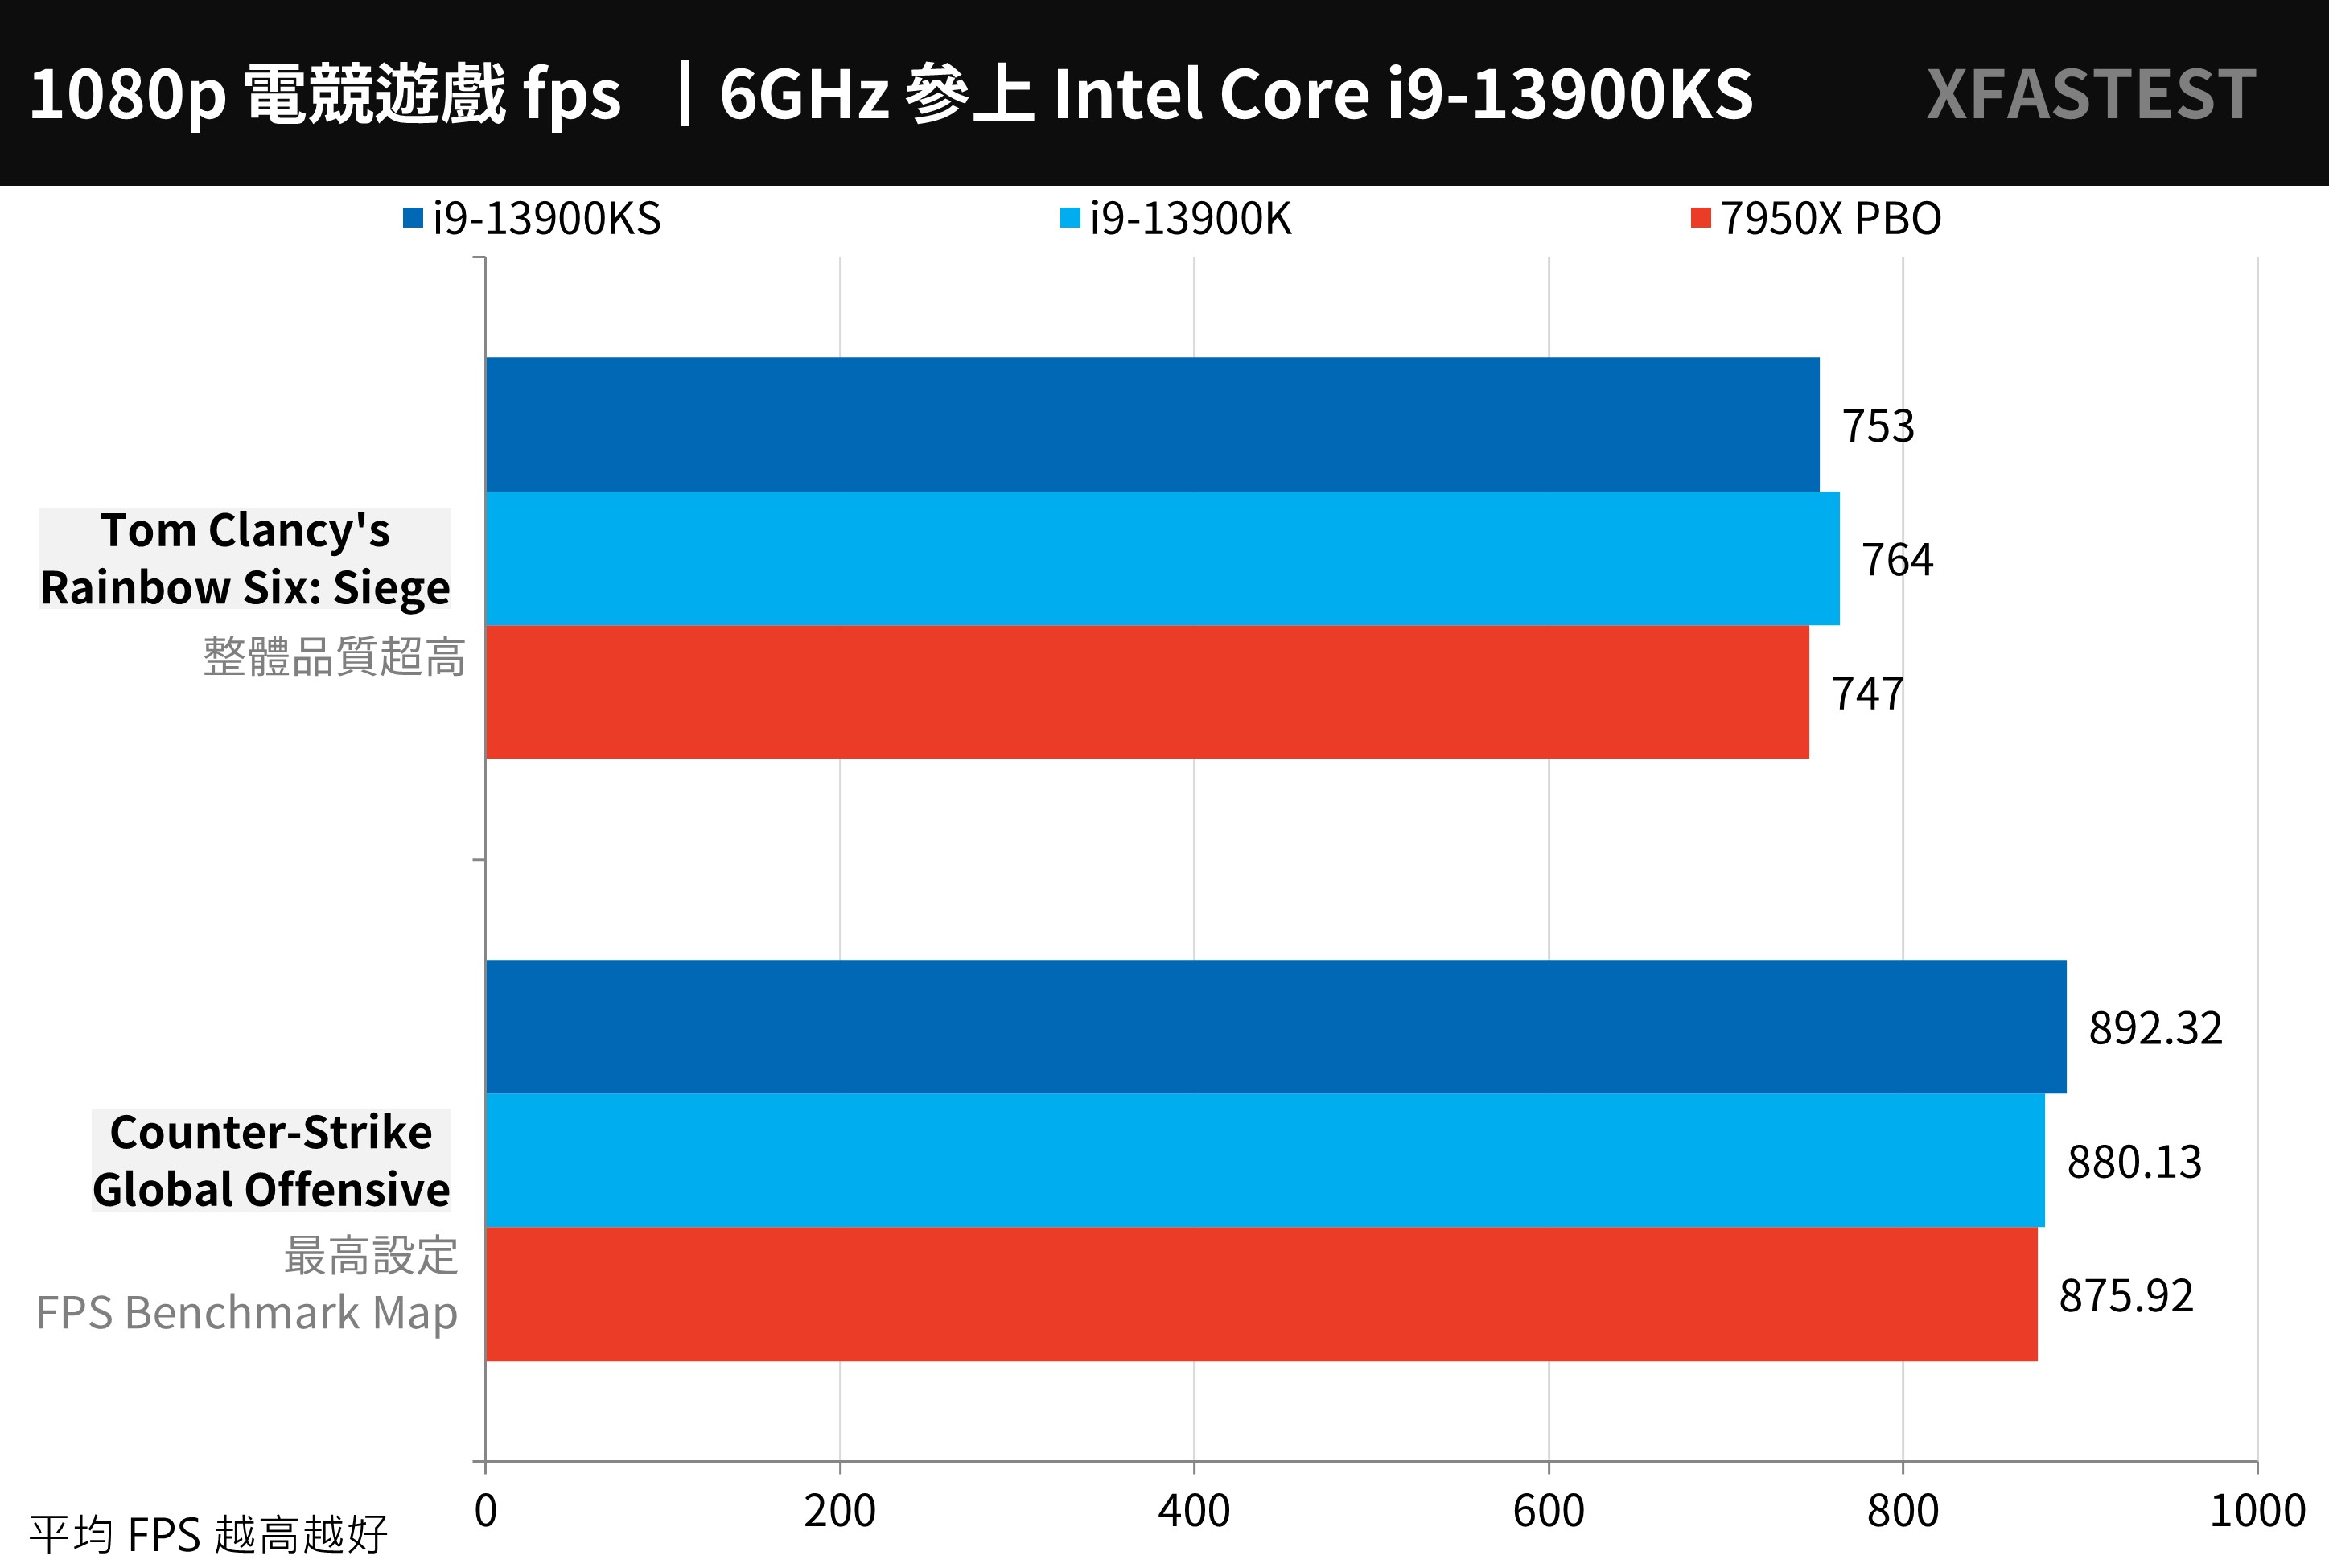
↑ E-sports game test, the higher the average FPS, the better.
Intel Core i9-13900KS processor temperature and power consumption test
In terms of stress testing, the 360mm AIO and the full speed setting of the fan and water pump are uniformly used to compare the AIDA64 CPU, FPU and Cinebench R23 burn-in respectively; for general computer use, it is relatively close to the temperature performance of the AIDA64 CPU test, while the FPU test is the highest load and higher Power consumption status.
AIDA64 CPU stress test, i9-13900KS is under 77°C with full-core P5.6 / E4.3 GHz, but under the FPU and Cinebench R23 stress test, it encounters the upper limit of thermal power consumption of 100°C, but in fact The 7950X PBO is also topped at 95°C. The heat dissipation performance of these two generations can be said to be roughly the same, and a stronger AIO water-cooled radiator is needed to suppress it.
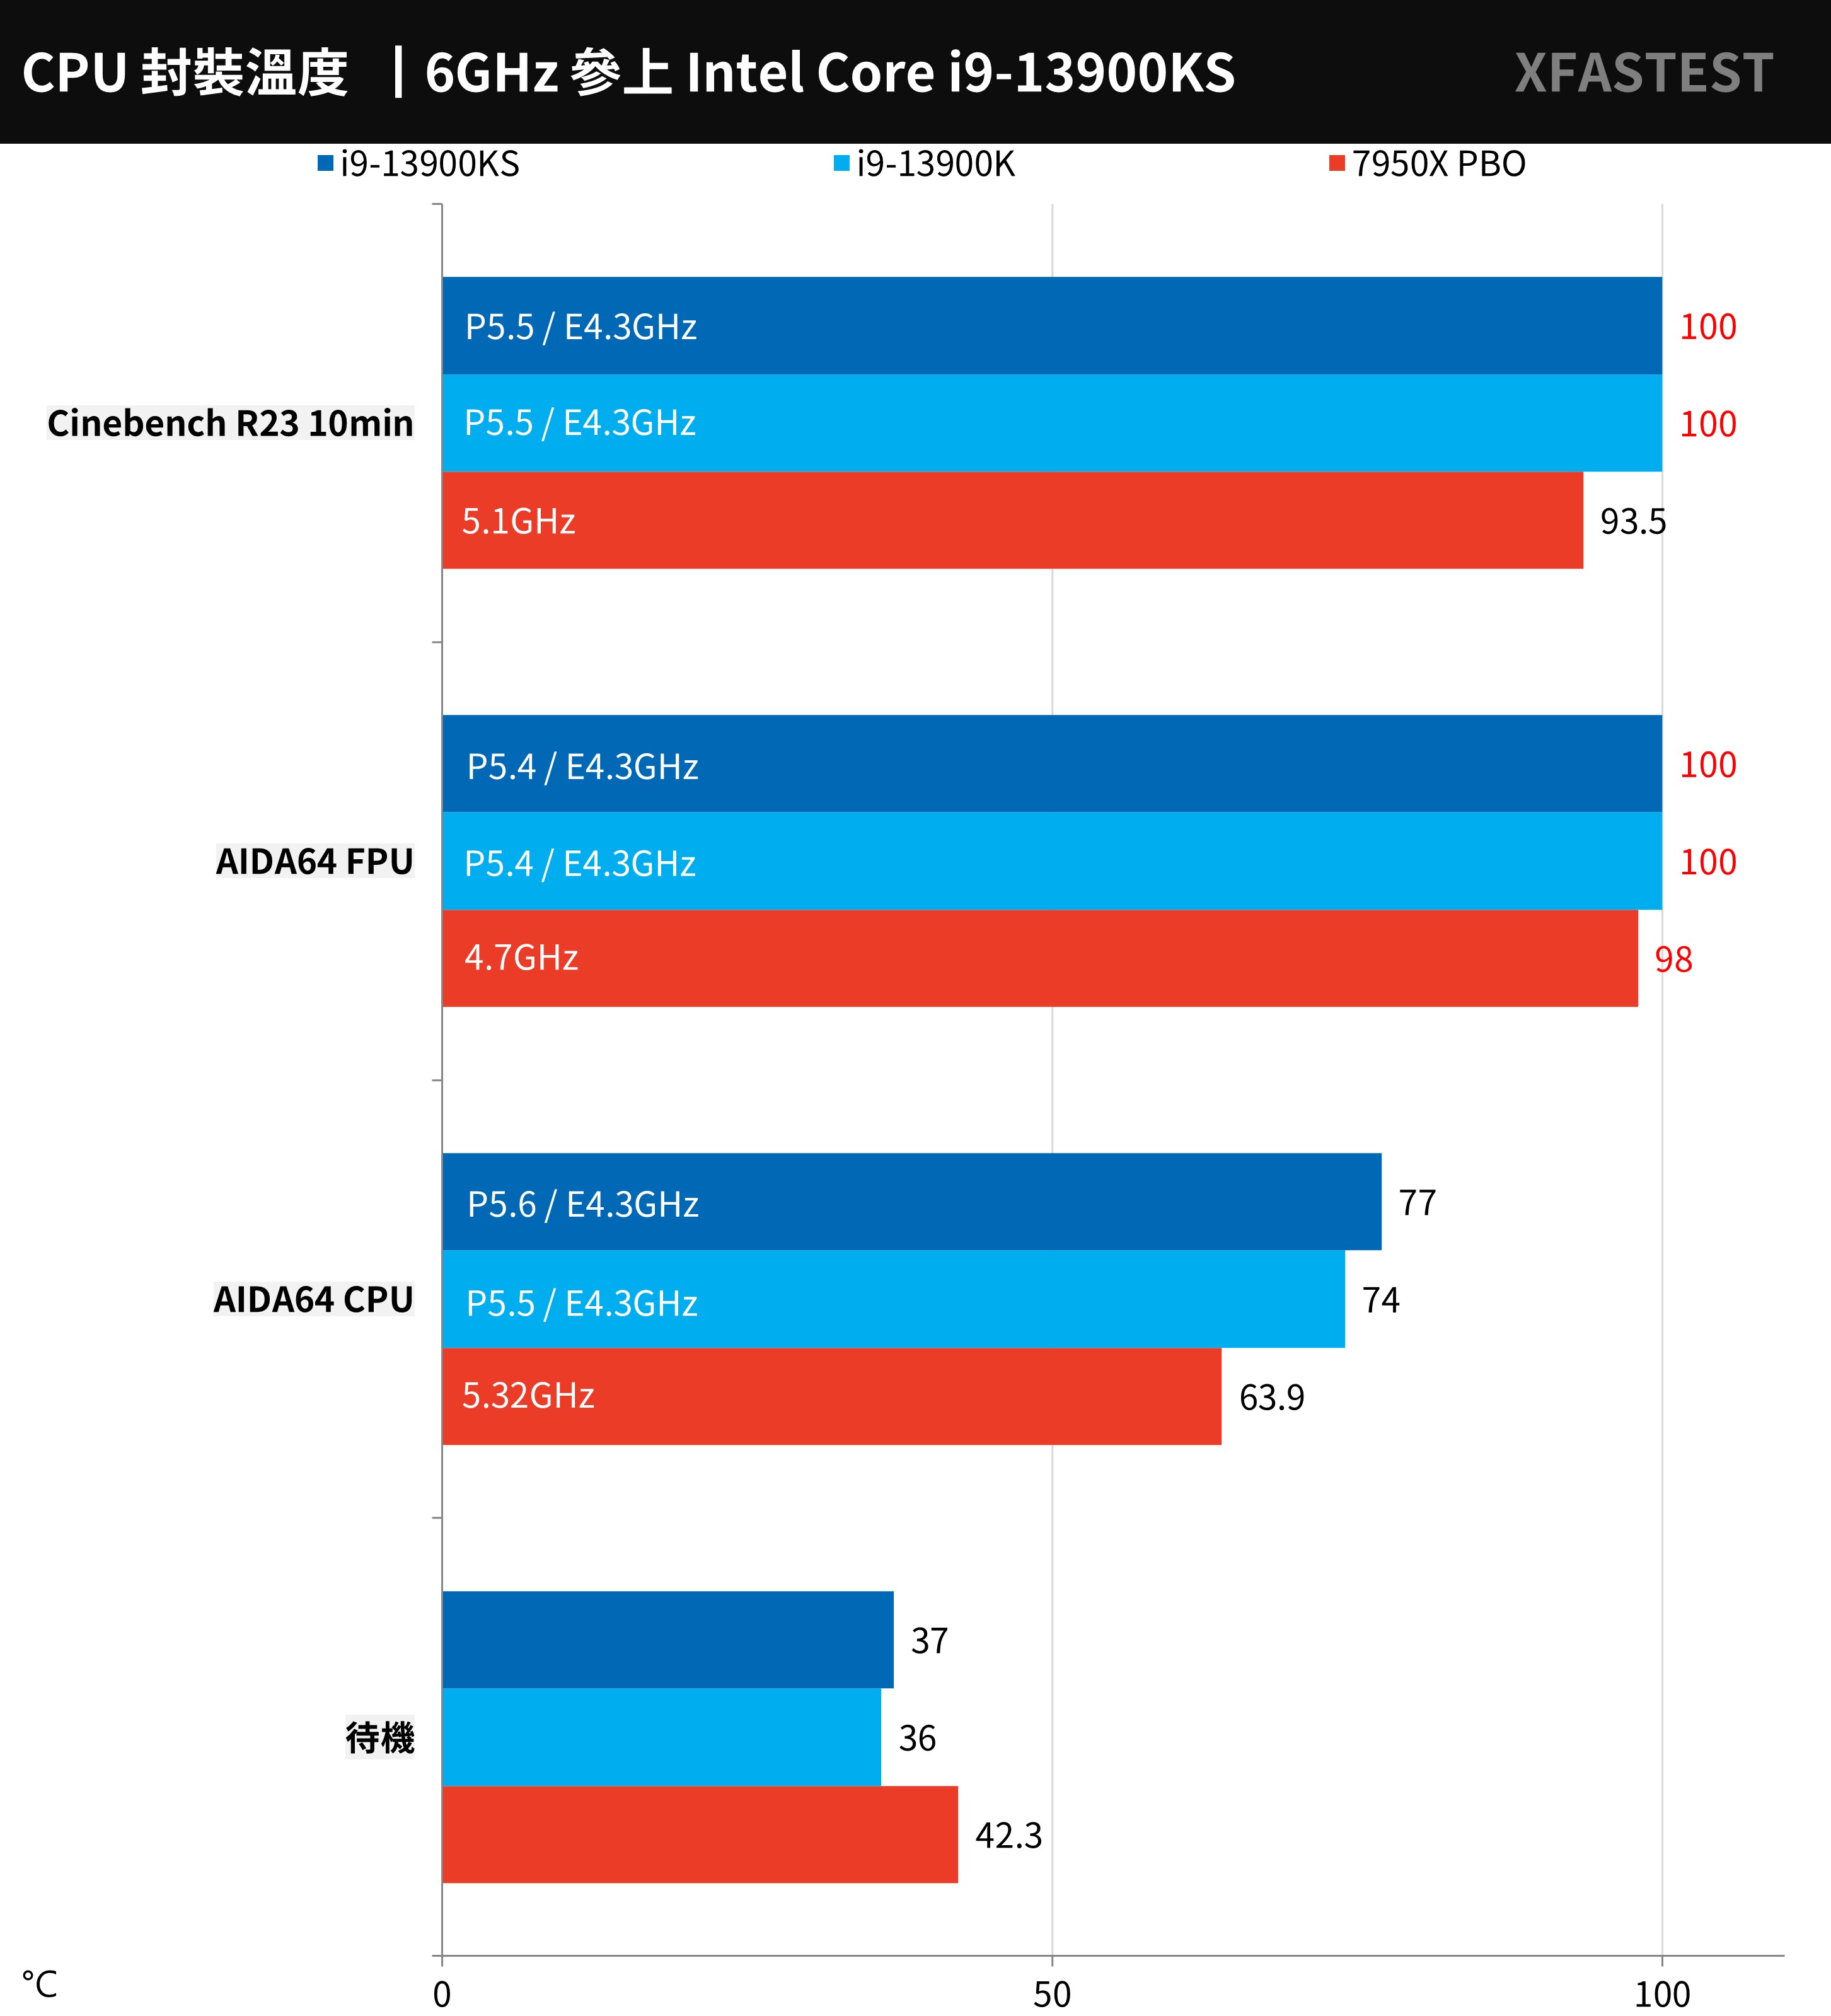
↑ CPU temperature test.
As for CPU power consumption, it is mainly CPU Package Power. Under the AIDA64 CPU test, i9-13900KS reached 199.5W, FPU 295.4W, and Cinebech R23 up to 312W. Compared with the power consumption and clock performance of 7950X PBO, Intel still consumes more power!
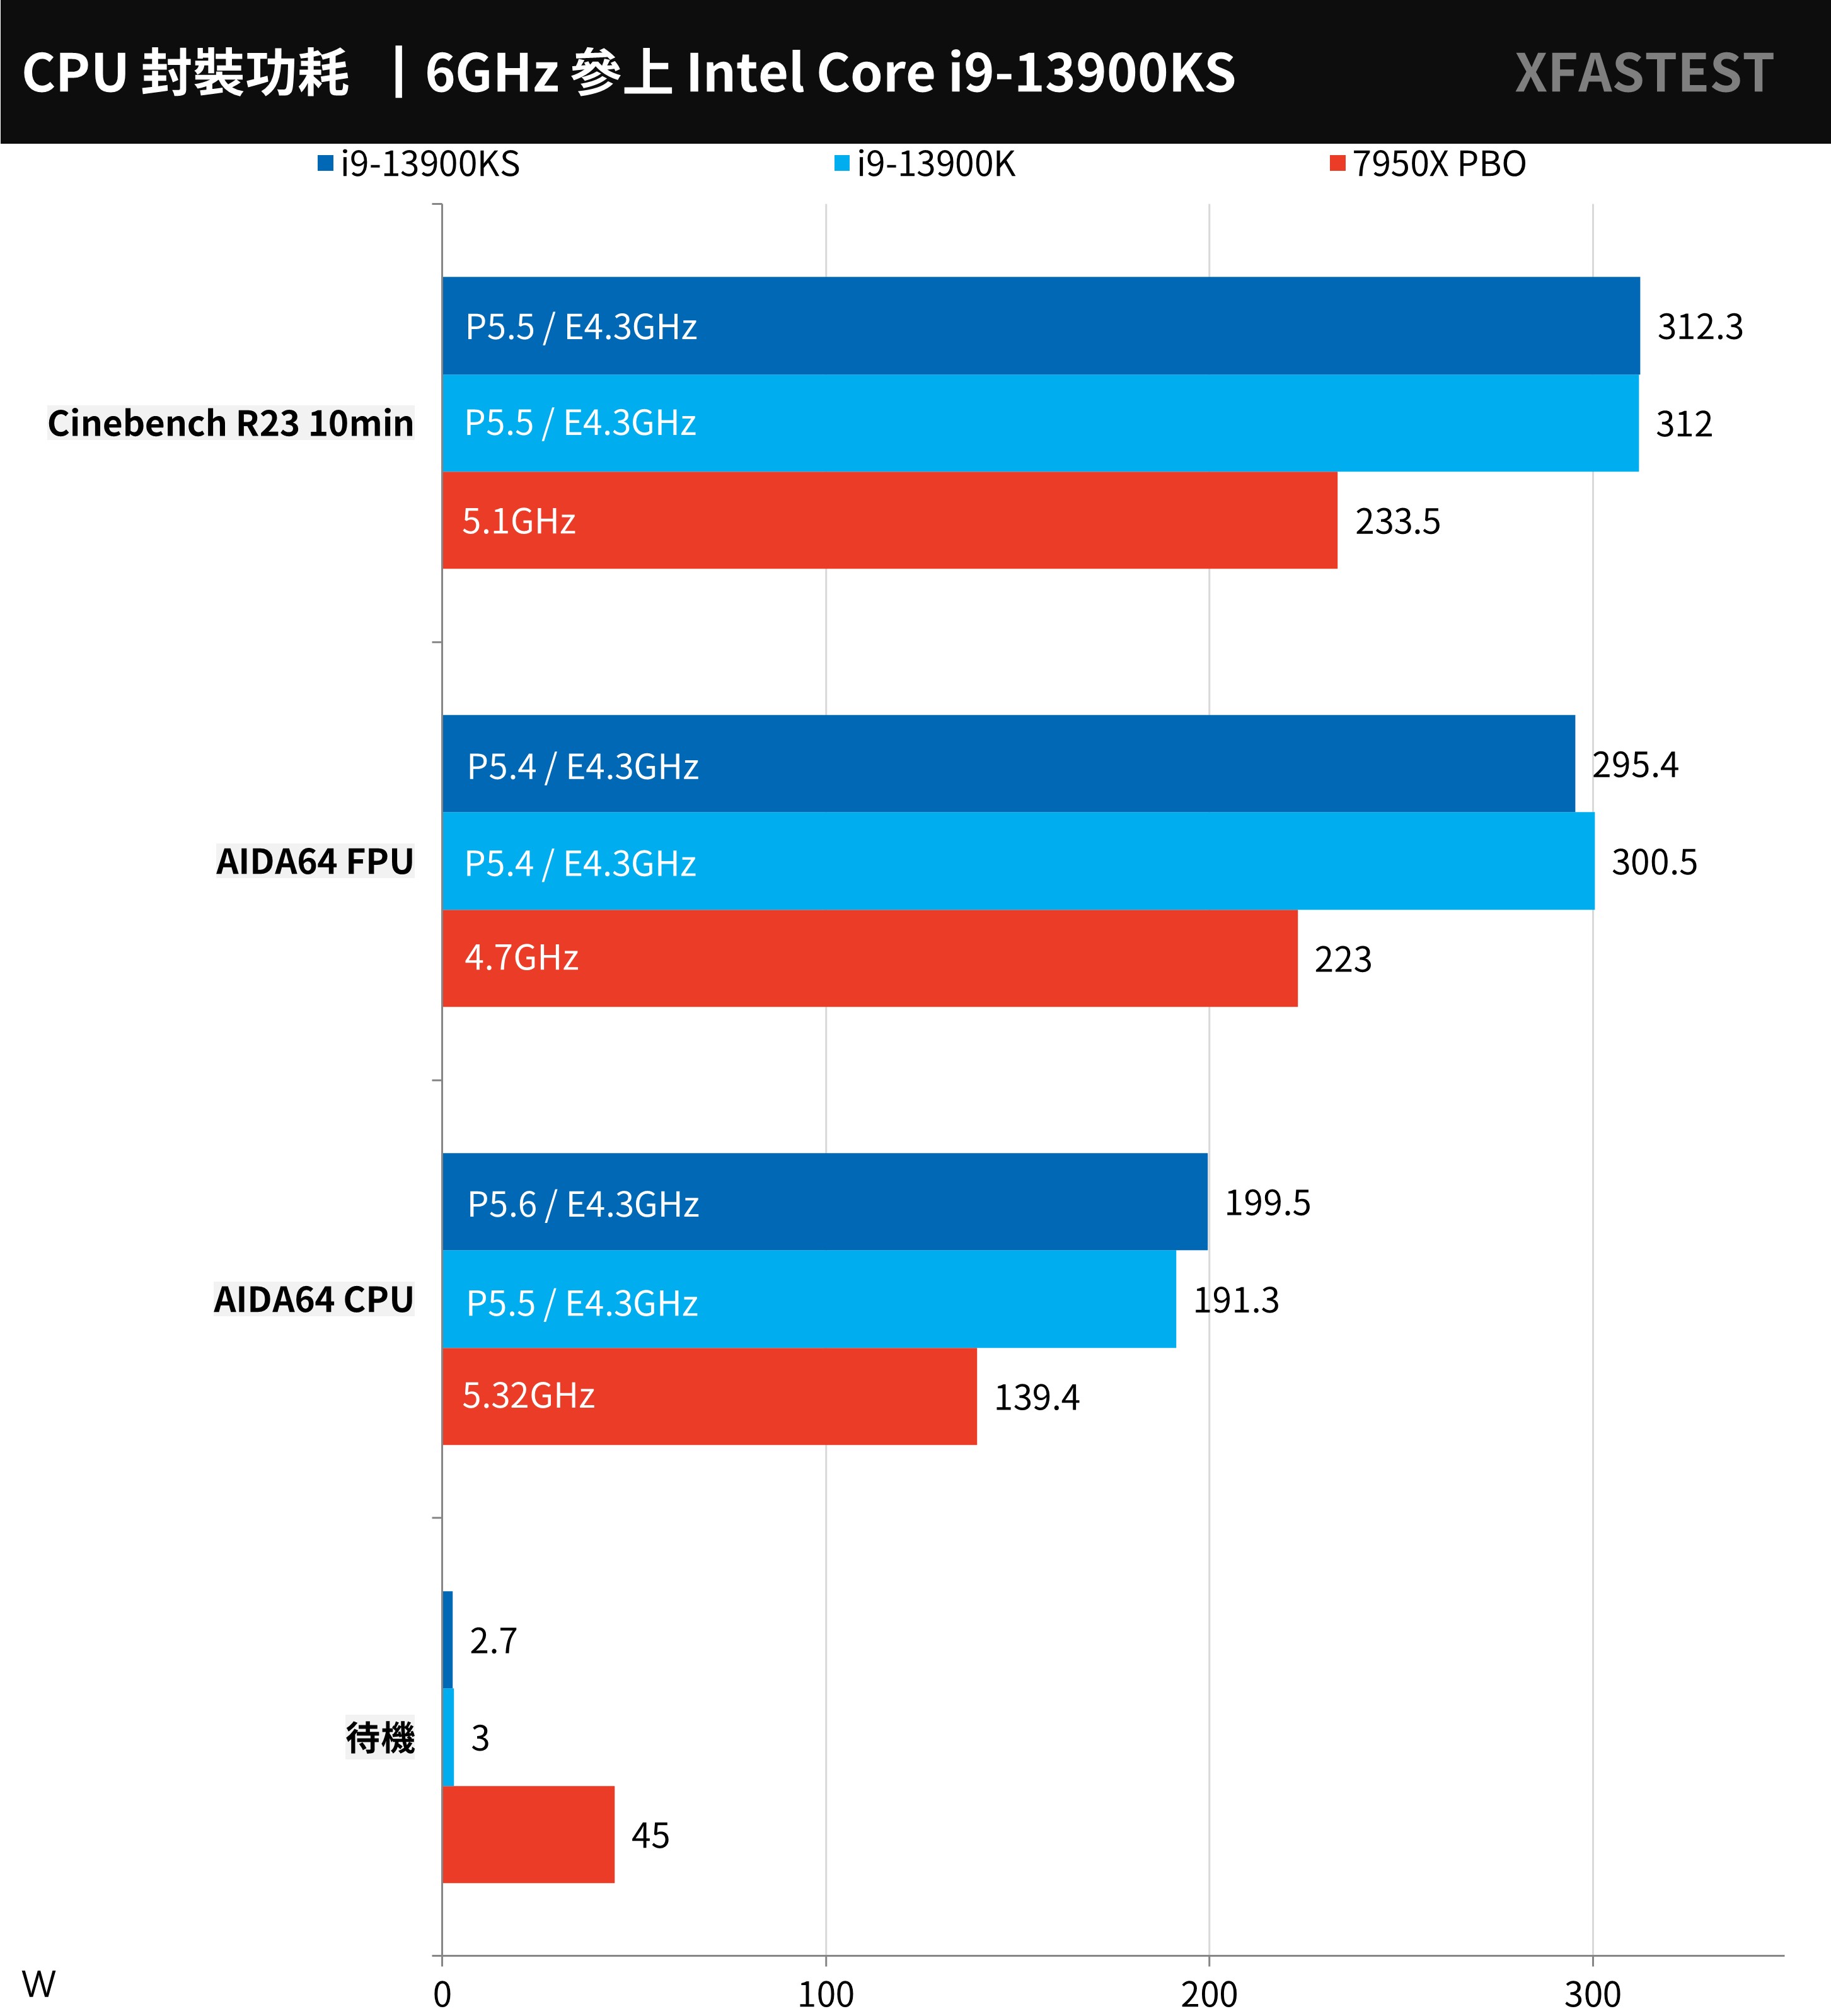
↑ CPU power consumption test.
Summarize
Intel Core i9-13900KS is undoubtedly the most powerful gaming processor at present. With dual-core 6.0GHz and full-core 5.6/4.3GHz high clock speed, it once again dominates multi-core performance, single thread and game performance. However, compared with the Ryzen 7950X open After PBO 200MHz overclocking, in fact, it can be said that it is close to the opponent in some multi-core performance tests, but the overall score is still won by Intel.
However, the boosted clock speed of this generation i9-13900KS can actually be easily achieved by the i9-13900K, as long as the player uses the Per-Core overclocking method through BIOS or XTU, and sets the P-Core 1-2 core at 60x, 3-8 core 56x is enough. If the player has enough budget, he can unlock 6.0GHz overclocking with the power of NT dollars.
However, to be able to withstand the temperature of the i9-13900KS, I am afraid that only a water-cooled radiator above 360mm AIO can do it. If players want to choose a flagship processor, then the motherboard and radiator must not be saved, otherwise they will not run as they should. The performance of the i9-13900KS is even worse, and the i9-13900KS is priced at $699 in US dollars, and the price in Taiwan must be more than 25,000 yuan. It depends on whether you have the money to unlock the high clock speed of 6.0GHz.
Further reading: