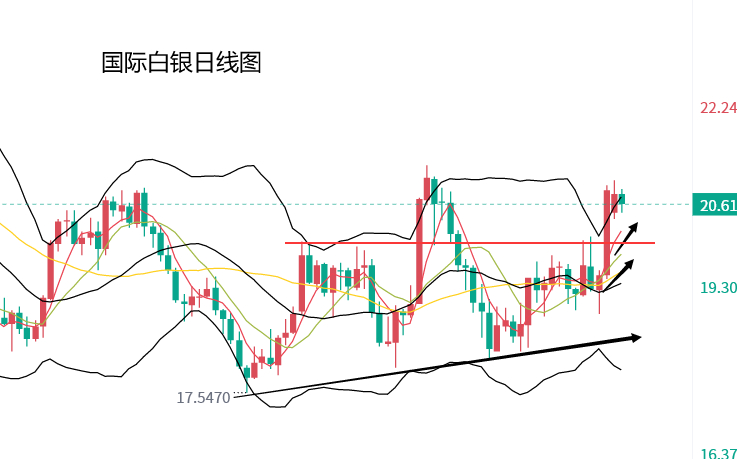
On Monday, the trend of gold bottomed out and rebounded. The price of gold rebounded to US$1,681. It encountered resistance at the high point of the past three weeks. Silver opened lower and moved higher. The price of silver rose to US$21, setting a new high in the past month. The unexpected rise in the U.S. unemployment rate in October announced last Friday strengthened the market’s expectations for a smaller rate hike by the Federal Reserve in the future, dragging down the trend of the dollar. The dollar continued to fall on Monday, providing some support for gold and silver prices.
After the market opened on Tuesday, gold fell slightly, continuing the downward trend after Monday’s rebound and encountered resistance, and temporarily stabilized above Monday’s low of $1,666; silver fell slightly, and the silver price encountered resistance at the $21 integer mark on Monday, and the downward trend continued to the day. After the price of gold and silver rose sharply last Friday, the market fluctuated and adjusted this week, and the short-term wait-and-see mood of the market was strong, waiting for new news to guide the direction.
Wolfinance star analyst Huang Lichen believes that the focus of the market has begun to shift from the impact of interest rates and inflation to concerns about economic recession and financial stability. , in order to reduce the negative impact of policy tightening on the economy, but the Fed’s primary task is still to control inflation, longer and higher terminal interest rate hikes will limit the rise in gold prices.
In terms of news, the market generally pays attention to the US CPI data this Thursday. It is expected that the CPI data will slow to 8% from 8.2% in September, and the core CPI month-on-month and year-on-year growth rates will drop to 0.5% and 6.5%, respectively. At present, the probability of the Fed raising interest rates by 50 basis points in December is 52%. If the CPI data shows that the price pressure has declined, it will help the Fed to slow down the pace of interest rate hikes, support gold prices to continue to rise, and test the $1,700 mark.
On the daily gold chart, after the sharp rise in the price of hardware last week, the trend was corrected and sorted out this week. The short-term fluctuations tended to pull back, but the decline was relatively limited. The Bollinger Band continued to shrink, limiting the upper space. The 5-day moving average gold price went up, with the attached picture In terms of indicators, the MACD indicator has a golden fork upwards, but the KDJ indicator has begun to enter the overbought area, the RSI indicator has turned its golden fork downwards, and the CCI indicator has been overbought and turned its head downwards. There is still a need for correction in short-term prices.
Gold intraday reference: pay attention to the strength of the fall and lay out more orders, the lower support is $1666 (aggressive), followed by the support of $1658 and $1652, and the upper resistance of $1685, breaking through the integer position of $1700.
On the daily chart of silver, after the price of silver rose sharply last Friday, the rally slowed down. On Monday, silver tested upwards and continued to meet resistance at the $21 integer mark. The moving average indicator remained in a long position. On the attached indicator, the MACD indicator is above the zero axis. Divergence, the KDJ indicator golden fork entered the overbought area, the RSI indicator turned downward, the CCI indicator was overbought and turned downward.
Silver intraday reference: pay attention to the strength of the fall and lay out more orders, the lower support is the integer mark of $20.3 and $20, and the upper resistance is the integer mark of $21.

