The trading opportunity on the Ftse Mib index
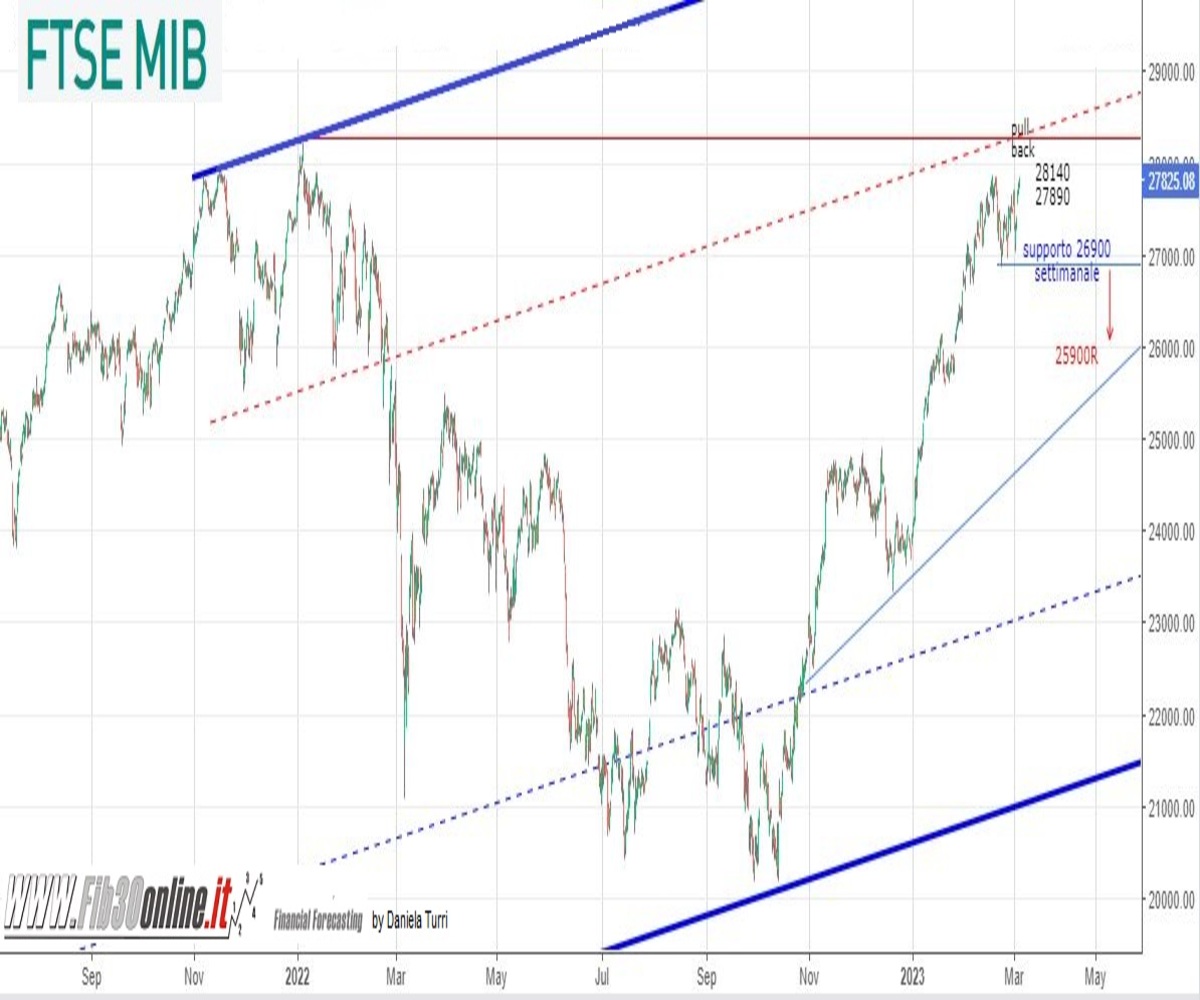
The FTSEMIB40 index closed up the first week of March, returning to 27825 points, close to the 27875 of mid-February and a handful of points from the highs of 28215 reached just over a year ago, in January 2022. Observing the graphs, it can be seen that the index is making a double/triple top (27800/28300) and in a resistance area, and with a retreat to be made on 27400. The recent rise is supported by the weekly support at 26900, on which currents present moderate buying (the violation of this support implies the start of retreats).
The best performances
Among the best performances on Friday 3 March, INWIT +8.17% stands out (the declaration of an increase in dividends starting from 2023 earnings has prompted investors to buy), AMPLIFON +6.73%, PRYSMIAN +4.9%, STM +2.49%, while the banks have recovered from some losses suffered in previous sessions. It is interesting to note that over the 12 months (yr/yr) the best security in the main basket is UNICREDIT: +150% in the period February/2022-February/2023. From the beginning of 2023 – among others – IVECO stands out with a performance of +76% in just two months, BPER and SAIPEM both at +46%.
Manufacturing data
The data relating to the S&P Global Italy manufacturing PMI has also been released: +52 in February 2023, up from 50.4 in the previous month (and above market estimates at 51). It is the most marked increase since April/2022. Improving production boosted producer confidence as they ramped up hiring activity at fastest pace in 11 months. Purchase price inflation is decreasing for the first time since June 2020, thanks to the reduction in the costs of energy products (natural gas at prices below the pre-conflict prices and WTI oil at 76/78 dollars against 130 dollars a year ago) .
What is the Ftse Mib index
The FTSE MIB Index (Milano Indice di Borsa) is the main stock market index which tracks the performance of the 40 main and most liquid companies listed on the Italian Stock Exchange (the so-called blue chips). It is a free-floating, capitalization-weighted index. The base value of the FTSE MIB Index was set at the close of trading on 31 October 2003 at 10644 points. Since that date there have been highs of 44,365 (May/2007) and lows of 12,295 (Jun/2012). The absolute maximums were reached with the MIB30 index at 50108pt.
This article has been prepared for informational purposes only, it does not constitute advice or a solicitation to buy or sell financial instruments. The information reported is in the public domain, but may be subject to change at any time after publication. We therefore decline all responsibility and remind you that any financial transaction is carried out at your own risk.
