
How deep is AMD’s obsession with the “strongest gaming processor”? I think you know the answer by watching the “Ryzen 7 5800X3D” test. AMD’s first desktop processor with 3D V-Cache stacking provides 4MB L2 cache, 32MB 2D L3 cache and 64MB 3D V-Cache under the same 8C16T core specification. 1080p games have a 15% performance improvement, and it can even compete with the i9-12900KS who is the strongest game processor!
AMD Ryzen 7 5800X3D increases 96MB L3 cache without price increase
Whether AMD really cares about the name of the strongest game processor, or is a pioneer in 3D packaging technology, at this point in time, looking at the Ryzen 7 5800X3D processor, I think it is both, and this technology is also possible Adopted in the next-generation Zen 4, it also makes the processor wars in the second half of the year extra interesting.
The specifications of the AMD Ryzen 7 5800X3D processor are not much different from the Ryzen 7 5800X. It is also a 7nm process, an 8-core, 16-thread processor with Zen 3 architecture, but the 5800X3D uses vertical stacking technology to allow L3 cache to reach Large capacity of 96MB.
However, the 5800X3D’s default clock is reduced to 3.4GHz and Boost 4.5GHz, which is indeed a lot lower than the 3.8GHz / 4.7GHz of the 5800X. In addition, the 5800X3D does not provide an “overclocking” function. The processor locks the clock and core voltage. Players can only overclock for memory, Infinity Fabric.
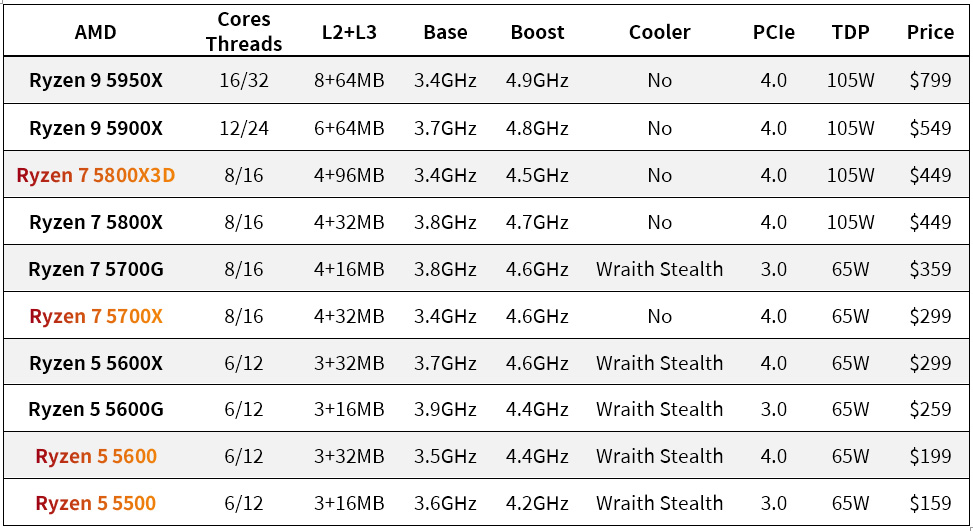
↑ AMD Ryzen 5000 series processor spec sheet.
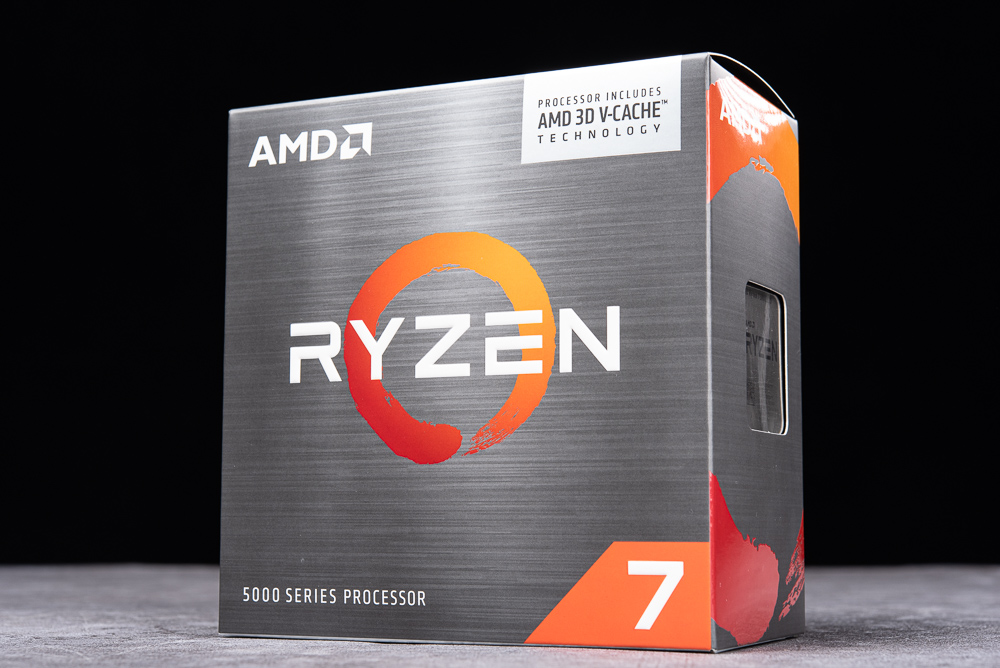
↑ Box labeled AMD 3D V-CACHE technology.
Interestingly, AMD is pricing the 5800X3D and 5800X at the same price of $449 USD. The current price of the 5800X in Taiwan is $8970. It would be interesting if the 5800X3D is priced at the same price in Taiwan dollars, but the current Taiwan market price of the 5700X is also $8970. It was a little embarrassing.
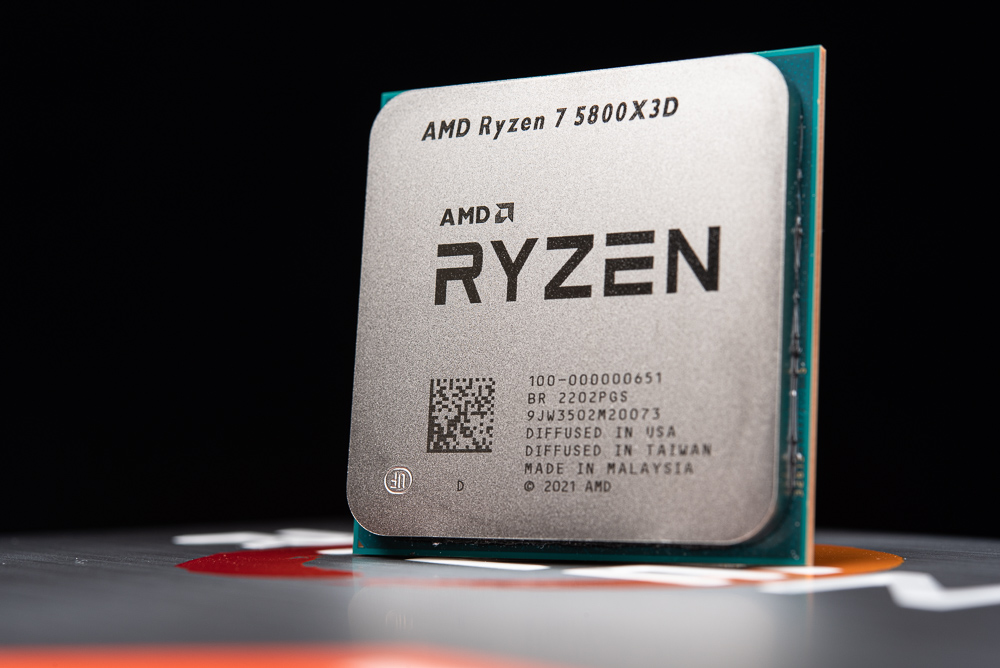
↑ AMD Ryzen 7 5800X3D。
AMD 3D V-Cache / Hybrid Bond to create a 96MB L3 cache processor
Although the specifications are the same, the process of Ryzen 7 5800X3D is greatly changed. First, the height (Z-Hight) of the CCD die of the Zen 3 architecture of the 7nm process is reduced, and the 64MB of the same 7nm process is stacked on the top through AMD 3D V-Cache technology. L3 caches L3Die, and the final die height is the same as the original Ryzen processor, so the processor’s thermal top cover and heatsink can be used.
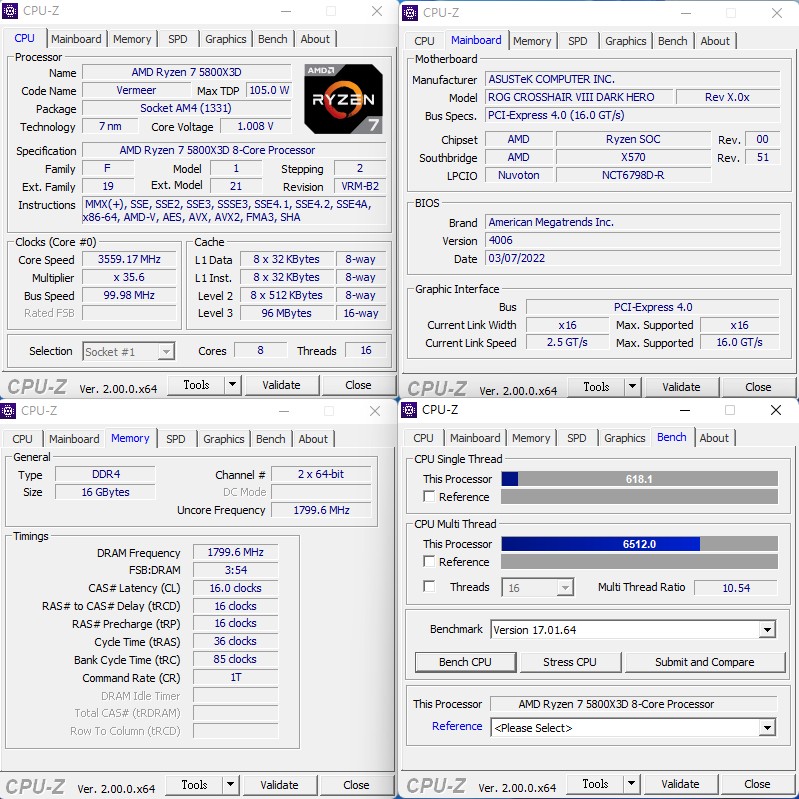
↑ CPU-Z shows 96MB L3 cache.
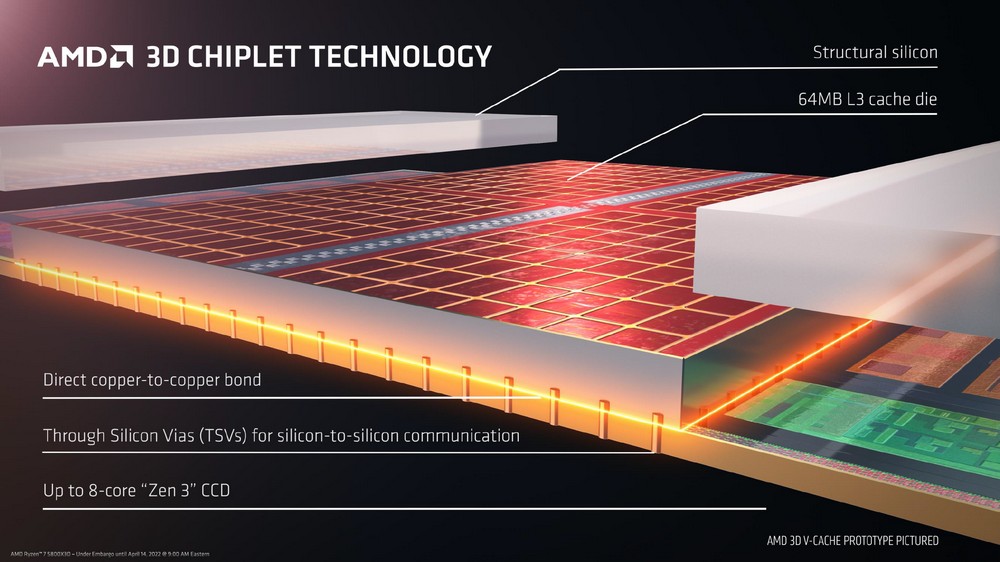
↑ AMD 3D V-Cache stacking architecture.
AMD stacks L3Die chips with an area of 41mm2 on a CCD chip with an area of 81mm2, and uses the Hybrid Bond technology to directly connect the upper and lower chips with Copper-to-Copper Bound. Through TSV technology, the chips can be connected to each other. Direct signal transmission and power supply.
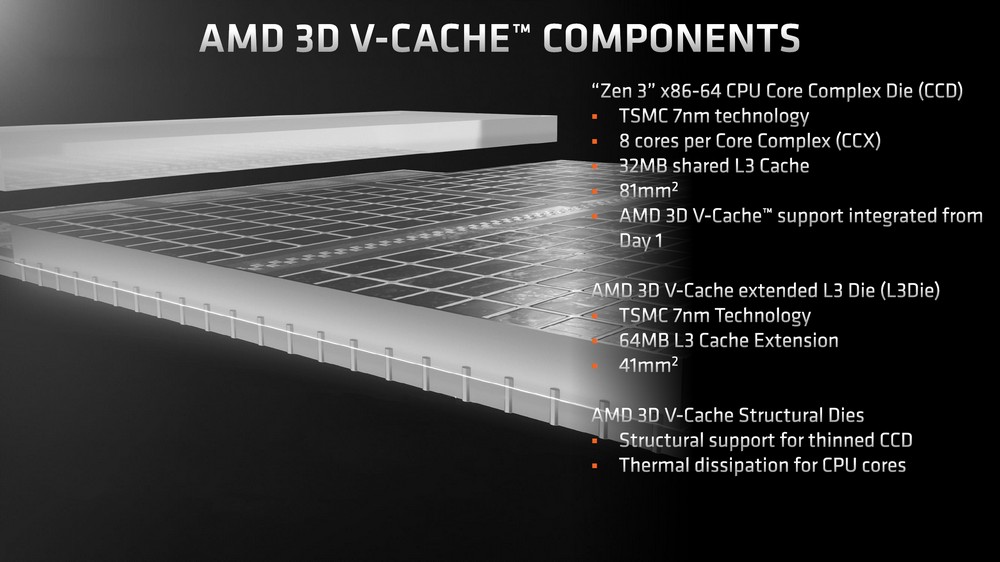
↑ CCD and L3Die information.
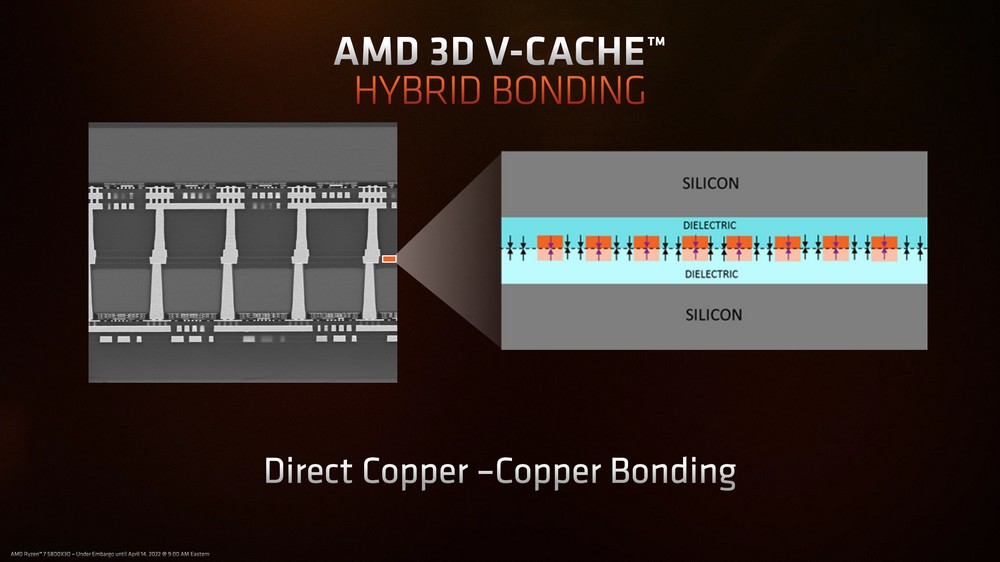
↑ Direct copper-to-copper bound.
AMD’s 3D V-Cache Hybrid Bond technology has a higher 9u bump pitch internal density, which is much higher than C4 130u or Micro Bump 50u, which means a higher transfer frequency between the chip and the cache width, and lower power consumption performance.
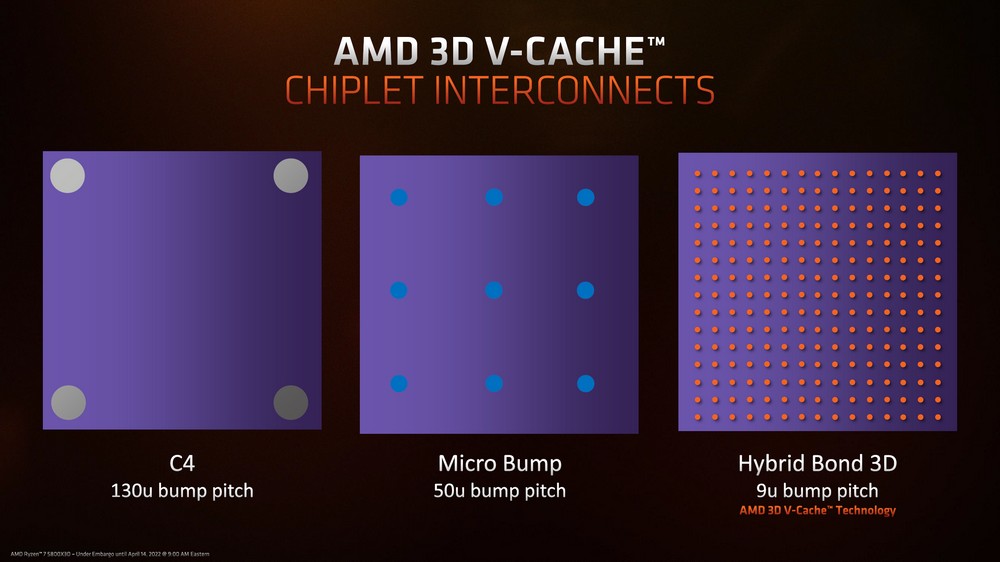
↑ Comparison of internal bump density on chip.
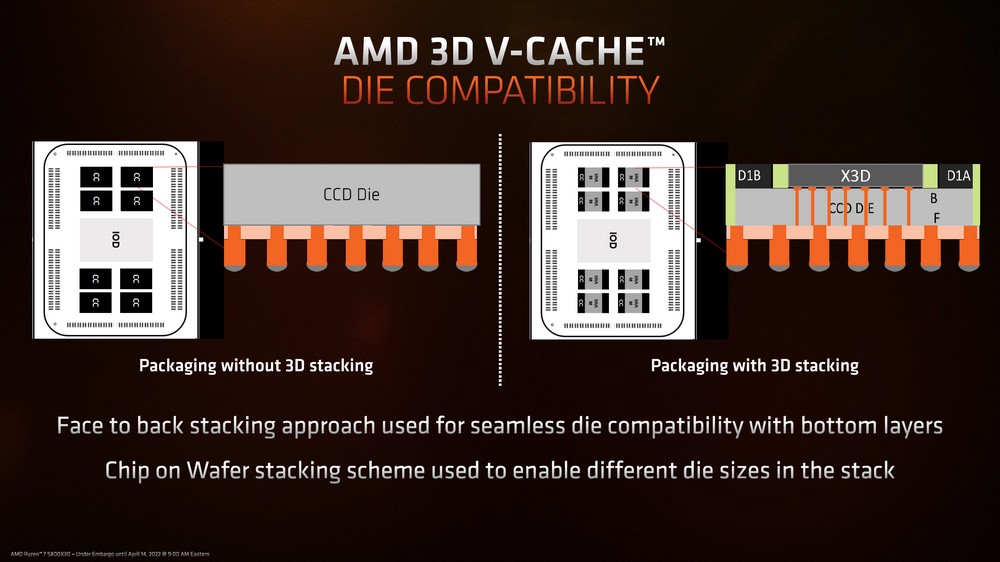
↑ AMD 3D stacking allows die of different areas to be connected by Hybrid Bond.
Testbed and setup Ryzen 7 5800X3D
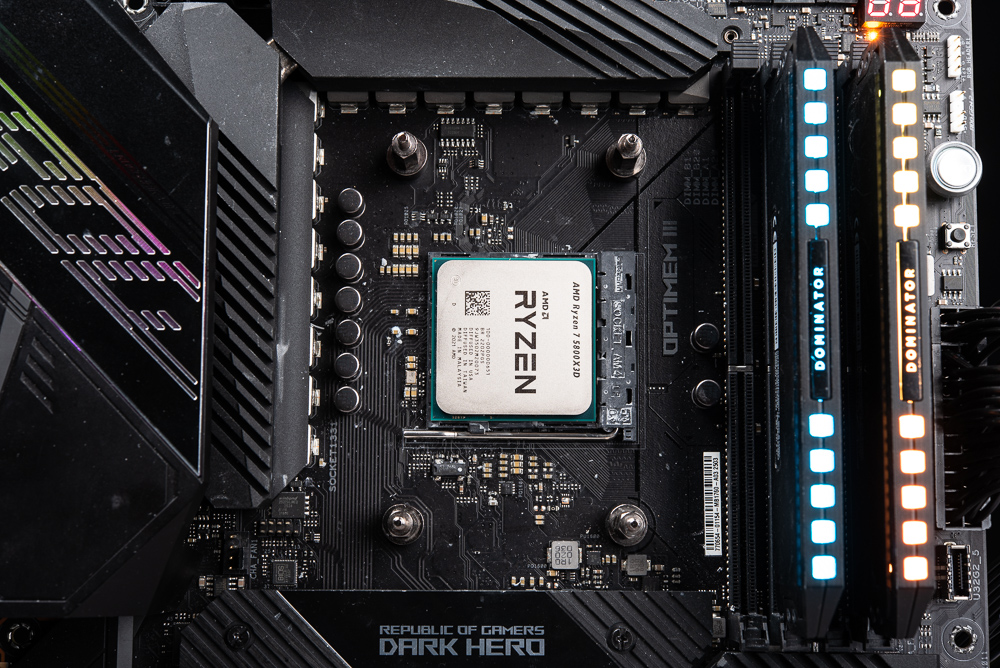
AMD attaches great importance to the game performance of Ryzen 7 5800X3D at 1080p resolution. If it wants to become the strongest game processor, it must be compared with Intel Core i9-12900KS. Of course, Ryzen 5900X and 5800X are also added for comparison. In terms of performance; the test platform is ROG Crosshair VIII Dark Hero, DDR4 8GBx2 3600MHz and RTX 3080 Ti.
Since the 5800X3D does not support PBO and manual overclocking, the settings are the motherboard default Auto, the XMP 3600 memory parameters are applied, and the Windows power management is set to Balanced, and the same settings are applied to other AMD processors; as for the i9-12900KS, it is By default, TVB and ABT are enabled.
testing platform
Processor: AMD Ryzen 7 5800X3D, 5800X, 5900X
Motherboard: ASUS ROG Crosshair VIII Dark Hero 4006
Memory: G.Skill DDR4 8GBx2 3600MHz
Graphics Card: NVIDIA GeForce RTX 3080 Ti
System Disk: Samsung NVMe SSD 960 PRO M.2
Radiator: ASUS ROG STRIX LC II 280mm
Power supply: be quiet! DARK POWER 12 750W
Operating system: Windows 11 Pro 21H2
Processor: Intel Core i9-12900KS
Motherboard: ASUS ROG MAXIMUS Z690 HERO 1304
Memory: CORSAIR DOMINATOR PLATINUM RGB DDR5 32GBx2 5200MHz
9+2 AAA gaming games on processor performance test
This time, we adjusted the order to test the performance of 9 AAA games and 2 e-sports games.
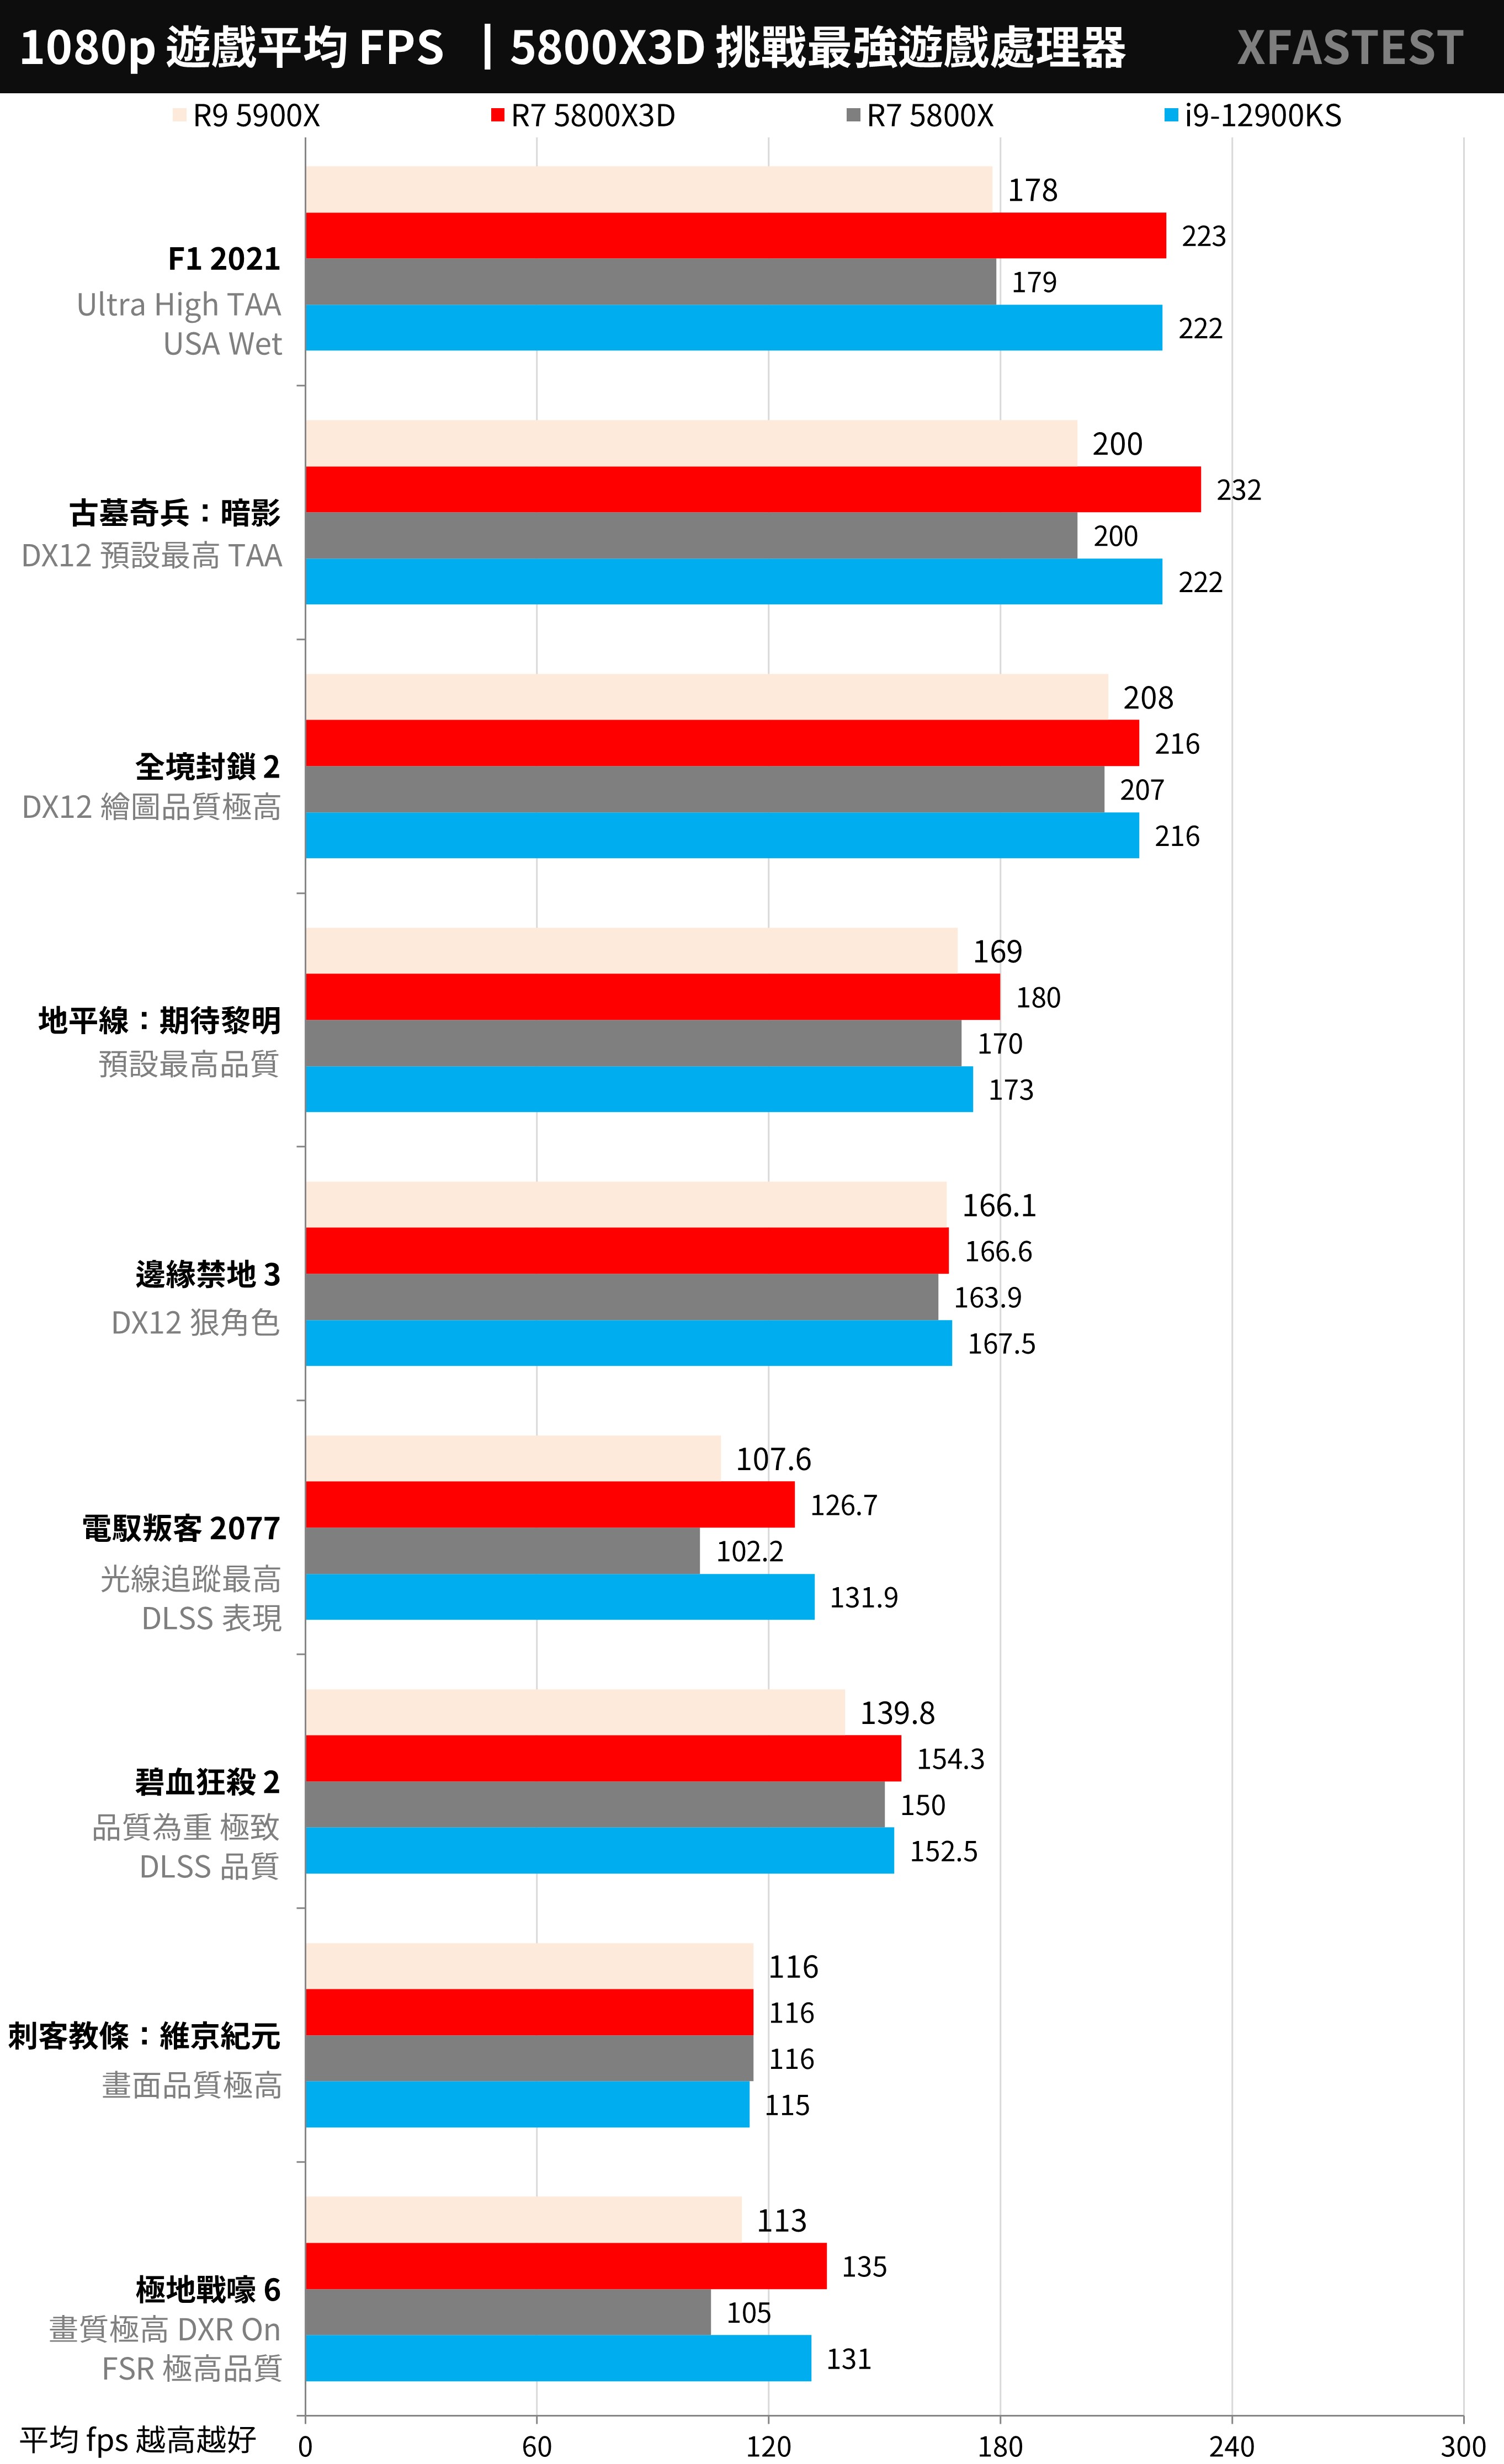
9 AAA game performance tests, including “F1 2021”, “Tomb Raider: Shadow”, “The Division 2”, “Horizon: Expect Dawn”, as well as the performance-heavy “Forbidden Land 3”, “Assassin’s Creed: Dimension” Beijing Era”, “Electric Rider 2077”, “Blood Killer 2” and “Polar Trench 6”, etc.
All tests were conducted with the In Game Benchmark at 1080p resolution and the game’s highest default settings.
In the 9 games tested this time, the 5800X3D achieved a performance of 172.2 FPS. It beat the i9-12900KS’s 170.1 FPS, which is a small win in game performance. Compared with the 5900X’s 155.3 FPS, the game performance increased by as much as 11%.
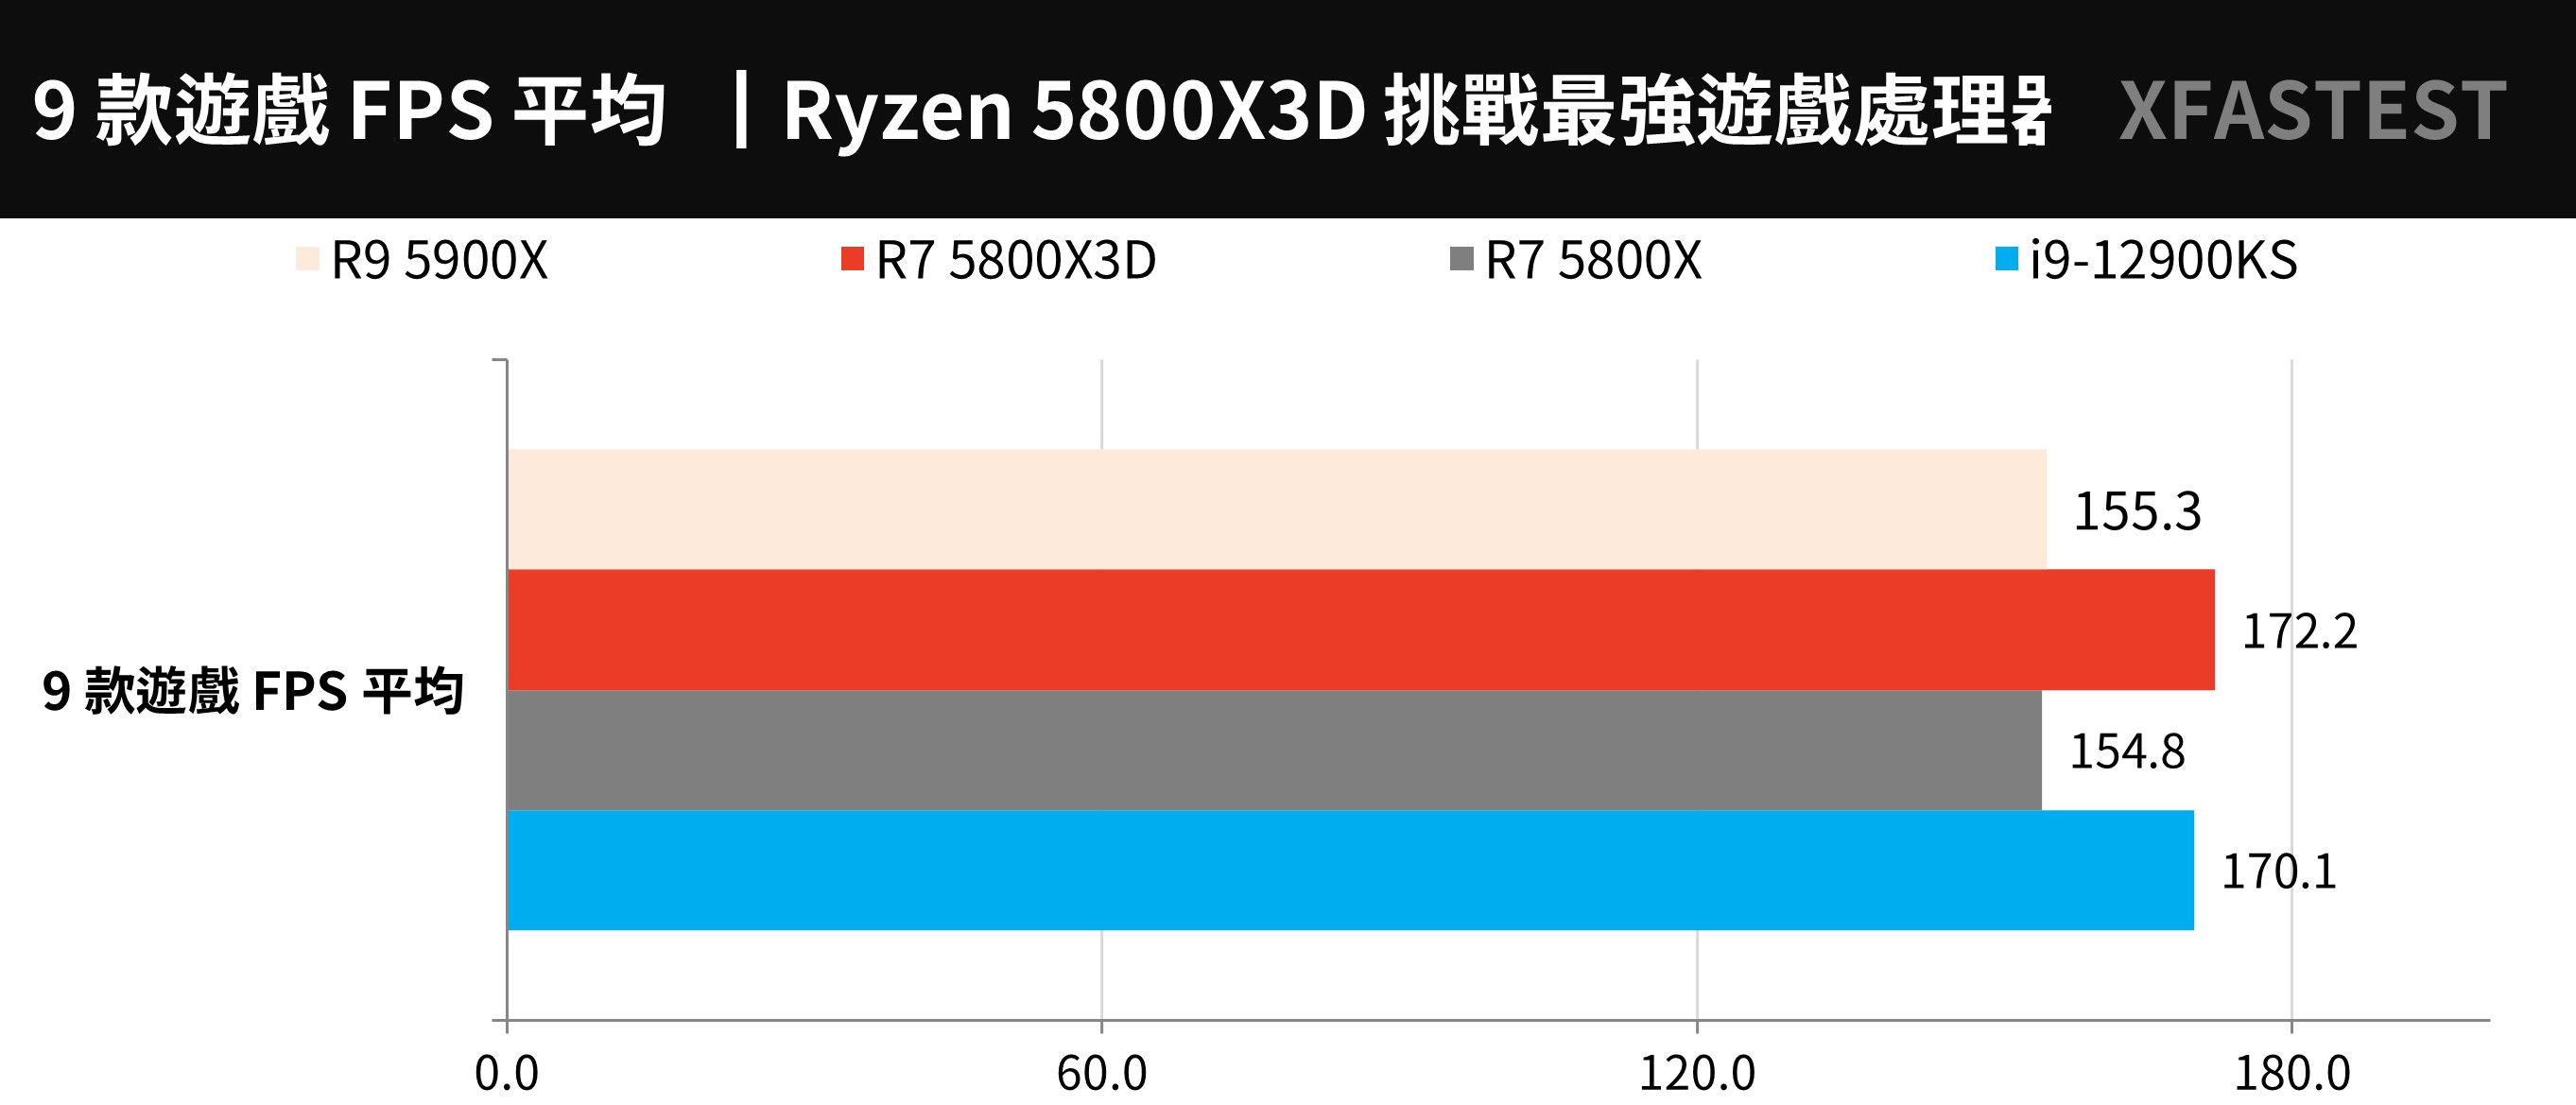
↑ Average FPS of 9 games, higher is better.
↑ The average FPS of the game, the higher the better.
The 2 e-sports games were tested using “Counter-Strike: Global Offensive” (CS:GO) and “Tom Clancy’s Rainbow Six: Siege” (R6). ; And because this type of game does not focus on image quality and special effects, mainstream computers can get quite high performance, which can better reflect the difference between CPU and game FPS.
It’s just that CS:GO and R6 are relatively high clocks. The 5800X3D averages 665.97 FPS in CS:GO and 616 FPS in R6. The relative performance is lost to the i9-12900KS, but the performance of these two games is comparable to the 5800X3D. There is still an improvement on the 5900X.
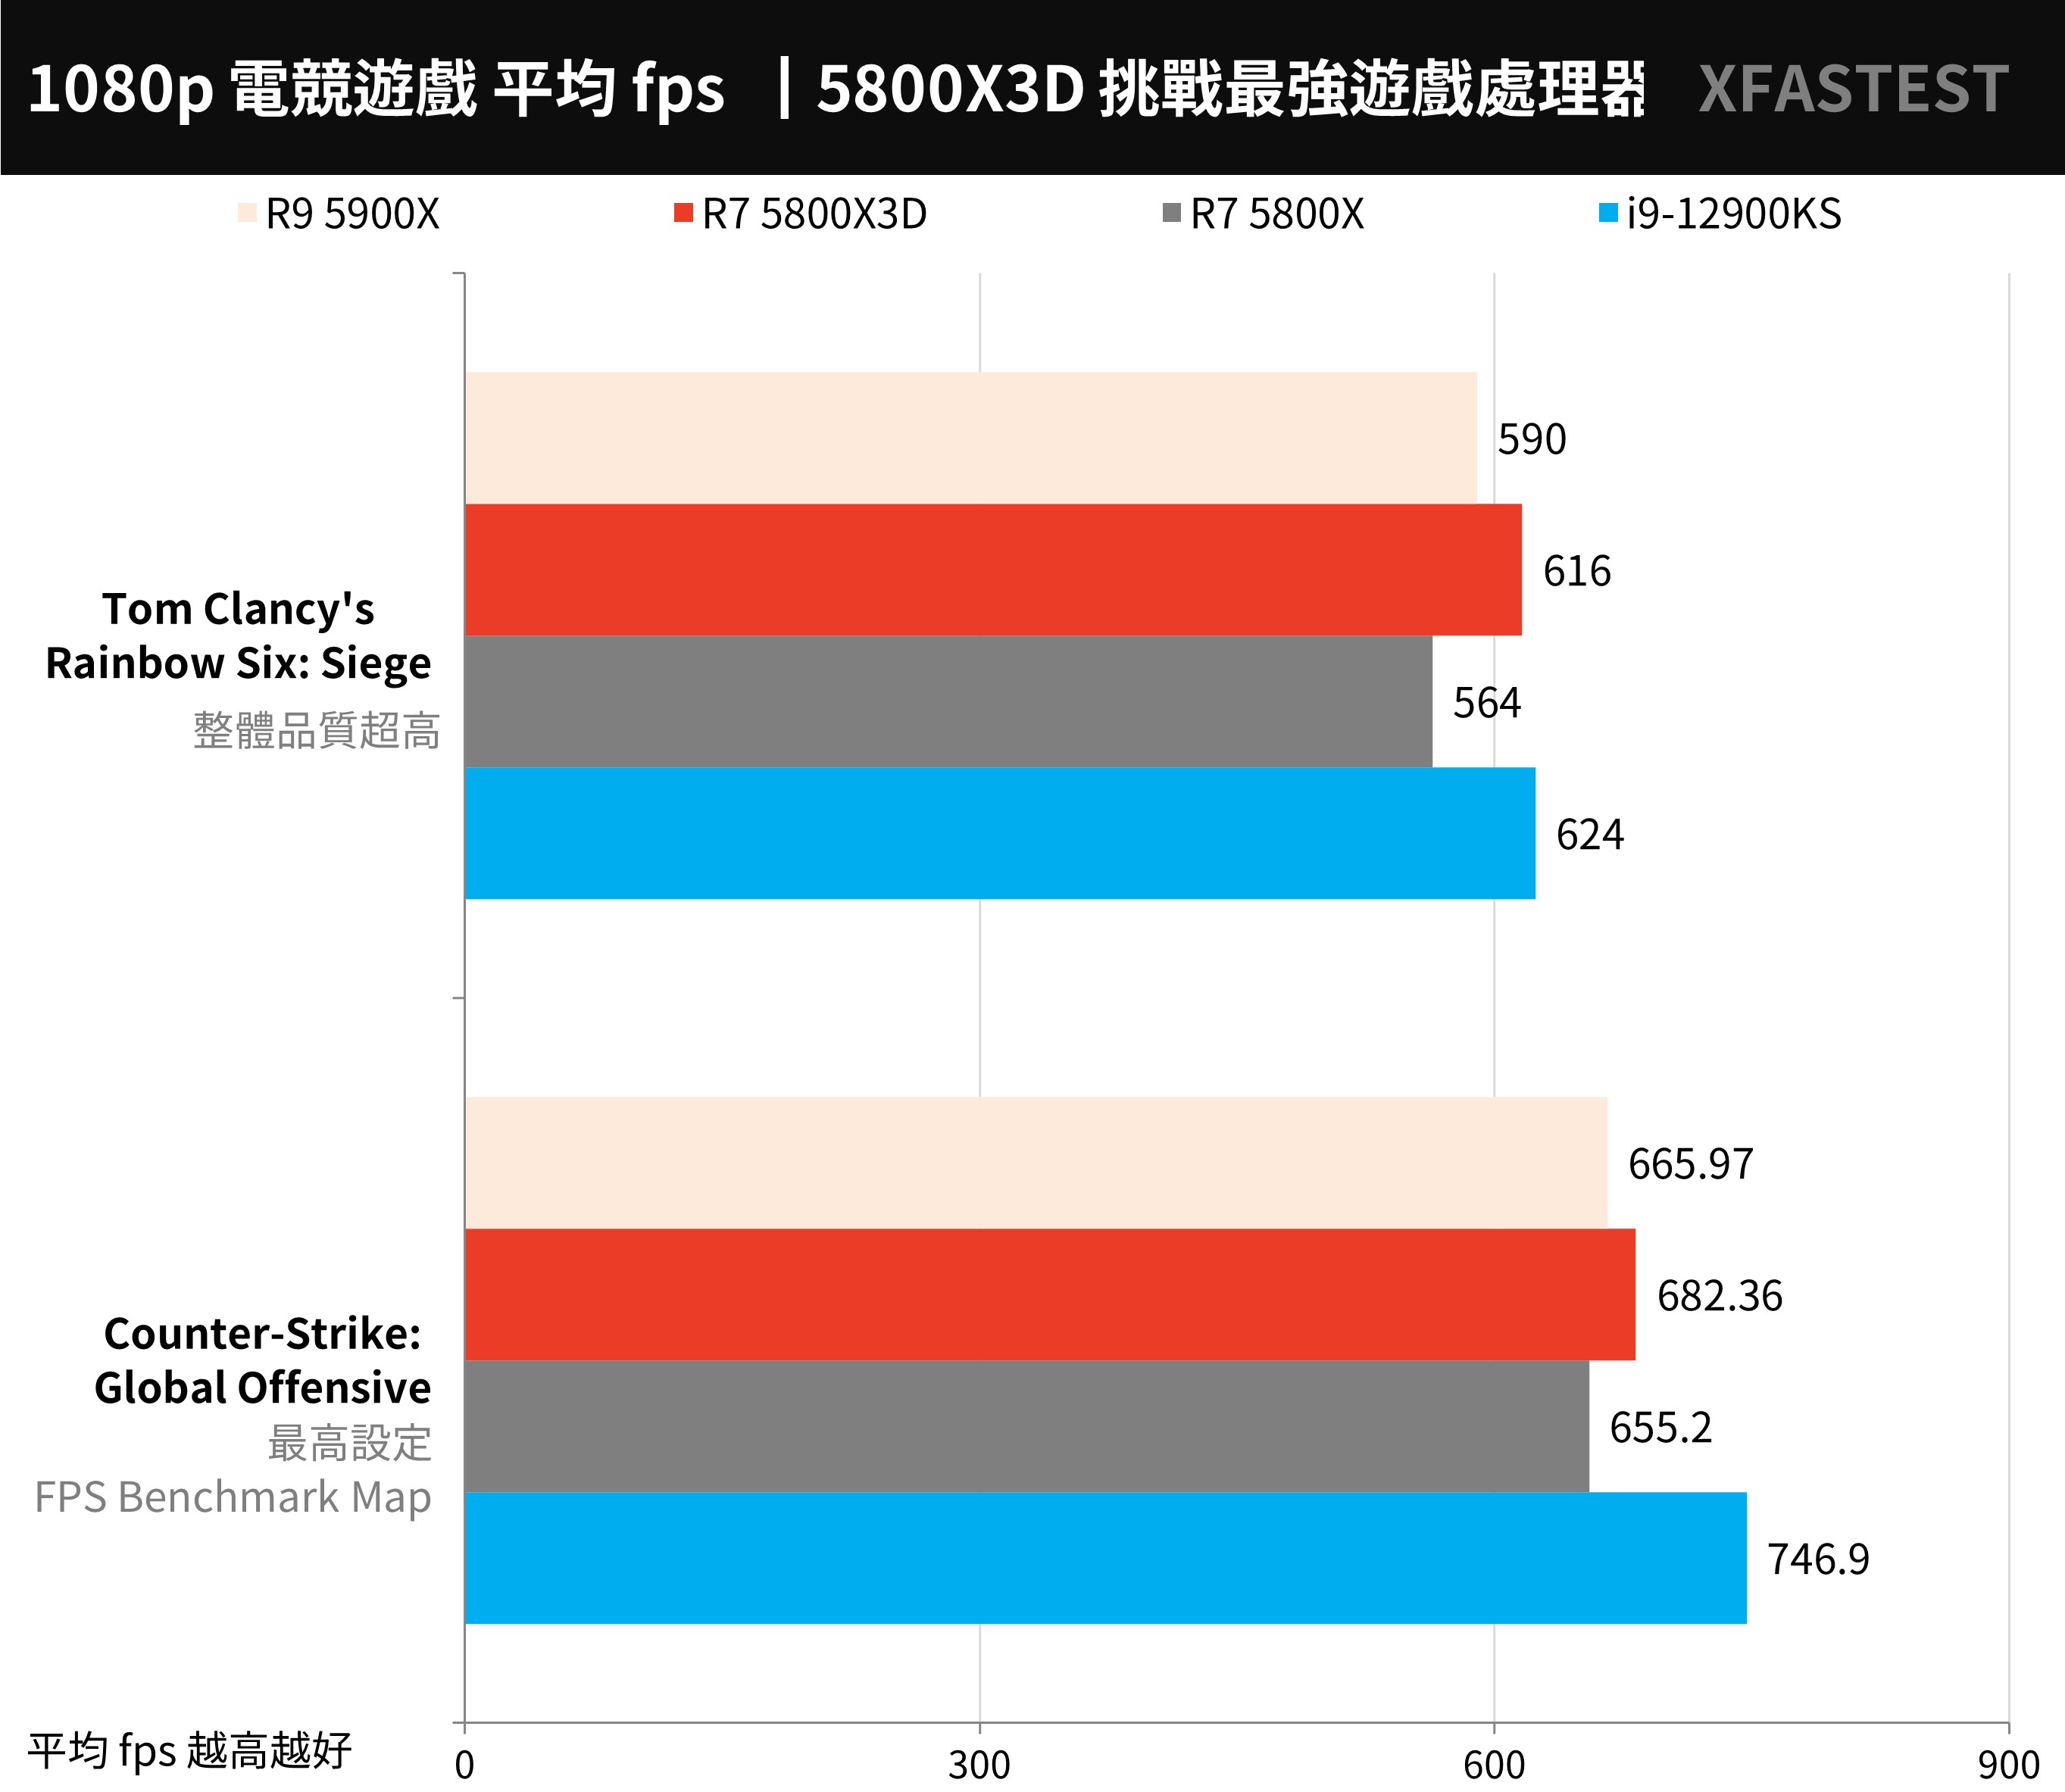
↑ The average FPS of e-sports games, the higher the better.
Game summary:After the AMD Ryzen 7 5800X3D increases the 96MB L3 cache through 3D V-Cache, it can indeed achieve a considerable improvement in game performance at 1080p resolution. The games tested are only “Assassin’s Creed: Viking Age” and “Forbidden Land” 3″ has a smaller improvement, with an overall 11% increase in game performance.
3DMark CPU performance and FS, TS benchmarks
Computer graphics game performance test tool 3DMarkthe mainstream Direct X11 test Fire Strike and Direct X12 Time Spy test.
Judging from the results, the 5800X3D scored a total score of 39371 points in Fire Strike, but the physical score was only 30448, a small loss of 5800X; as for the Time Spy test, the 5800X3D achieved a score of 17953 points and a CPU score of 11874 points.
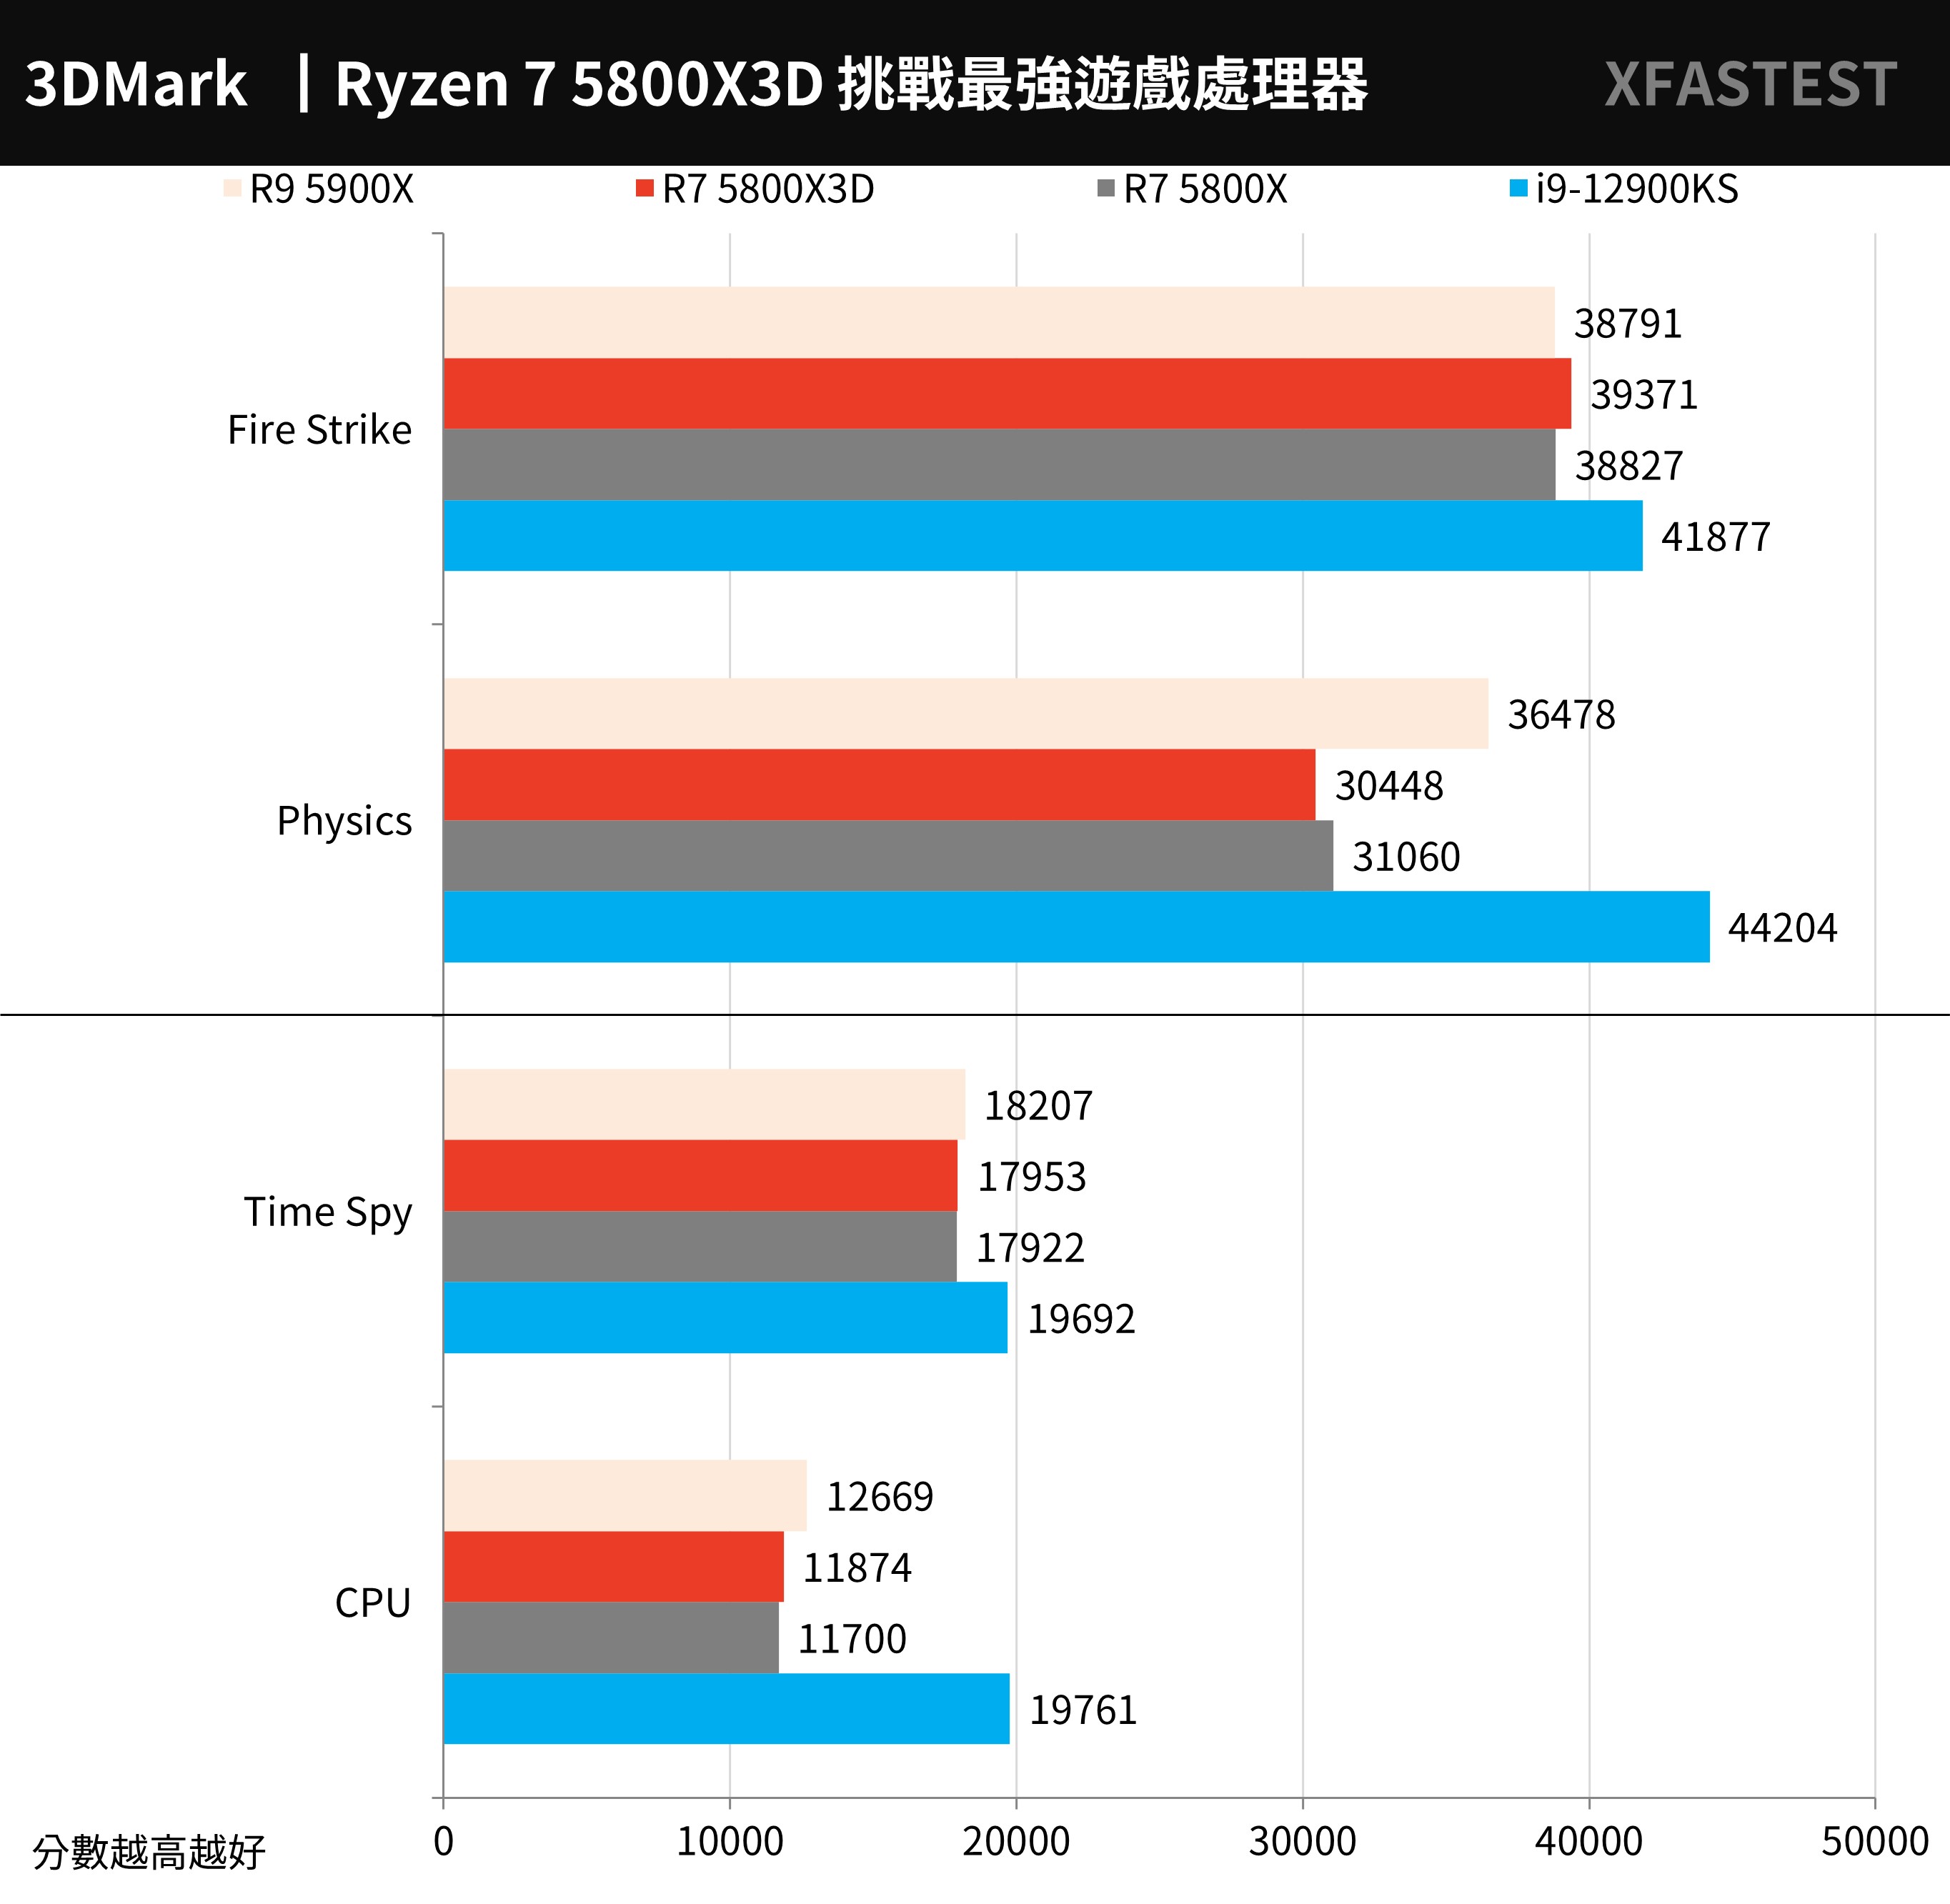
↑ 3DMark, the higher the score, the better.
3DMark CPU The test mainly tests the physical operation and custom simulation of the CPU, and tests the performance of 1, 2, 4, 8, 16 and the maximum thread of the processor respectively, and the performance of more than 16 threads will belong to 3D rendering, Audio and video output will be used. Generally, Direct X12 games prefer 8T threads, and the following threads are the preferences of old games.
The 5800X3D can use the larger L3 cache to allow the GPU to obtain more data to accelerate the game performance, but in terms of CPU physics and operations, the 5800X has stronger performance.
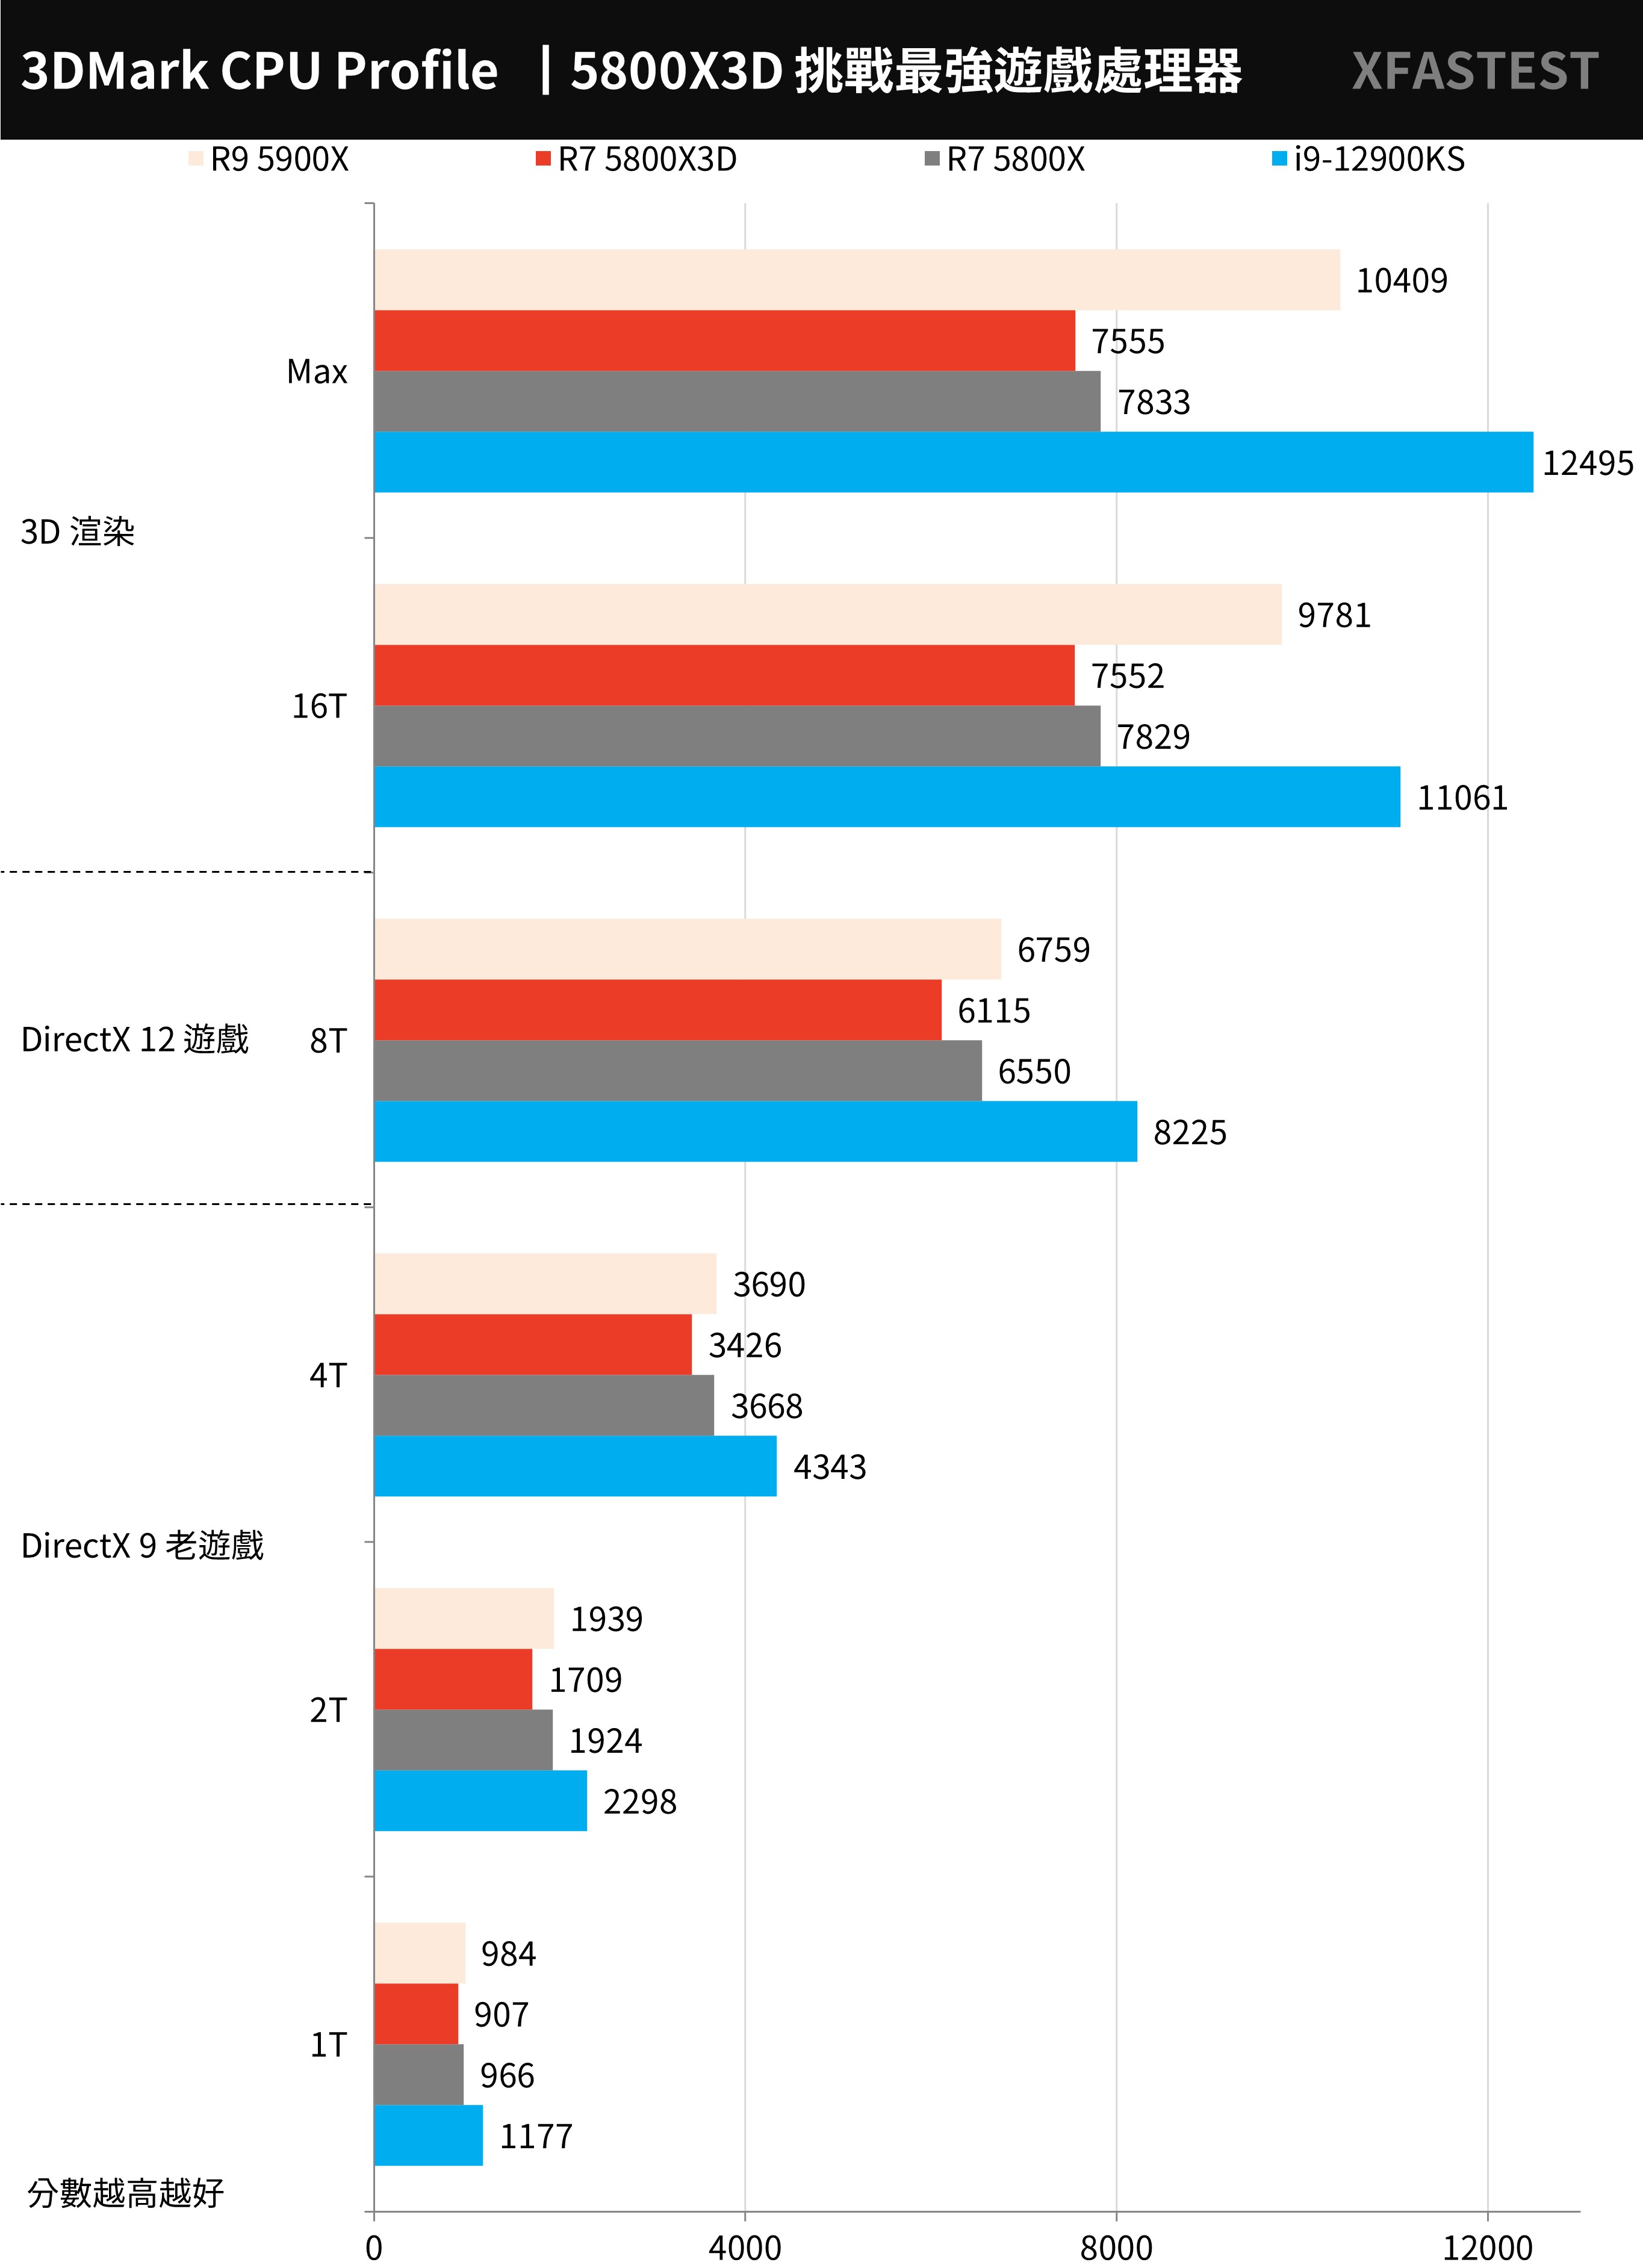
↑ 3DMark CPU, the higher the score, the better.
CPU-Z processor performance Cinebench, VRay rendering test
first CPU-Z In the CPU performance test, the 5800X3D scored 6512 points in the multi-thread test and 618.1 points in the single-thread test. The performance was slightly lost to the 5800X. After all, the default and Boost clocks were much lower.
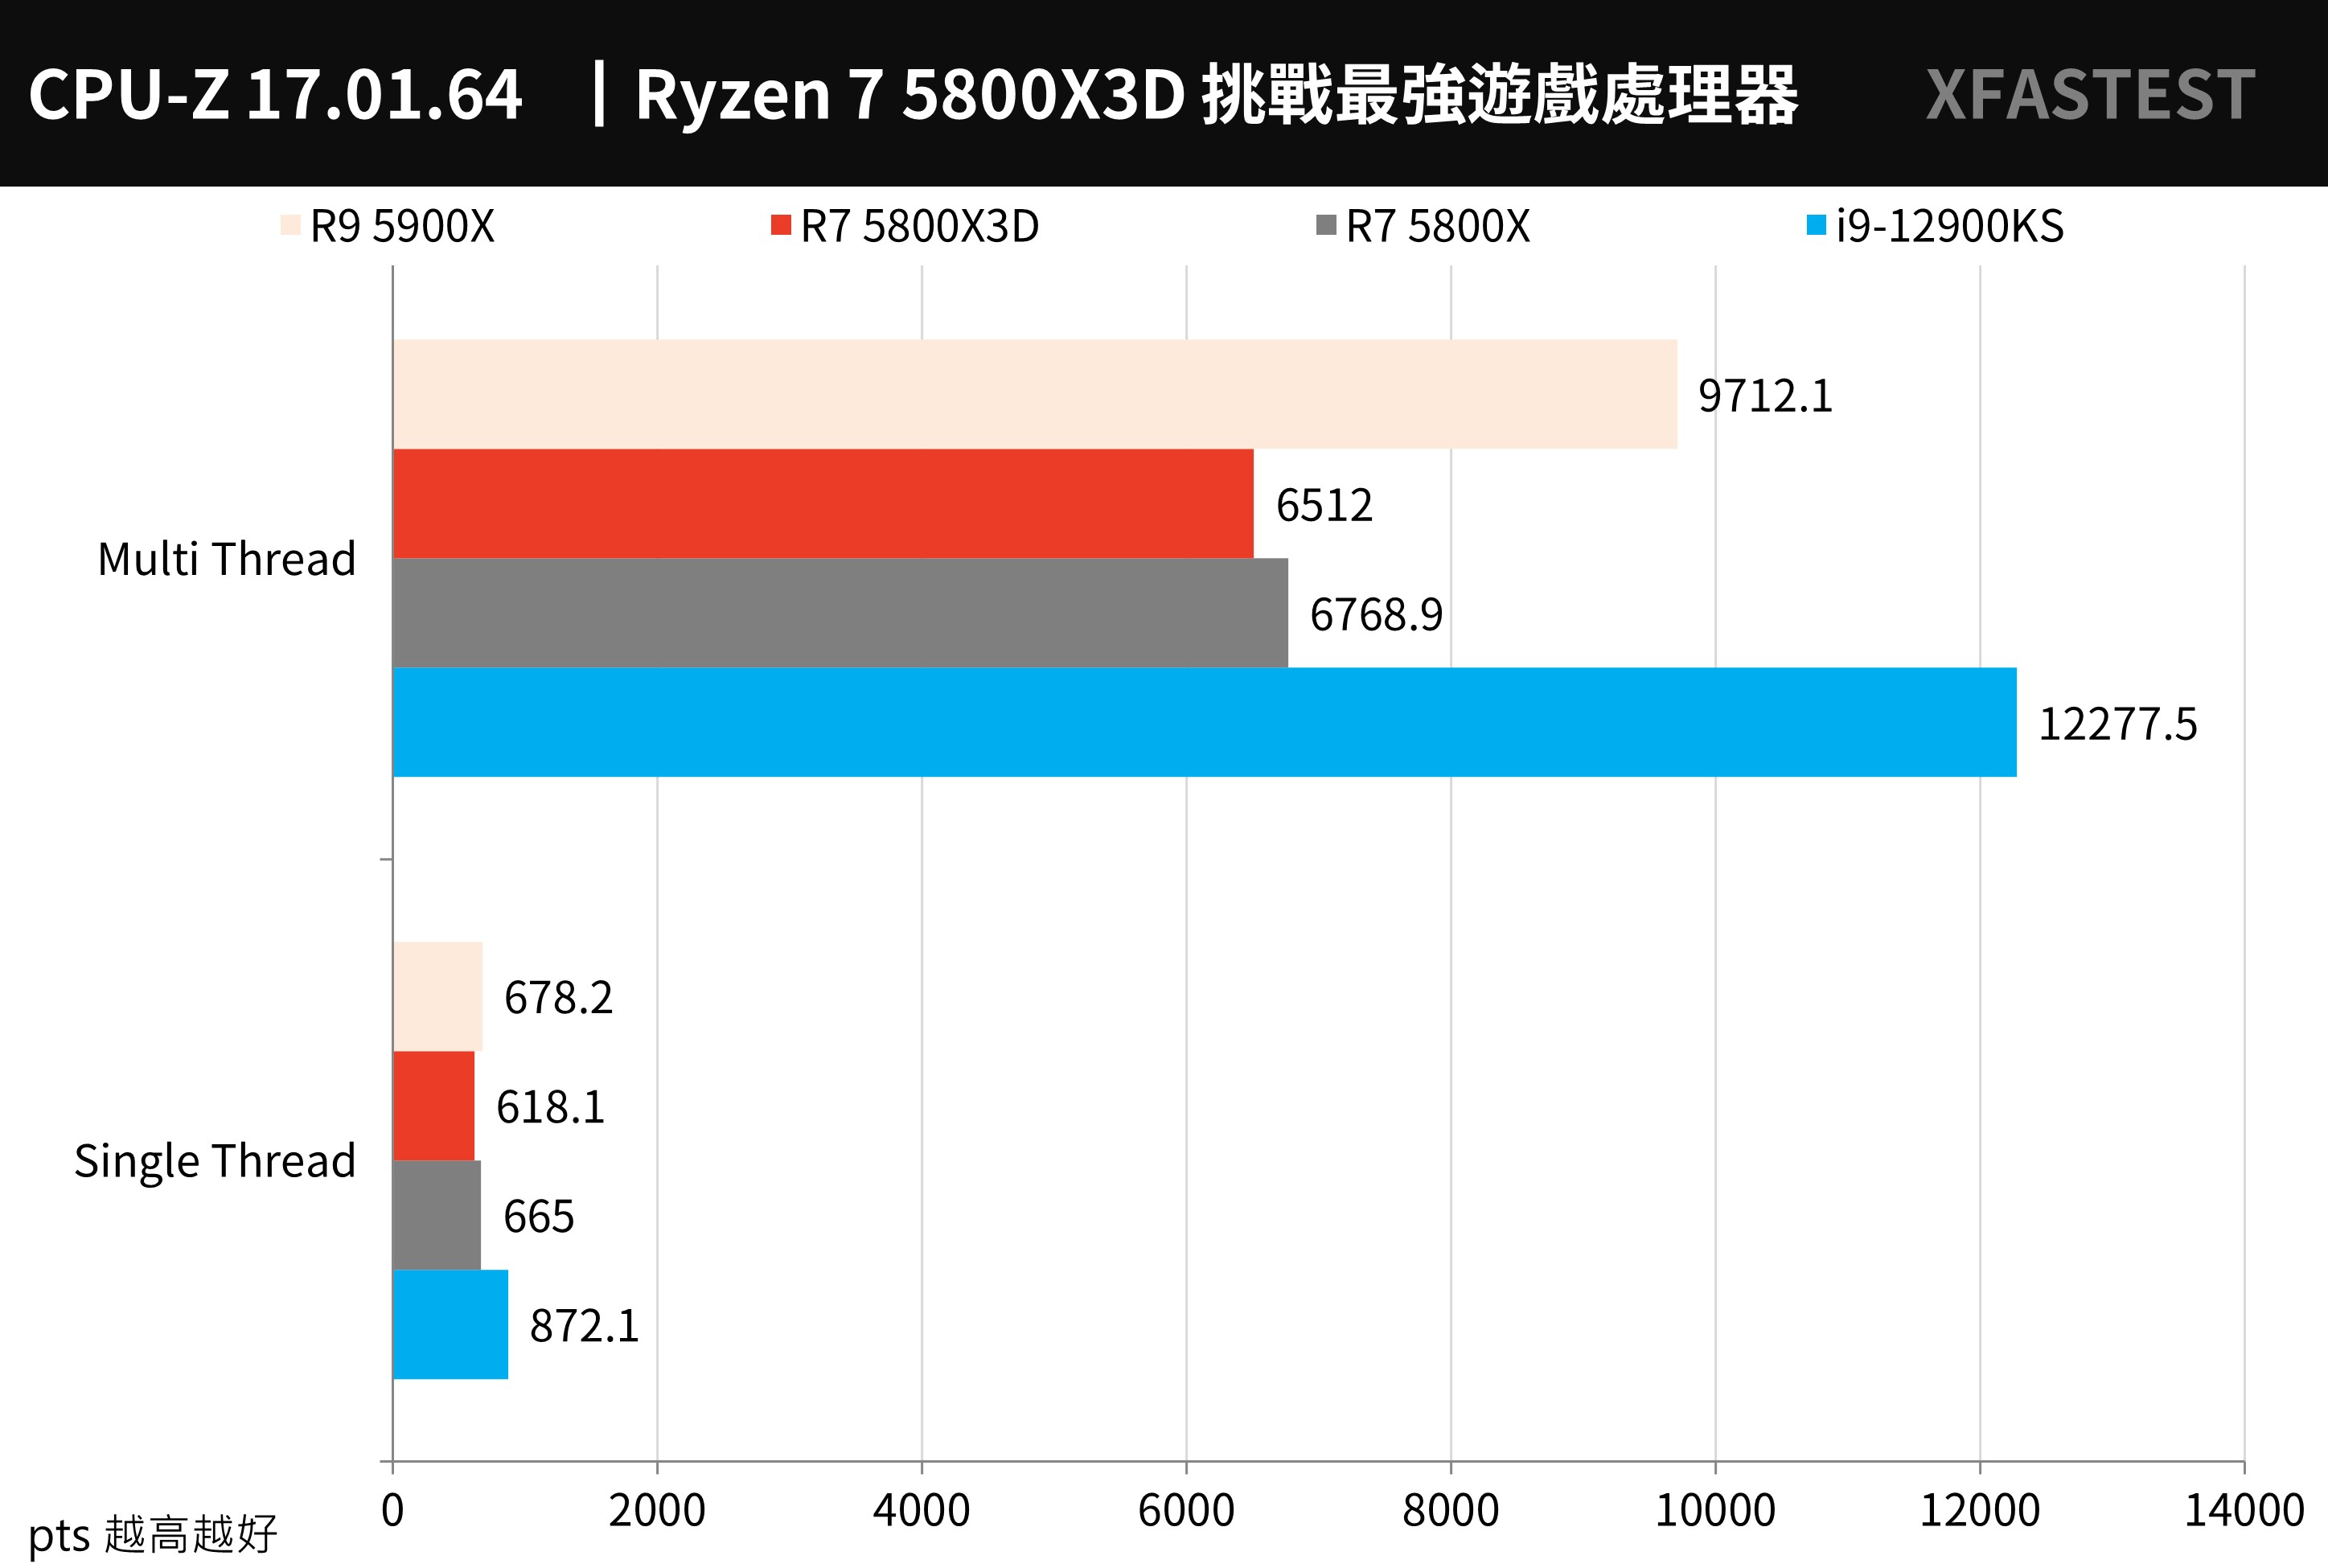
↑ CPU-Z, the higher the performance, the better.
CINEBENCH R20developed by MAXON based on Cinema 4D, can be used to evaluate the 3D rendering performance of computer processors.
The 5800X3D scored 5810 PTS in the multi-core test and 581 PTS in the single-core test.
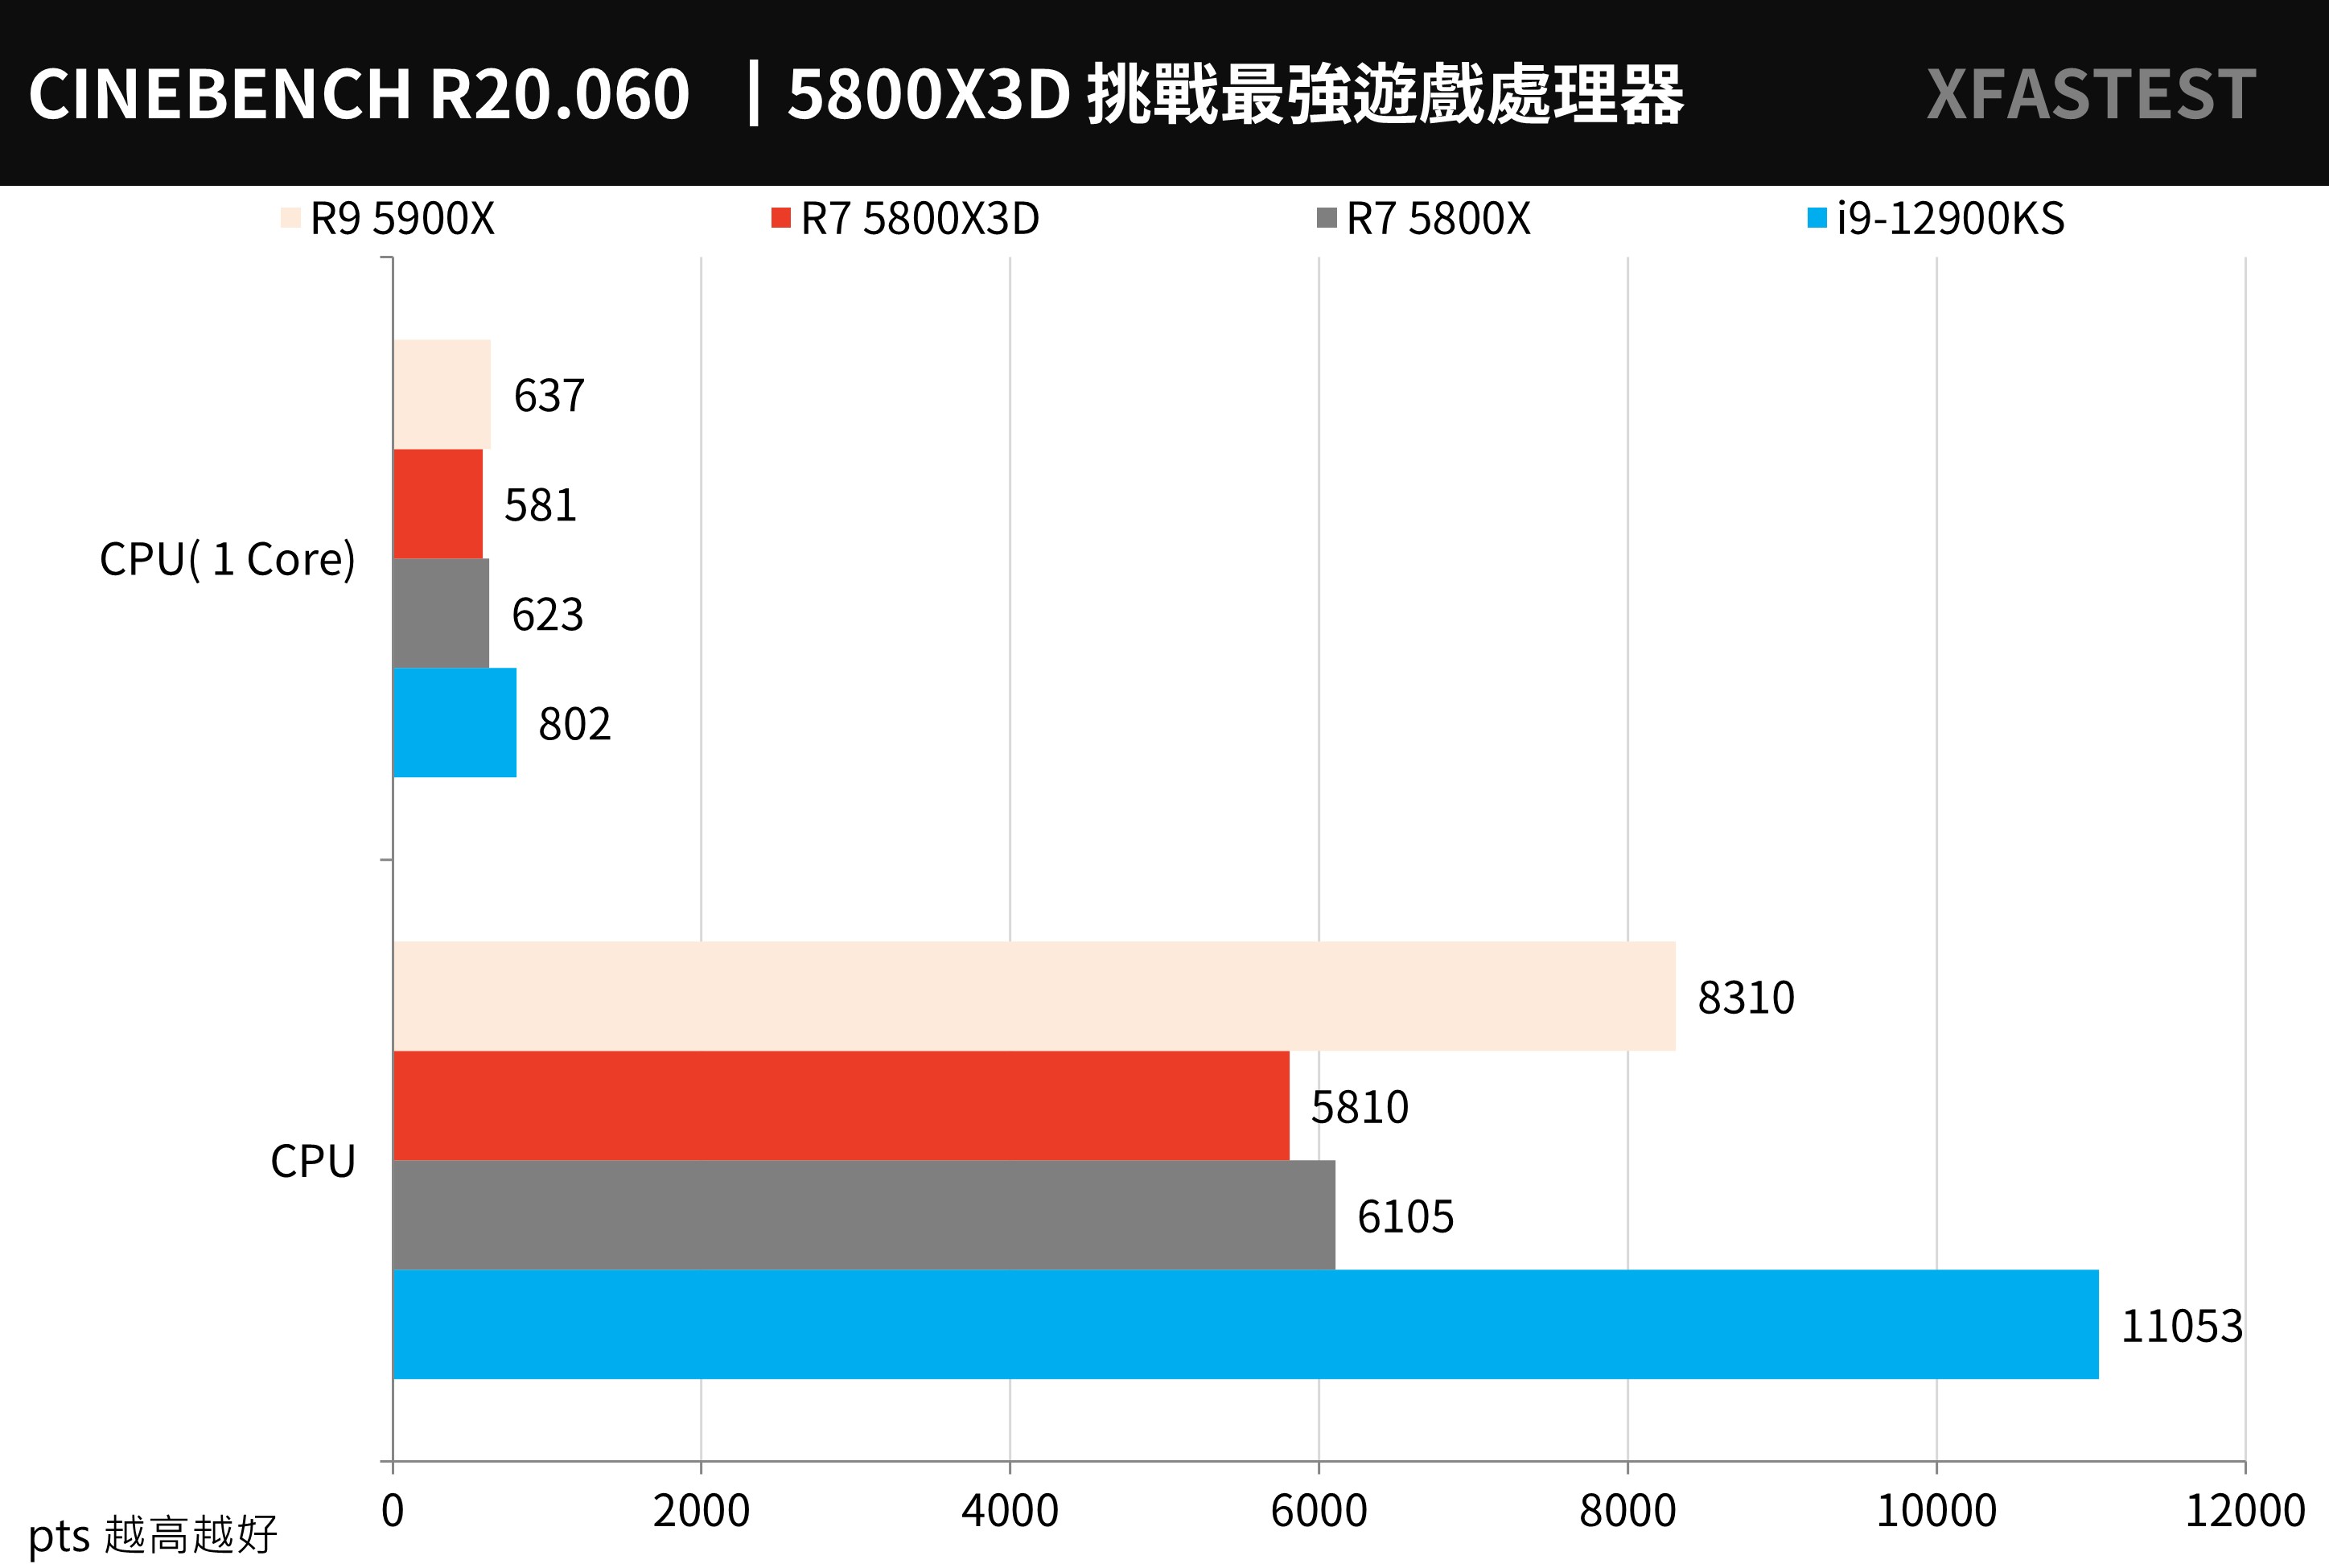
↑ CINEBENCH R20, the higher the better.
CINEBENCH R23 The same as the R20 test scenario, it uses a new compiler and has a stress test function. Players can customize the Minimum Test Duration time, such as 10 or 30 minutes to test the stability of the computer; however, the results of R23 cannot be compared with R20.
The 5800X3D multi-core achieves 15005 PTS and single-core 1489 PTS.
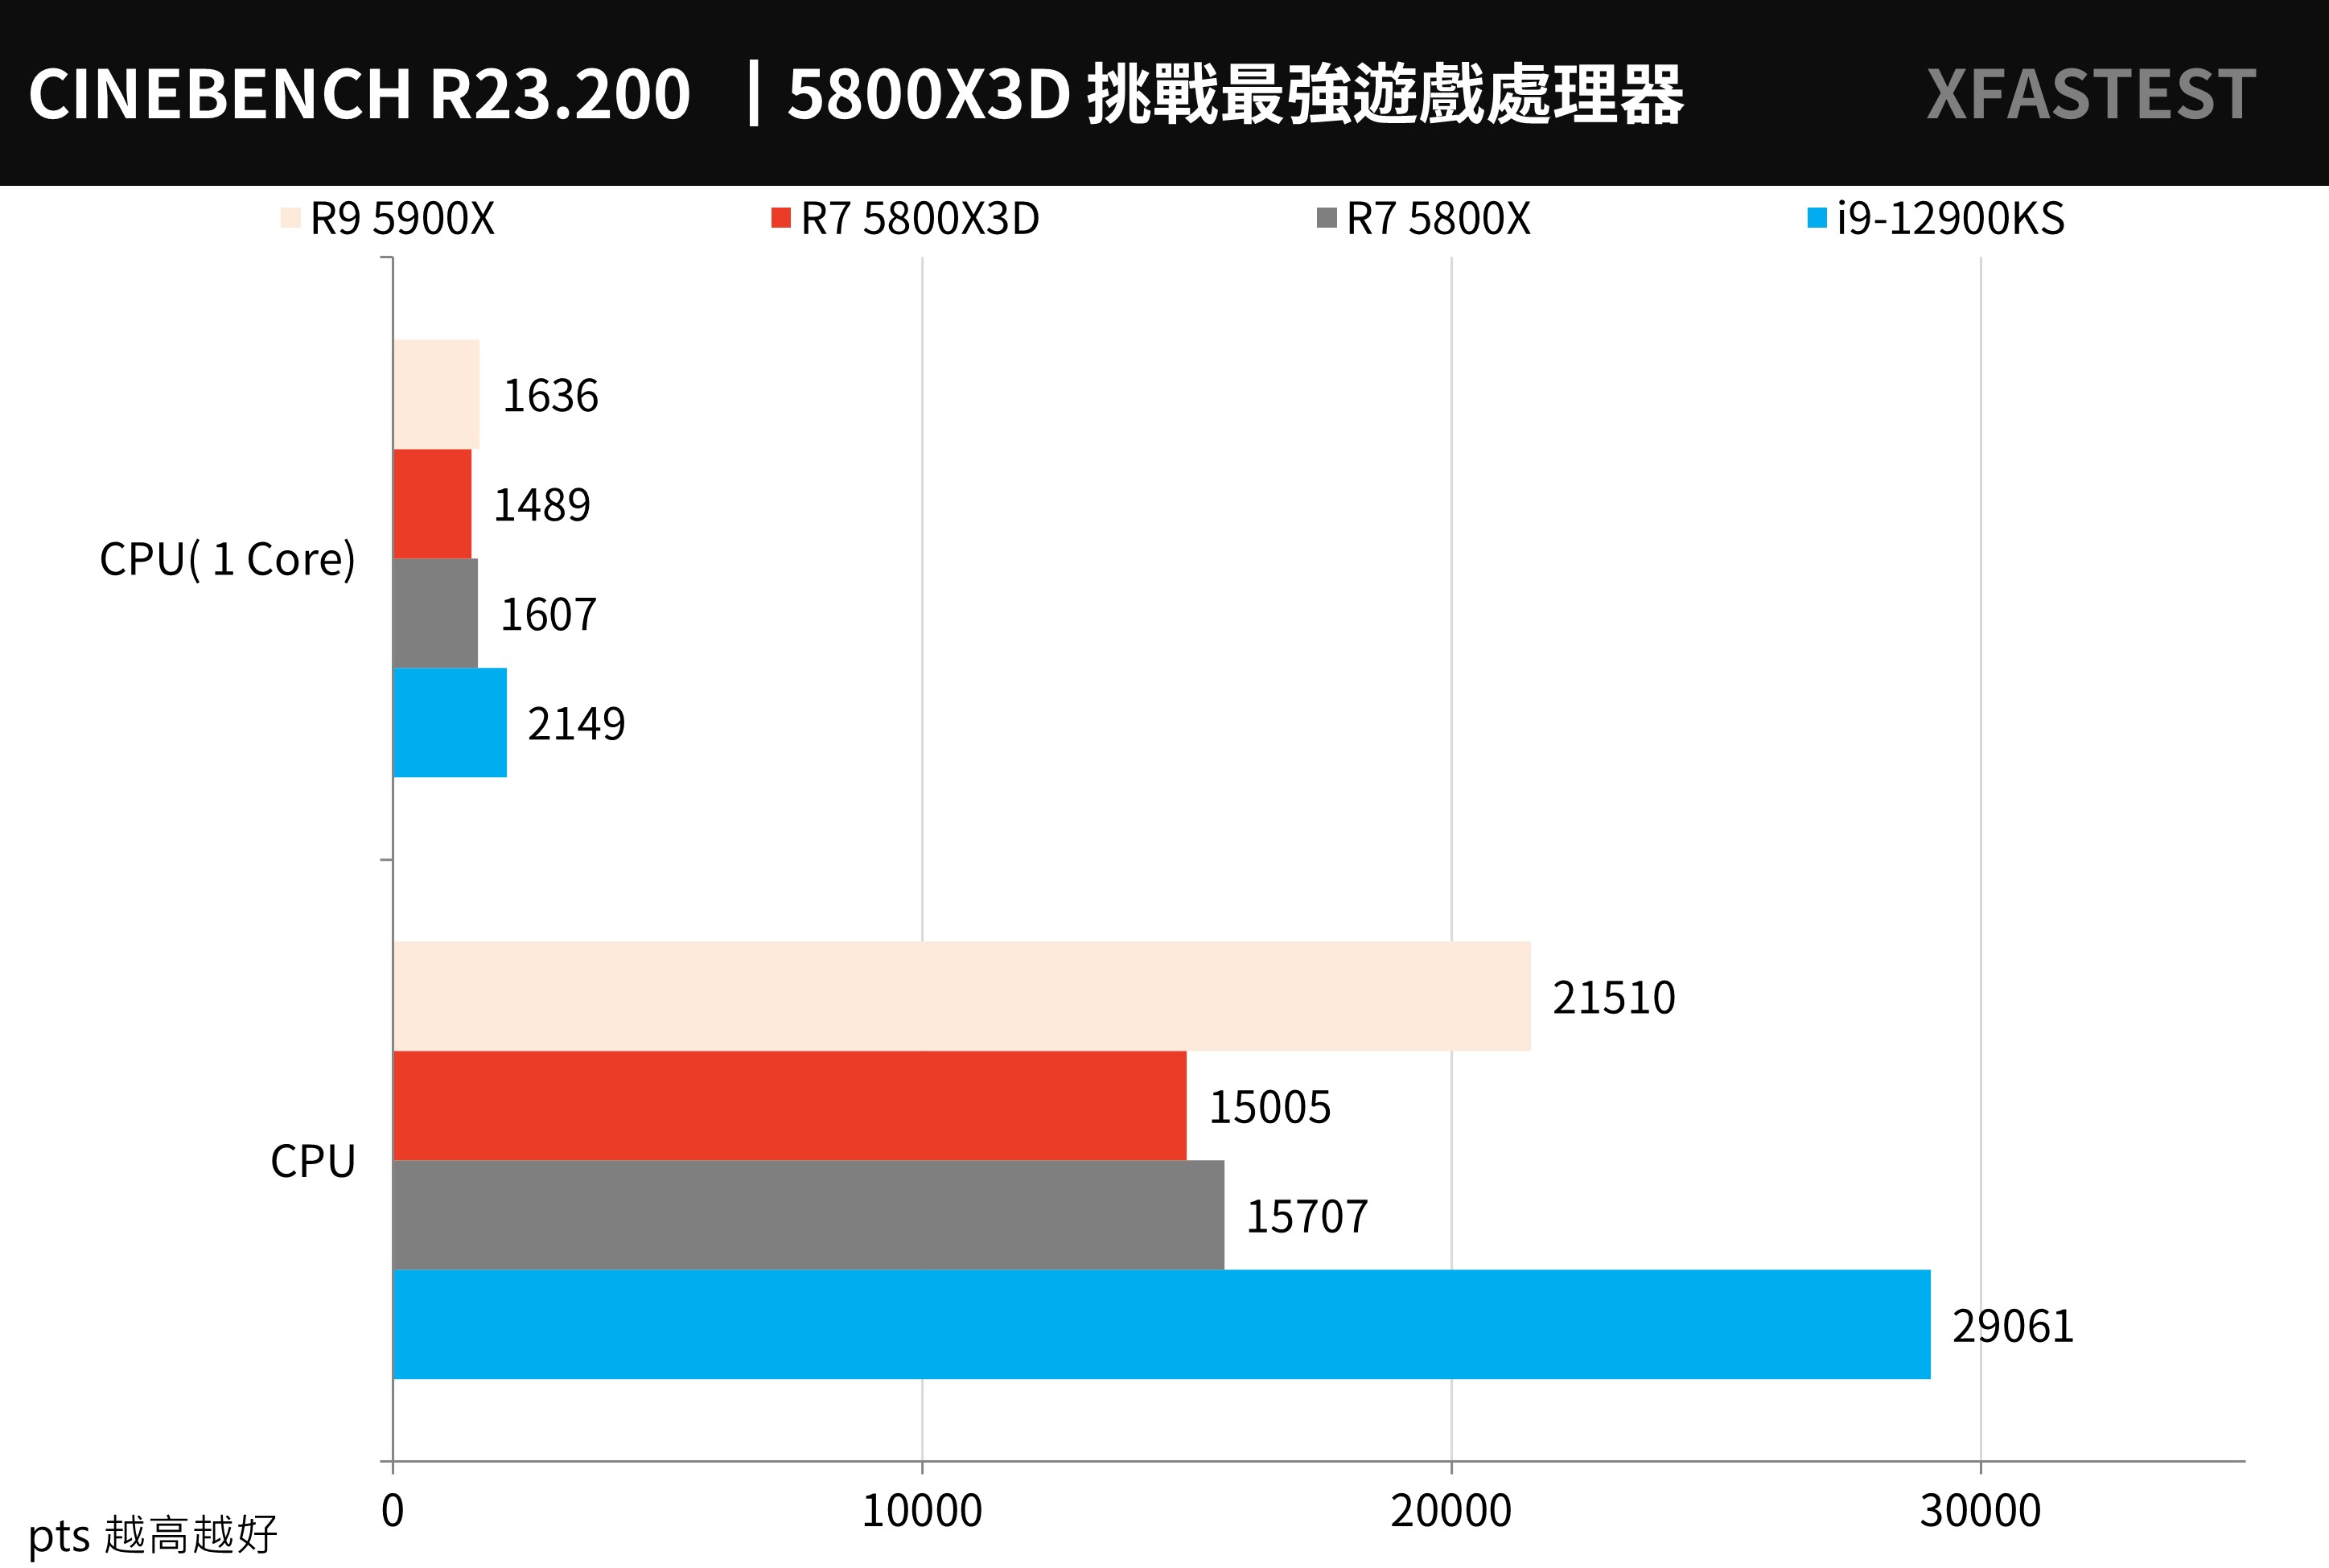
↑ CINEBENCH R23, the higher the better.
Corona Benchmark It is a fairly easy-to-operate testing tool. Corona Renderer 1.3 is used for testing, and the rendering speed of the processor is compared with the performance of Rays/s. The score is measured in seconds.
The 5800X3D finished rendering in 1 minute and 23 seconds, which is 1 second faster than the 5800X.
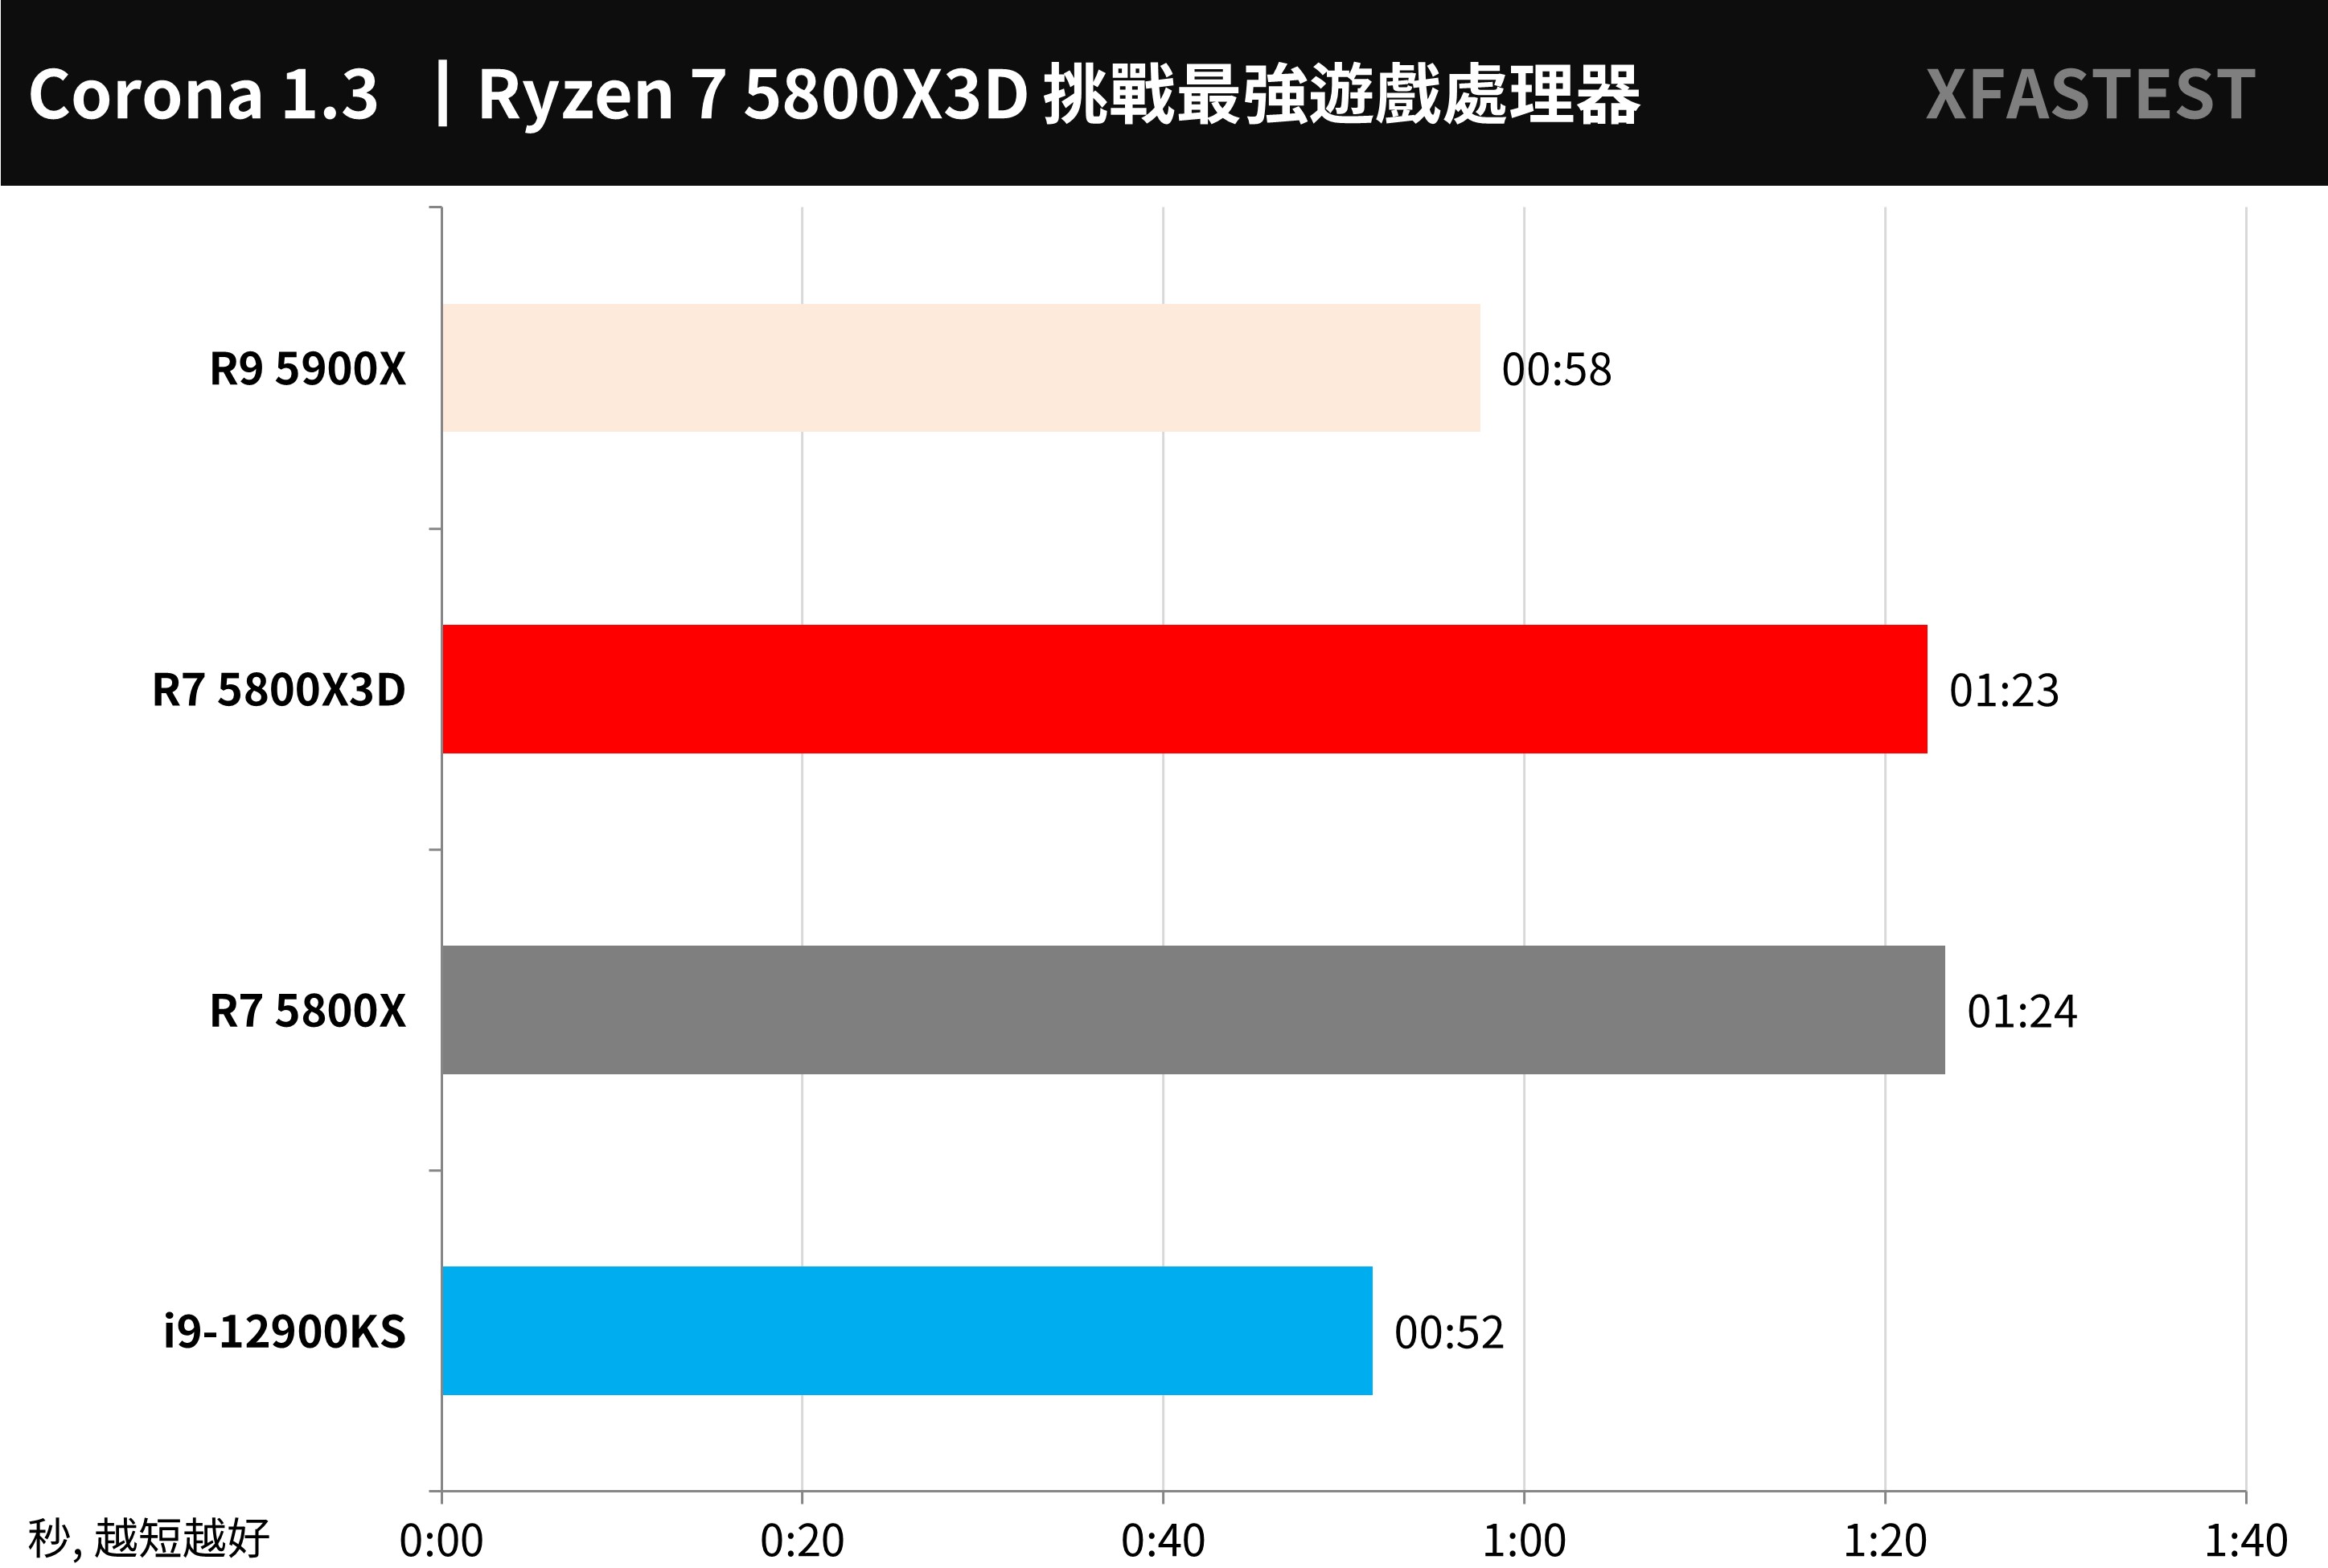
↑ Corona Benchmark, the less time the better.
V-Ray Benchmark Developed by Chaos Group, V-Ray is a ray rendering software designed based on the laws of physics, and this tool can perform computational performance test of ray-traced rendered images for the CPU. The CPU score is calculated in units of vsamples per second.
5800X3D gets 11486 computing performance.
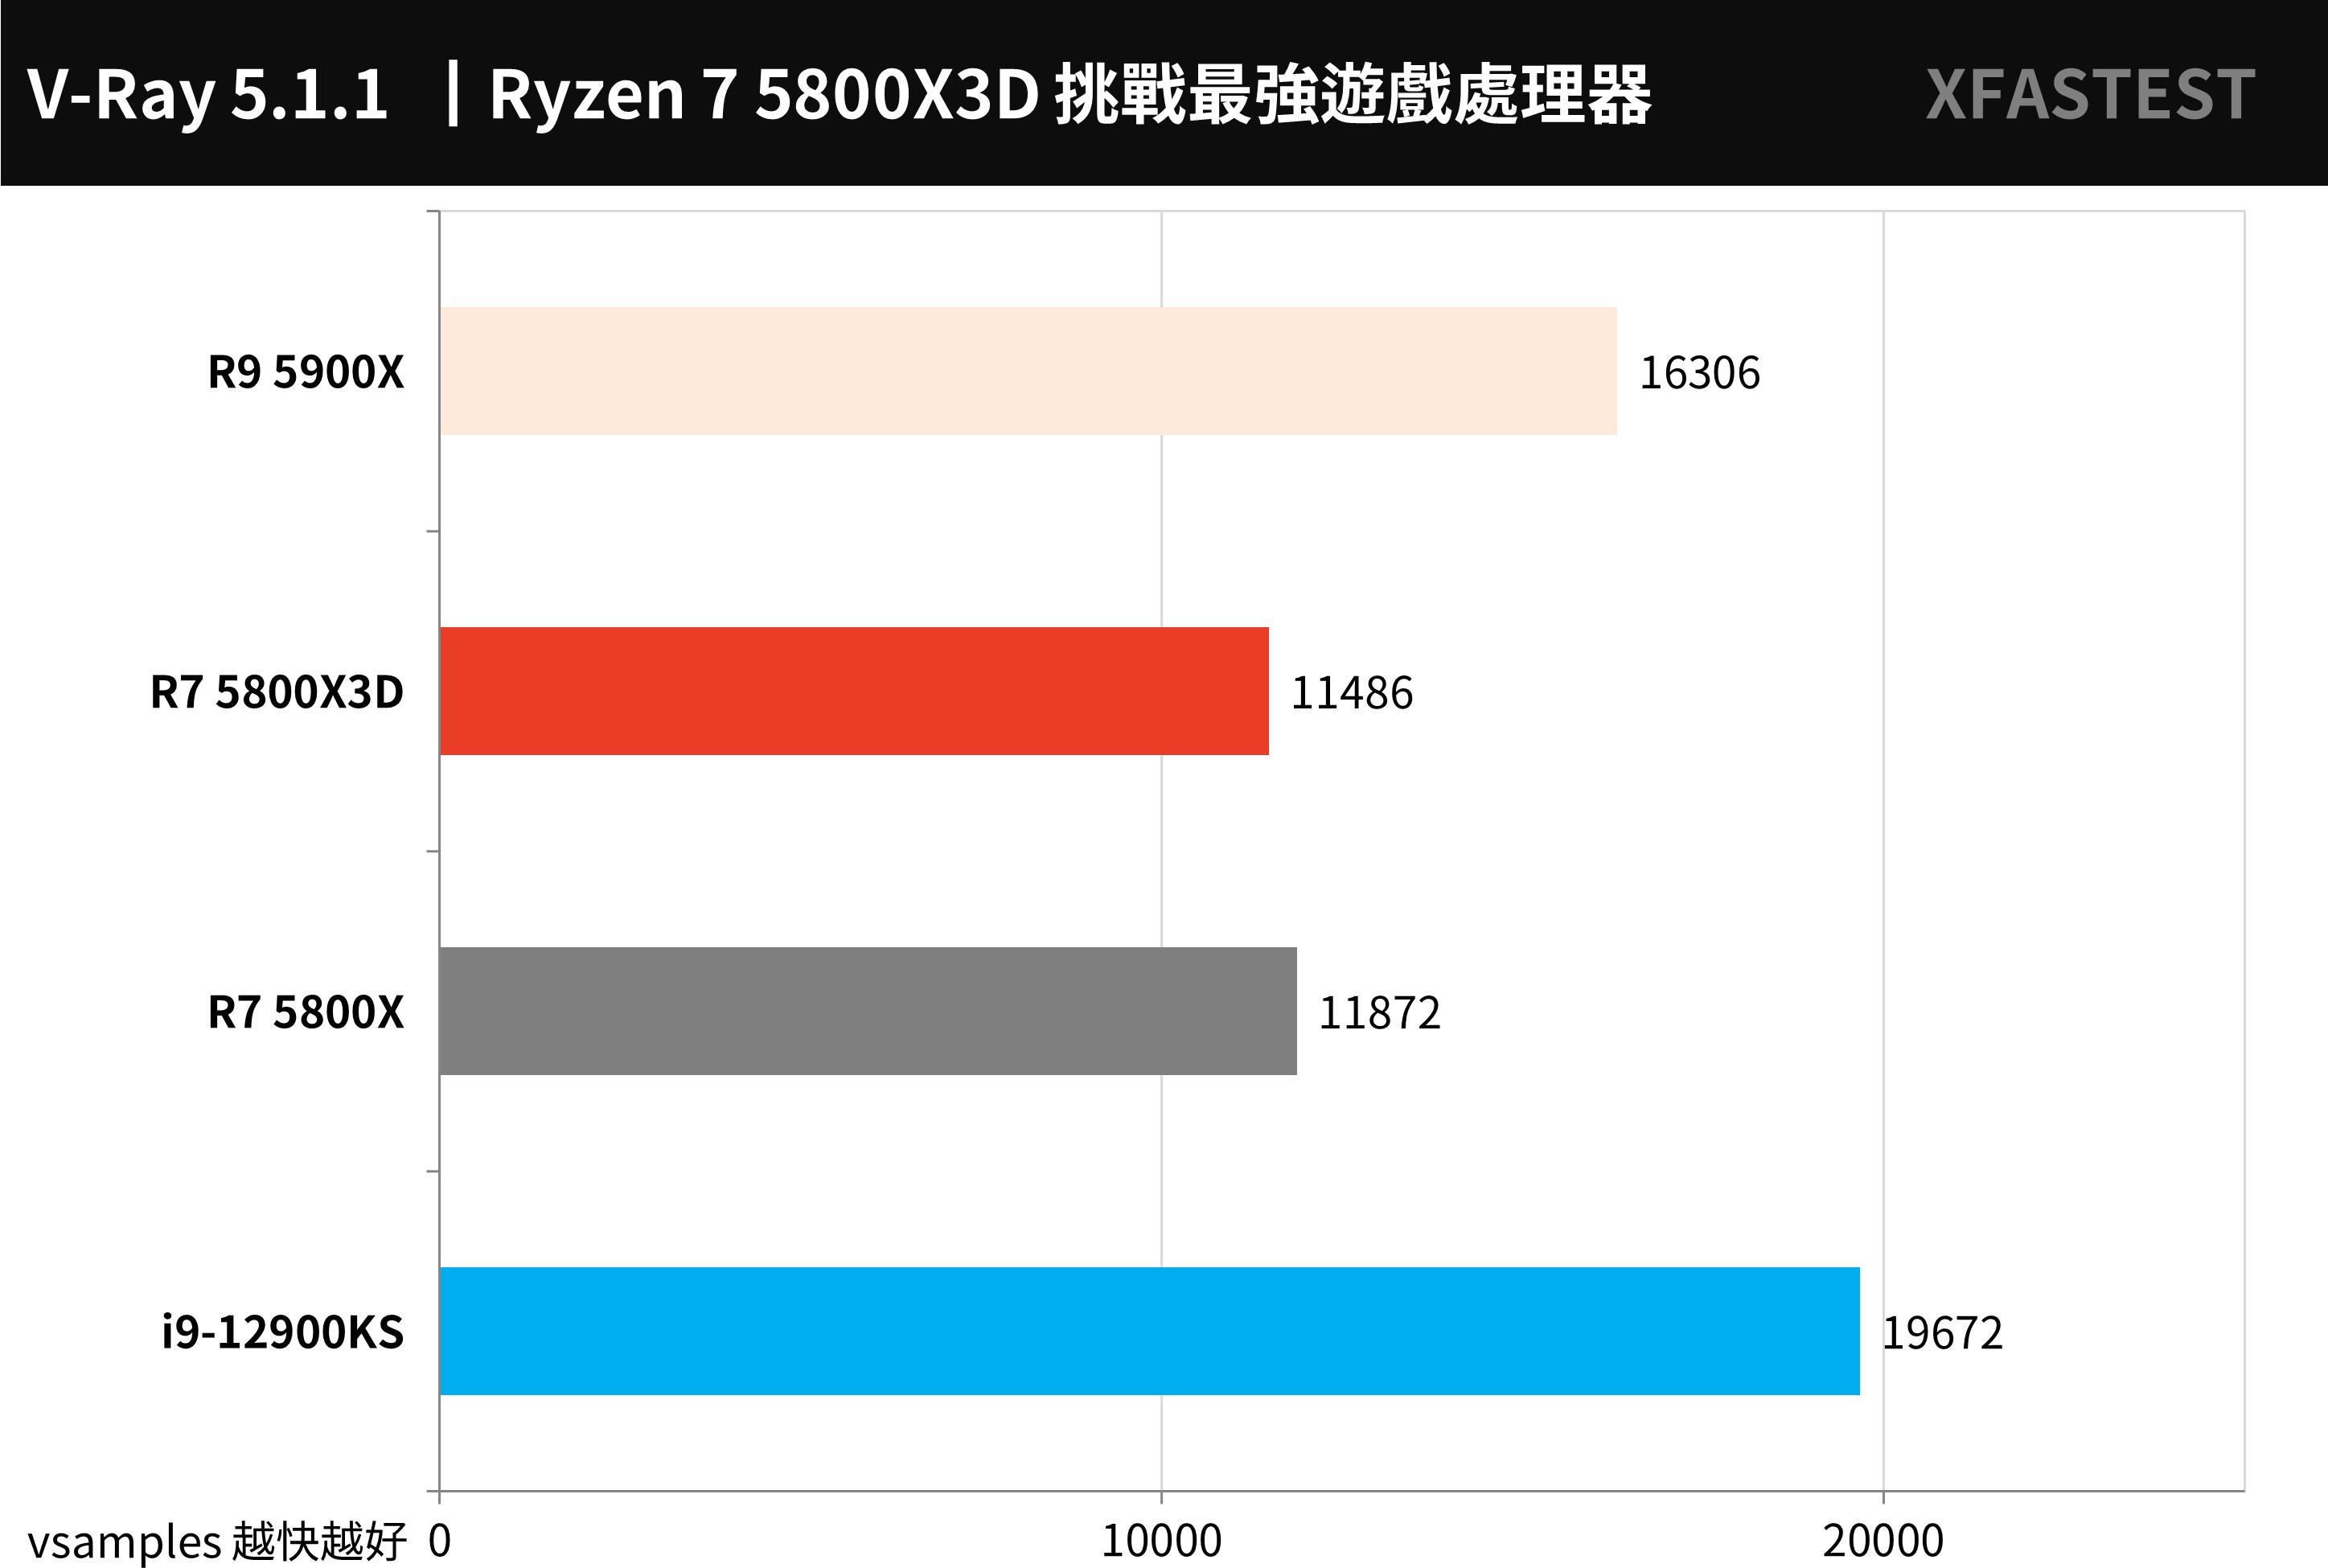
↑ V-Ray Benchmark, the sooner the better.
POV-Ray It is another set of free ray tracing 3D rendering tools, which uses the computing power of multi-core CPU to calculate the rendering of light and shadow and 3D images.
The 5800X3D multi-core achieves a processing performance of 5254.12 PPS.
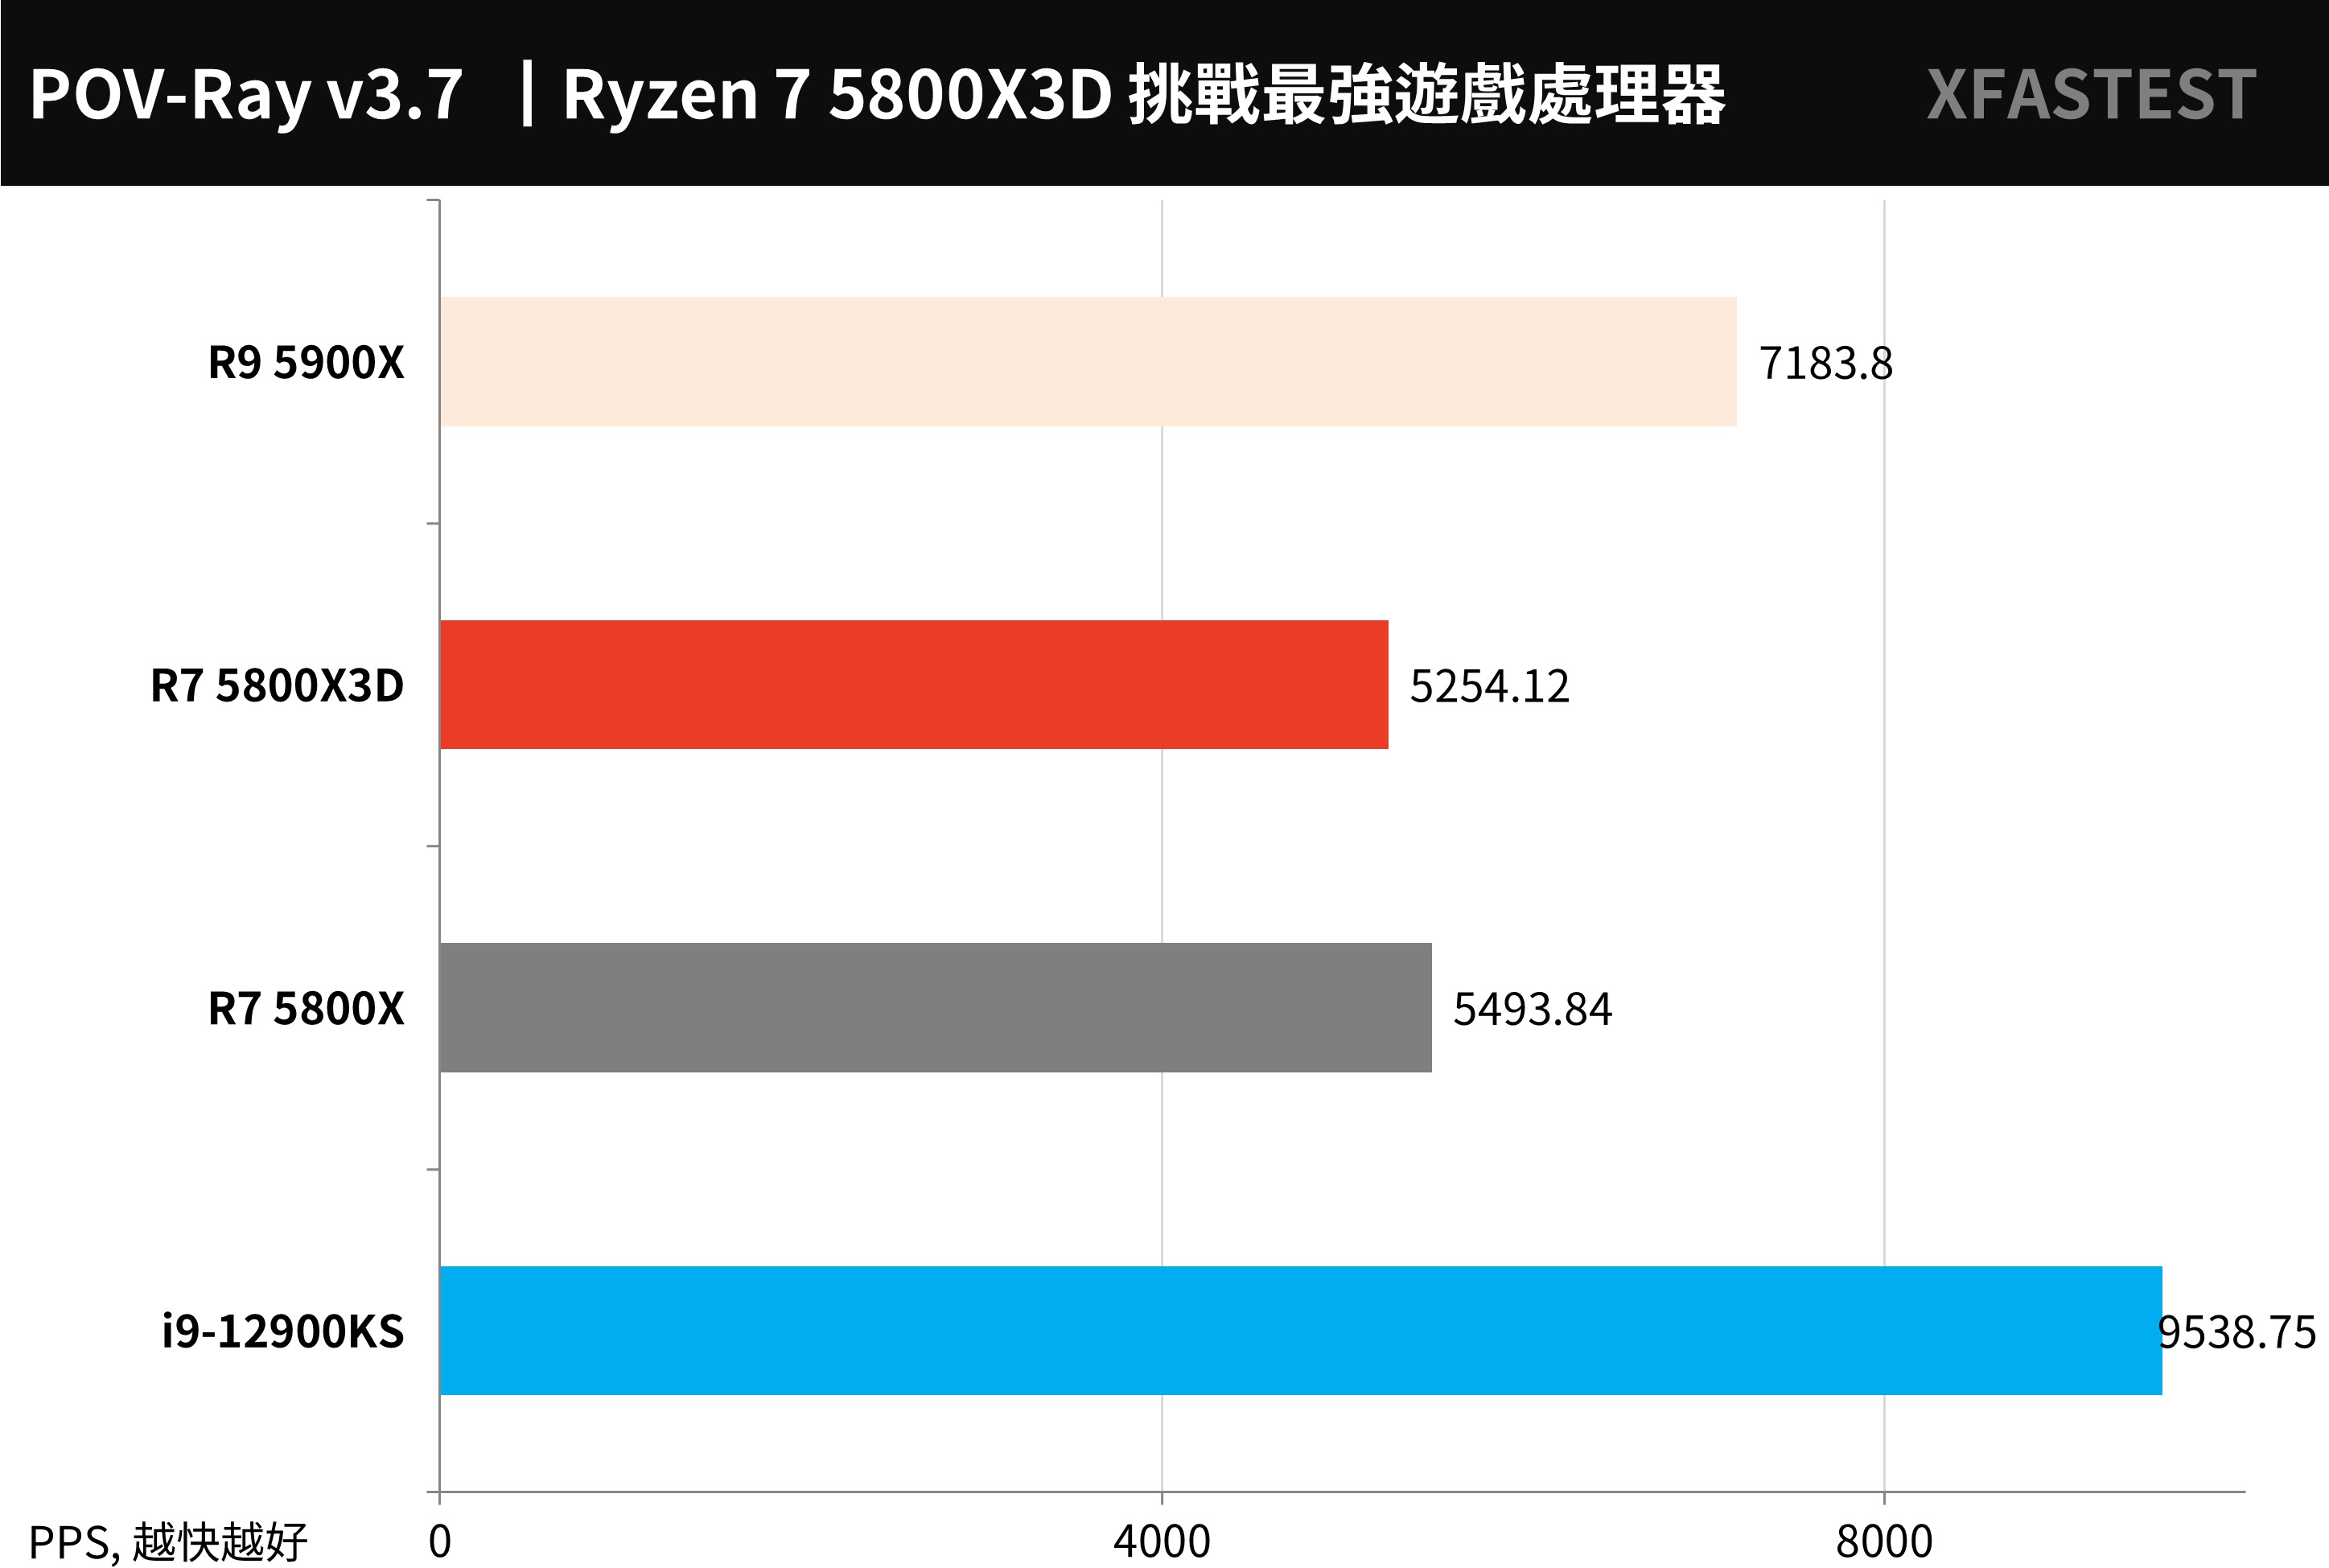
↑ POV-Ray, the higher the better.
Blender It is a cross-platform, open source 3D authoring tool that supports various 3D operations: Modeling, Rigging, Animation, Simulation, Rendering, Compositing and Motion Tracking. For the test, use Blender Benchmark 3.1.0 to test the rendering work of the Demo project.
The test result is the number of samples per minute, the higher the performance, the better, the relative computing performance of 5800X3D is lower.
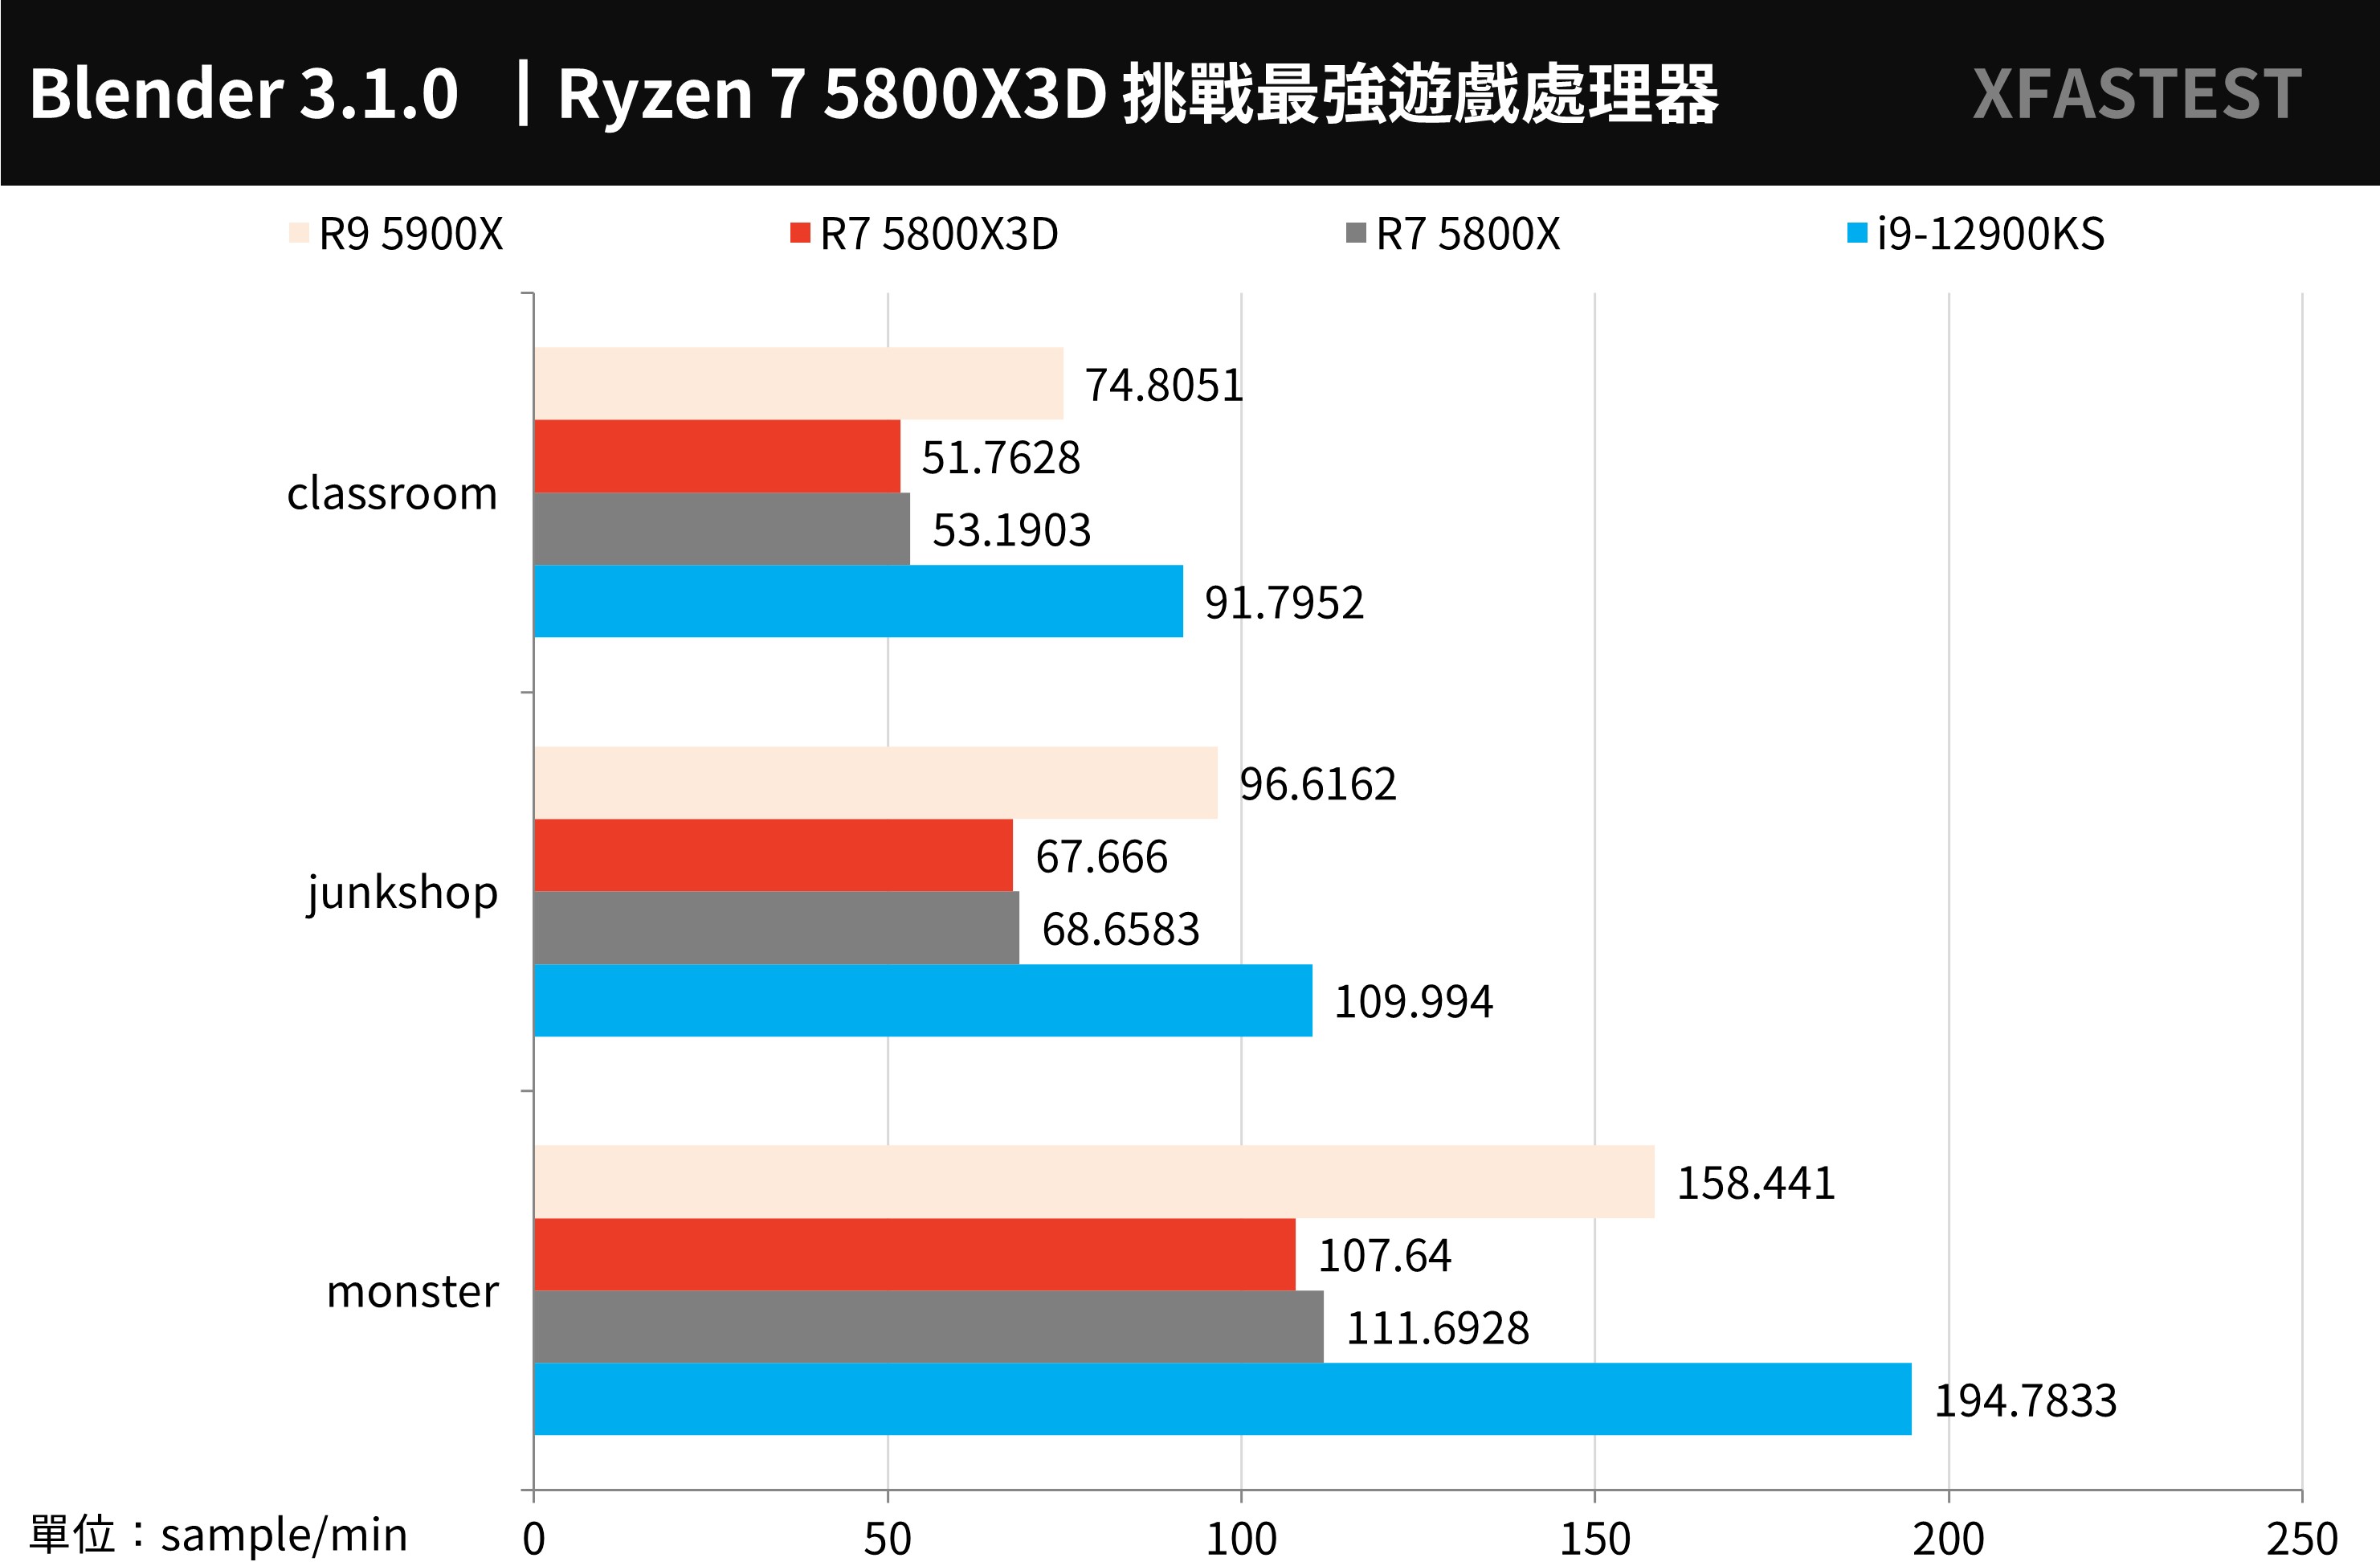
↑ Blender, the higher the performance, the better.
Creative PR image output, LR and PS photo editing performance test
For the conversion output test of Adobe Premiere Pro 2020, this time using UL Procyon Video Editing Benchmark Test tool, the test scenario is to use 2160p 30/60 FPS video, output H.264 – YouTube 1080p Full HD and HEVC (H.265) – 4K UHD format, and compare the output performance of pure CPU output and adding GPU acceleration .
In the case of using the same RTX 3080 Ti graphics card, this result can clearly reflect the performance of different CPUs for audio and video conversion output, but the mainstream audio and video output is mainly based on the mixed operation of CPU + GPU.
In terms of performance, the 5800X3D achieves 6578 points, but it is still a small loss compared to the 5800X.
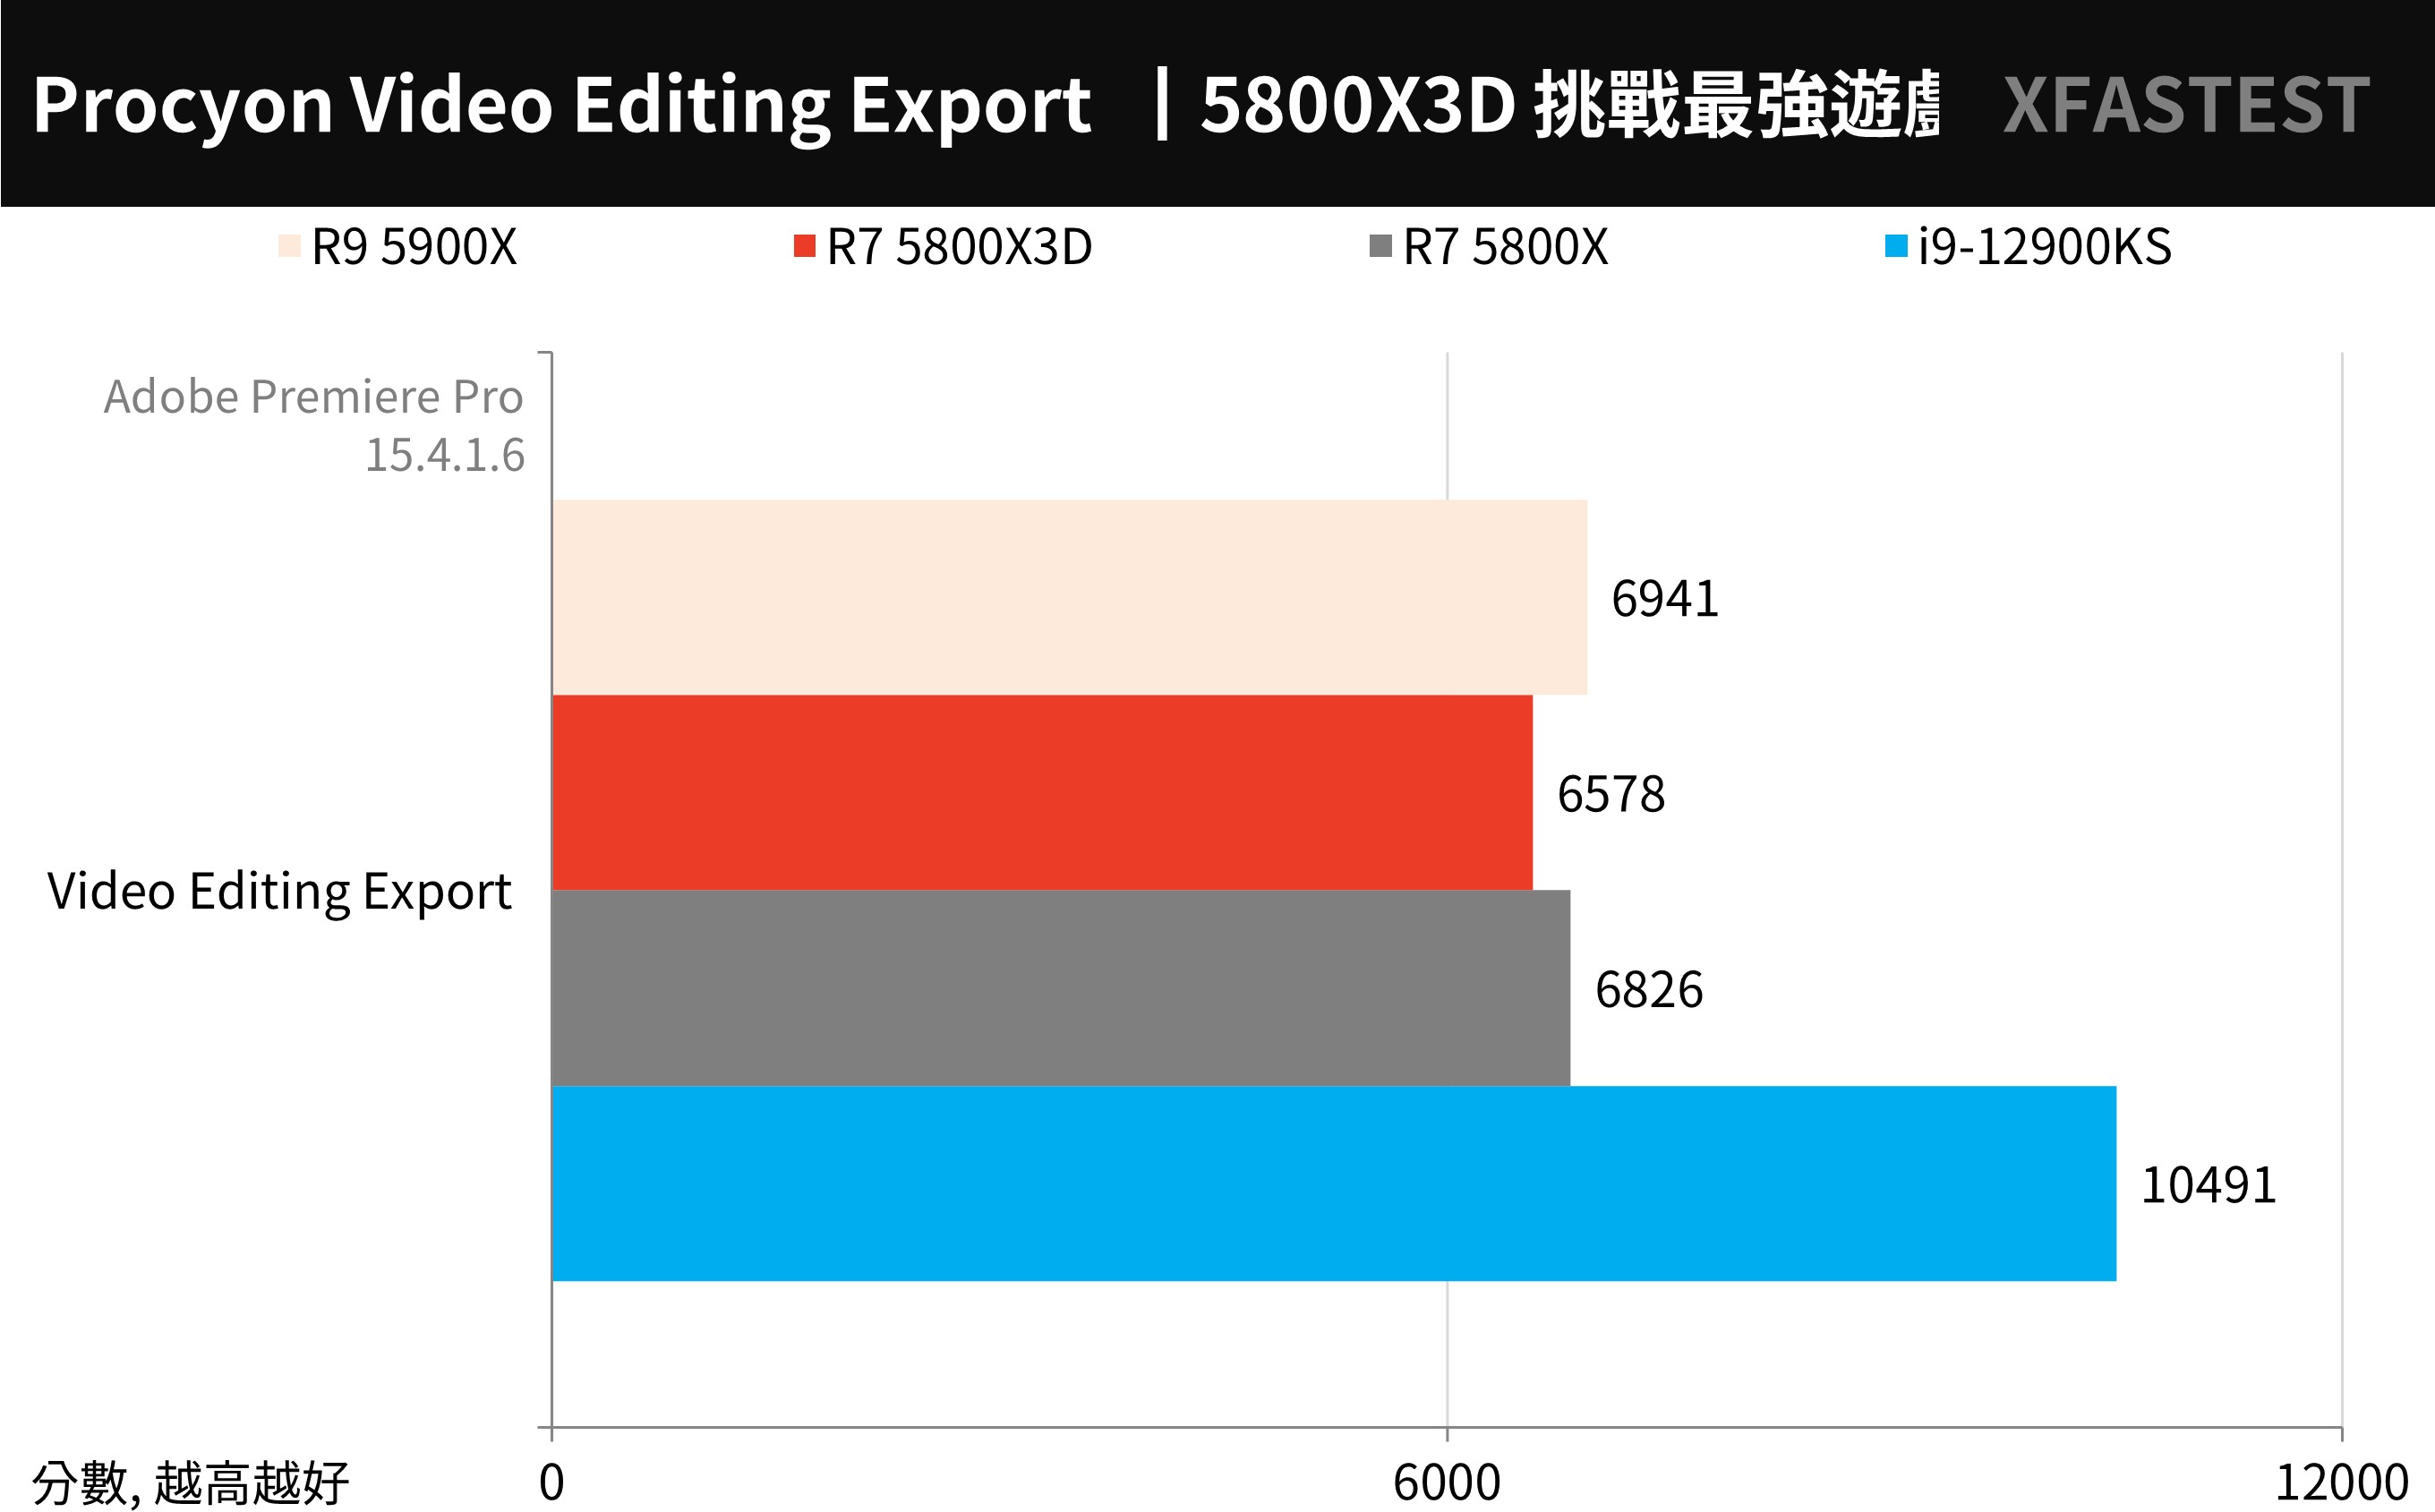
↑ UL Procyon Video Editing Benchmark, the higher the score, the better.
Adobe Photoshop and Lightroom Classic through UL Procyon Photo Editing Benchmark Test tool; the two working scenarios of the test, Image Retouching test is to use Photoshop to trim photos and record the time of each step, while Batch Processing test is to use Lightroom to adjust and output a large number of photos in batches.
From the overall score point of view, the 5800X3D is equivalent to 10027 points in performance compared to the 5900X and 5800X.
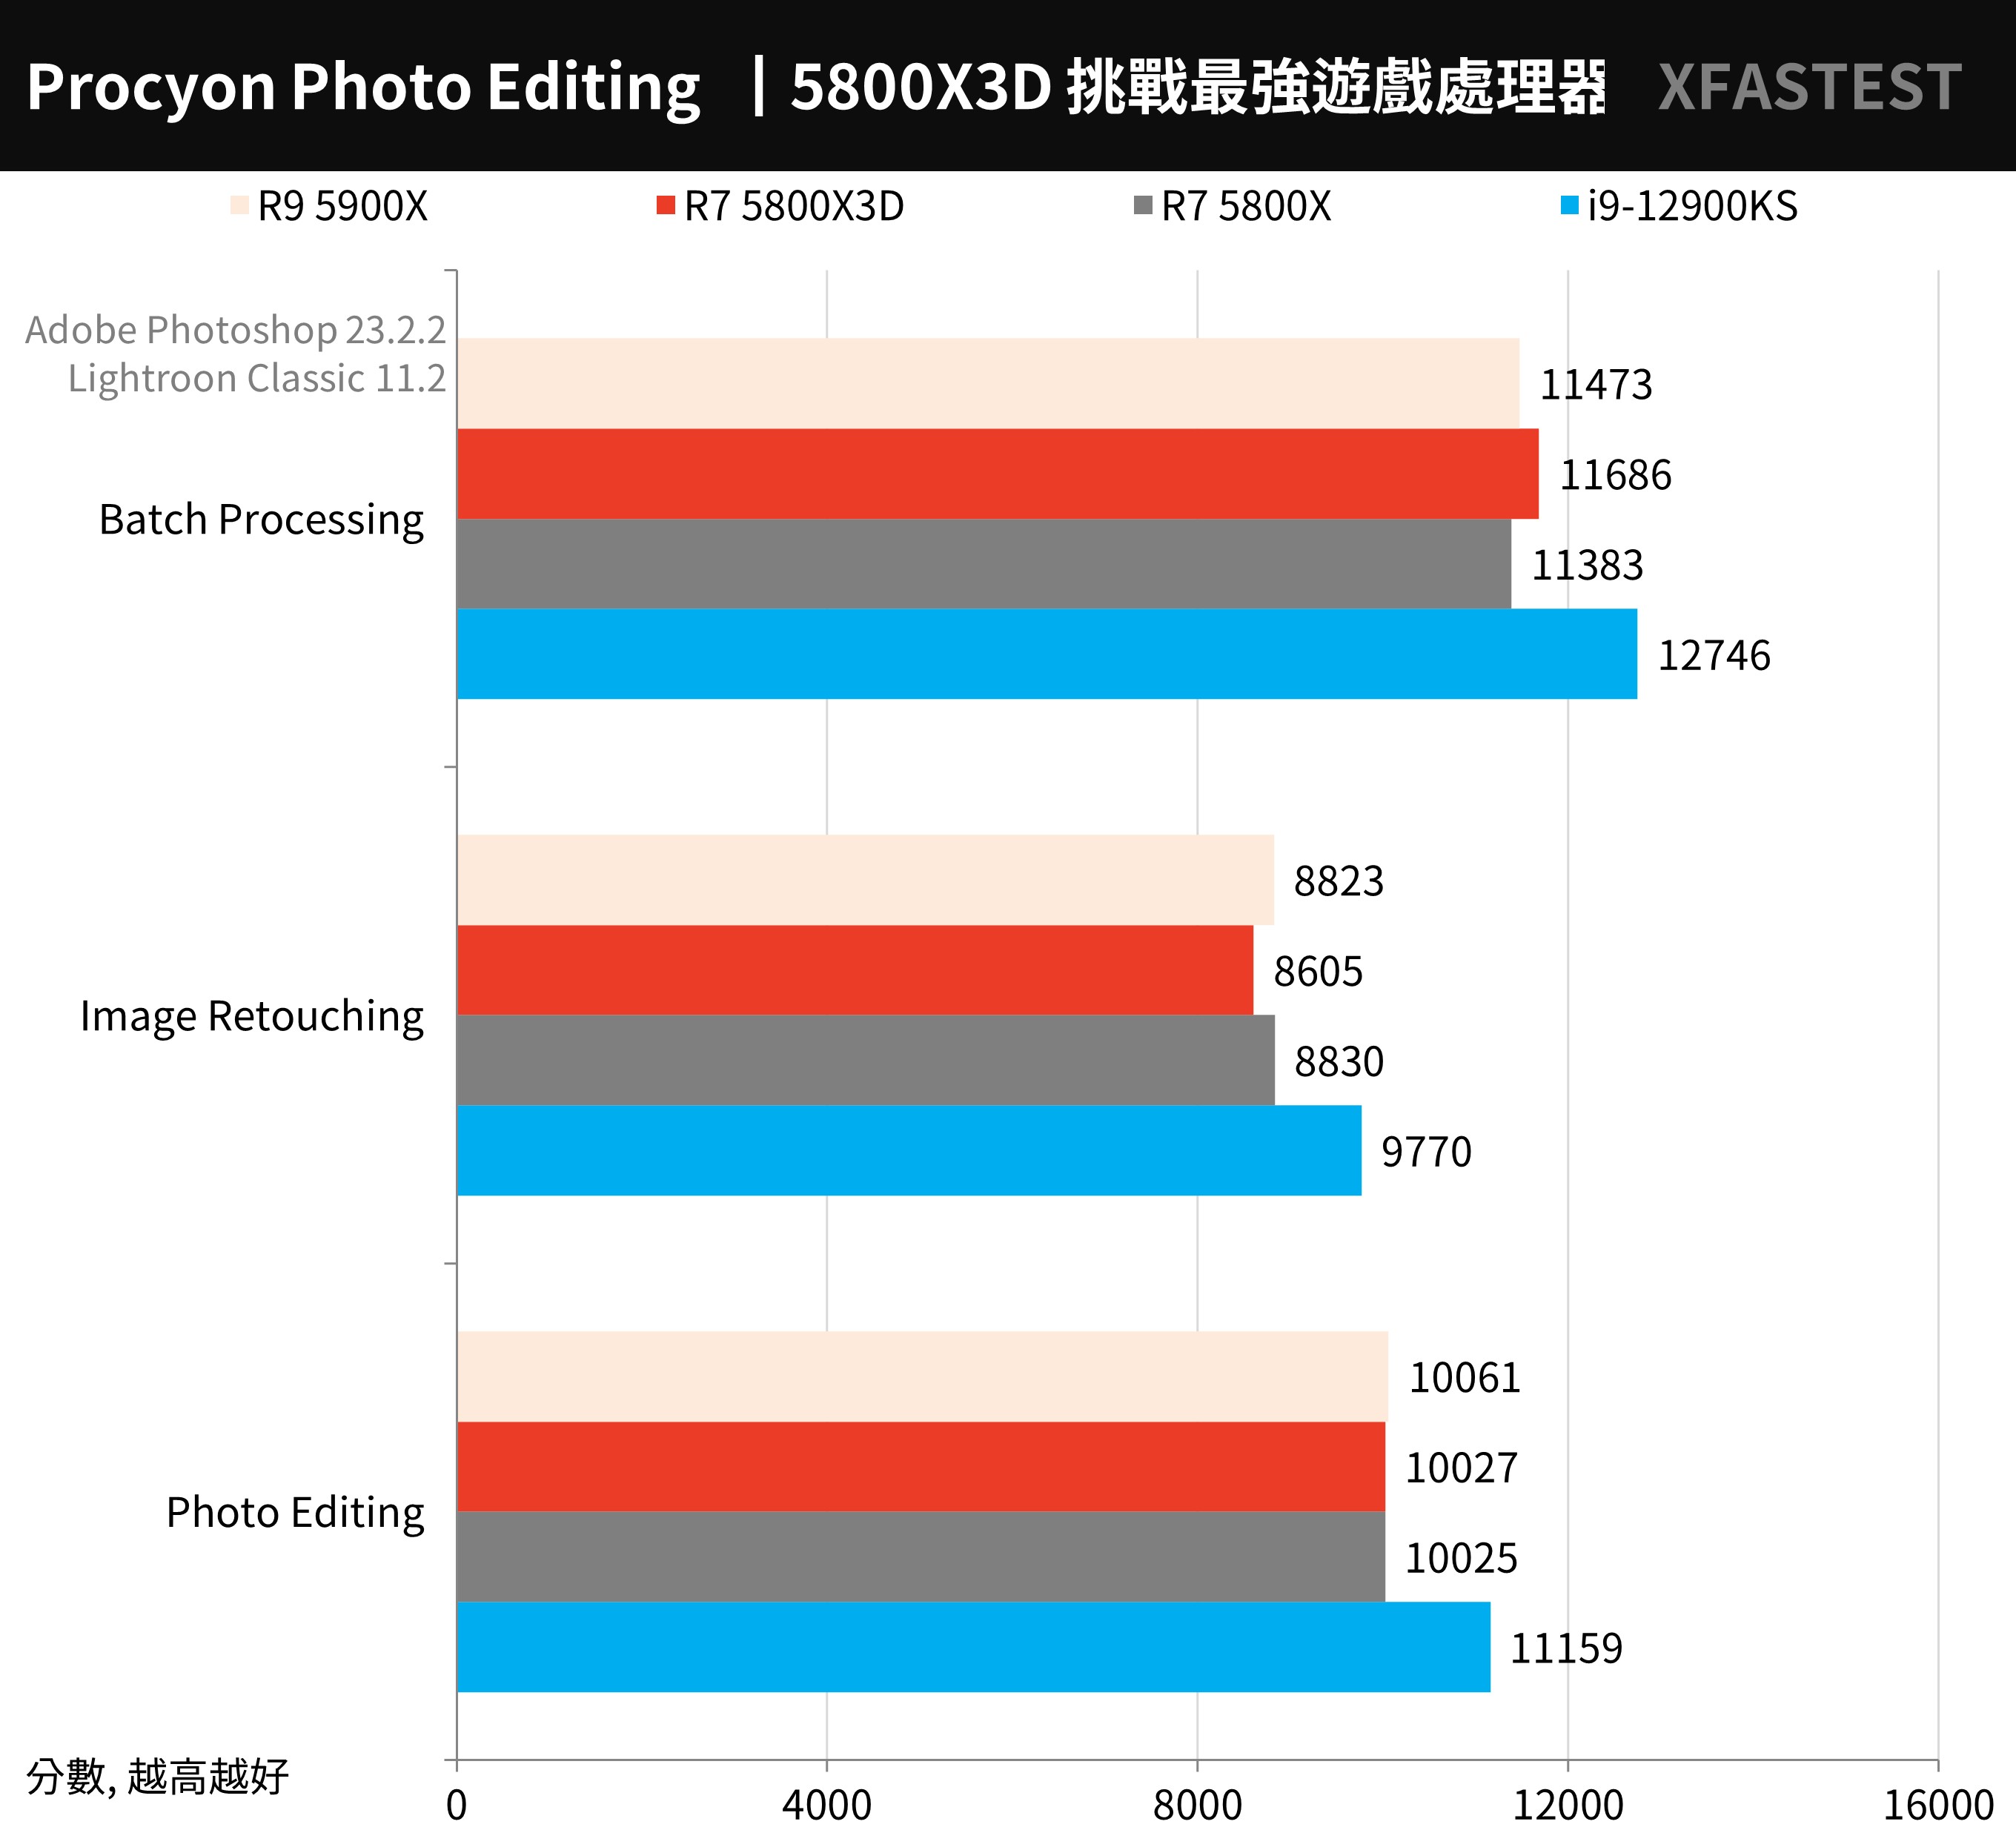
↑ UL Procyon Photo Editing Benchmark, the higher the score, the better.
AIDA64 processor memory, WinRAR, 7-Zip compression test
AIDA64 memory test5800X3D read 51124 MB/s, write 28791 MB/s performance and 5800X equivalent, and the memory latency is 62.6ns.
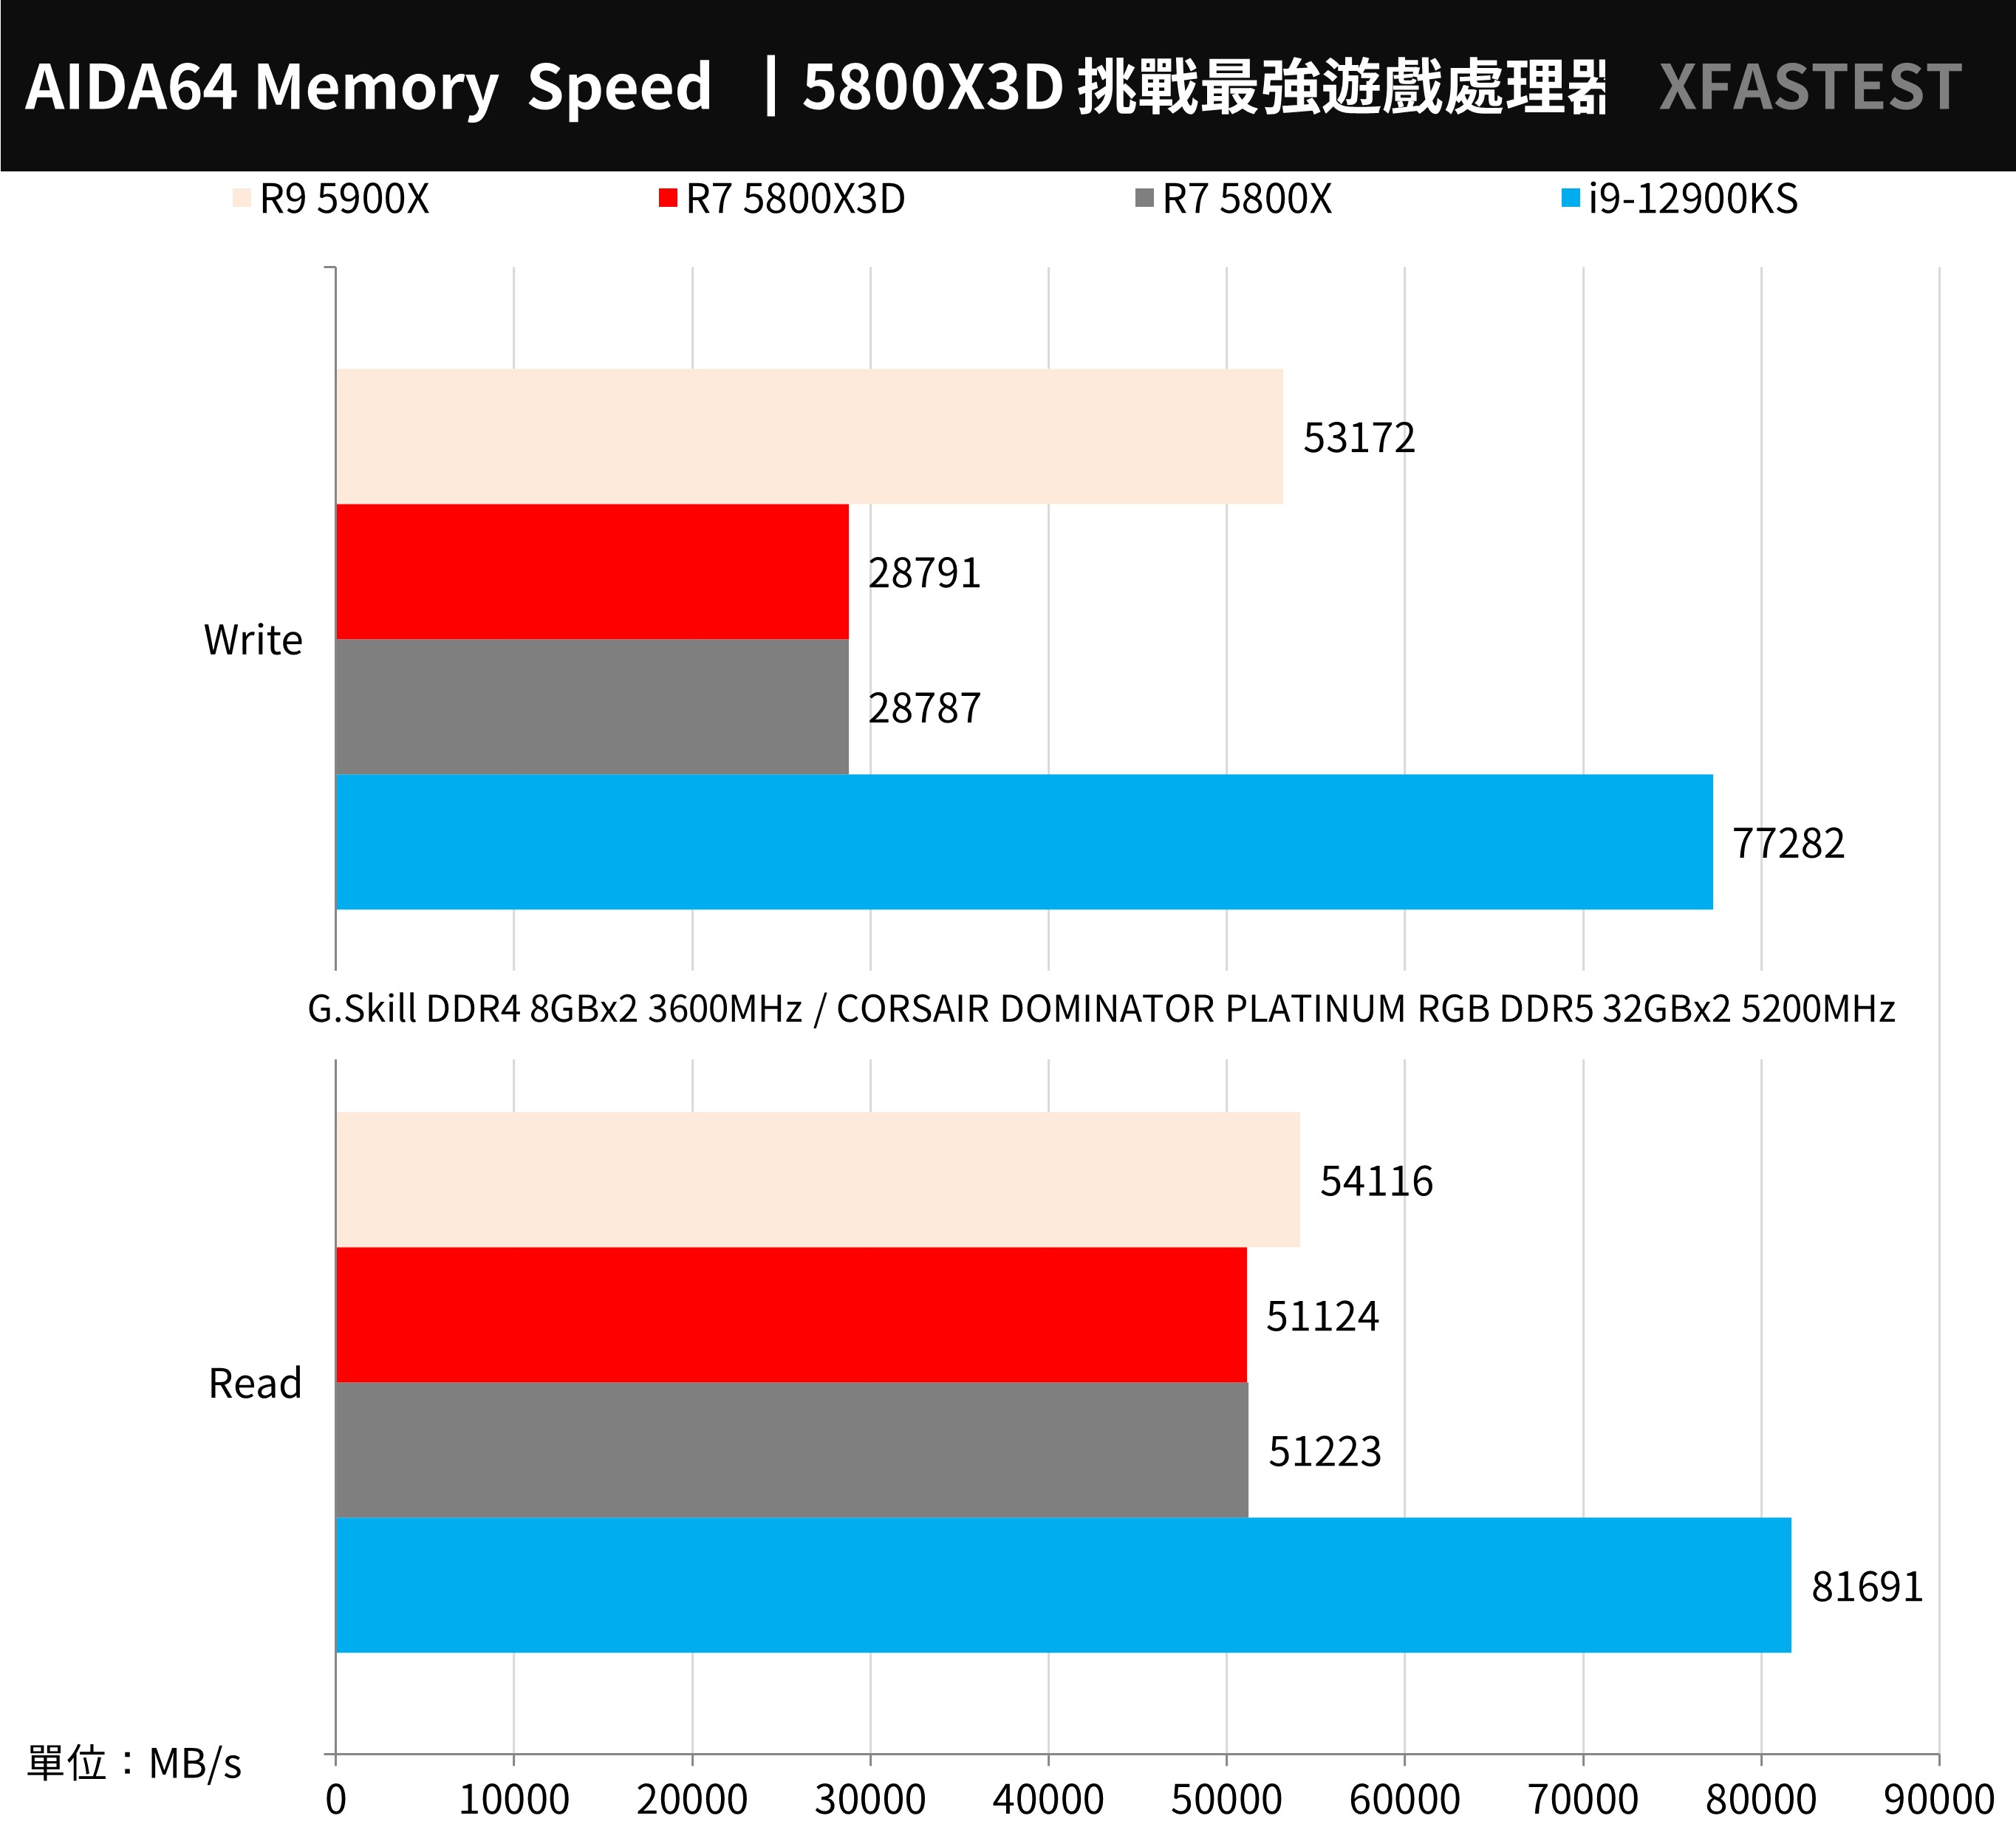
↑ Memory performance test.
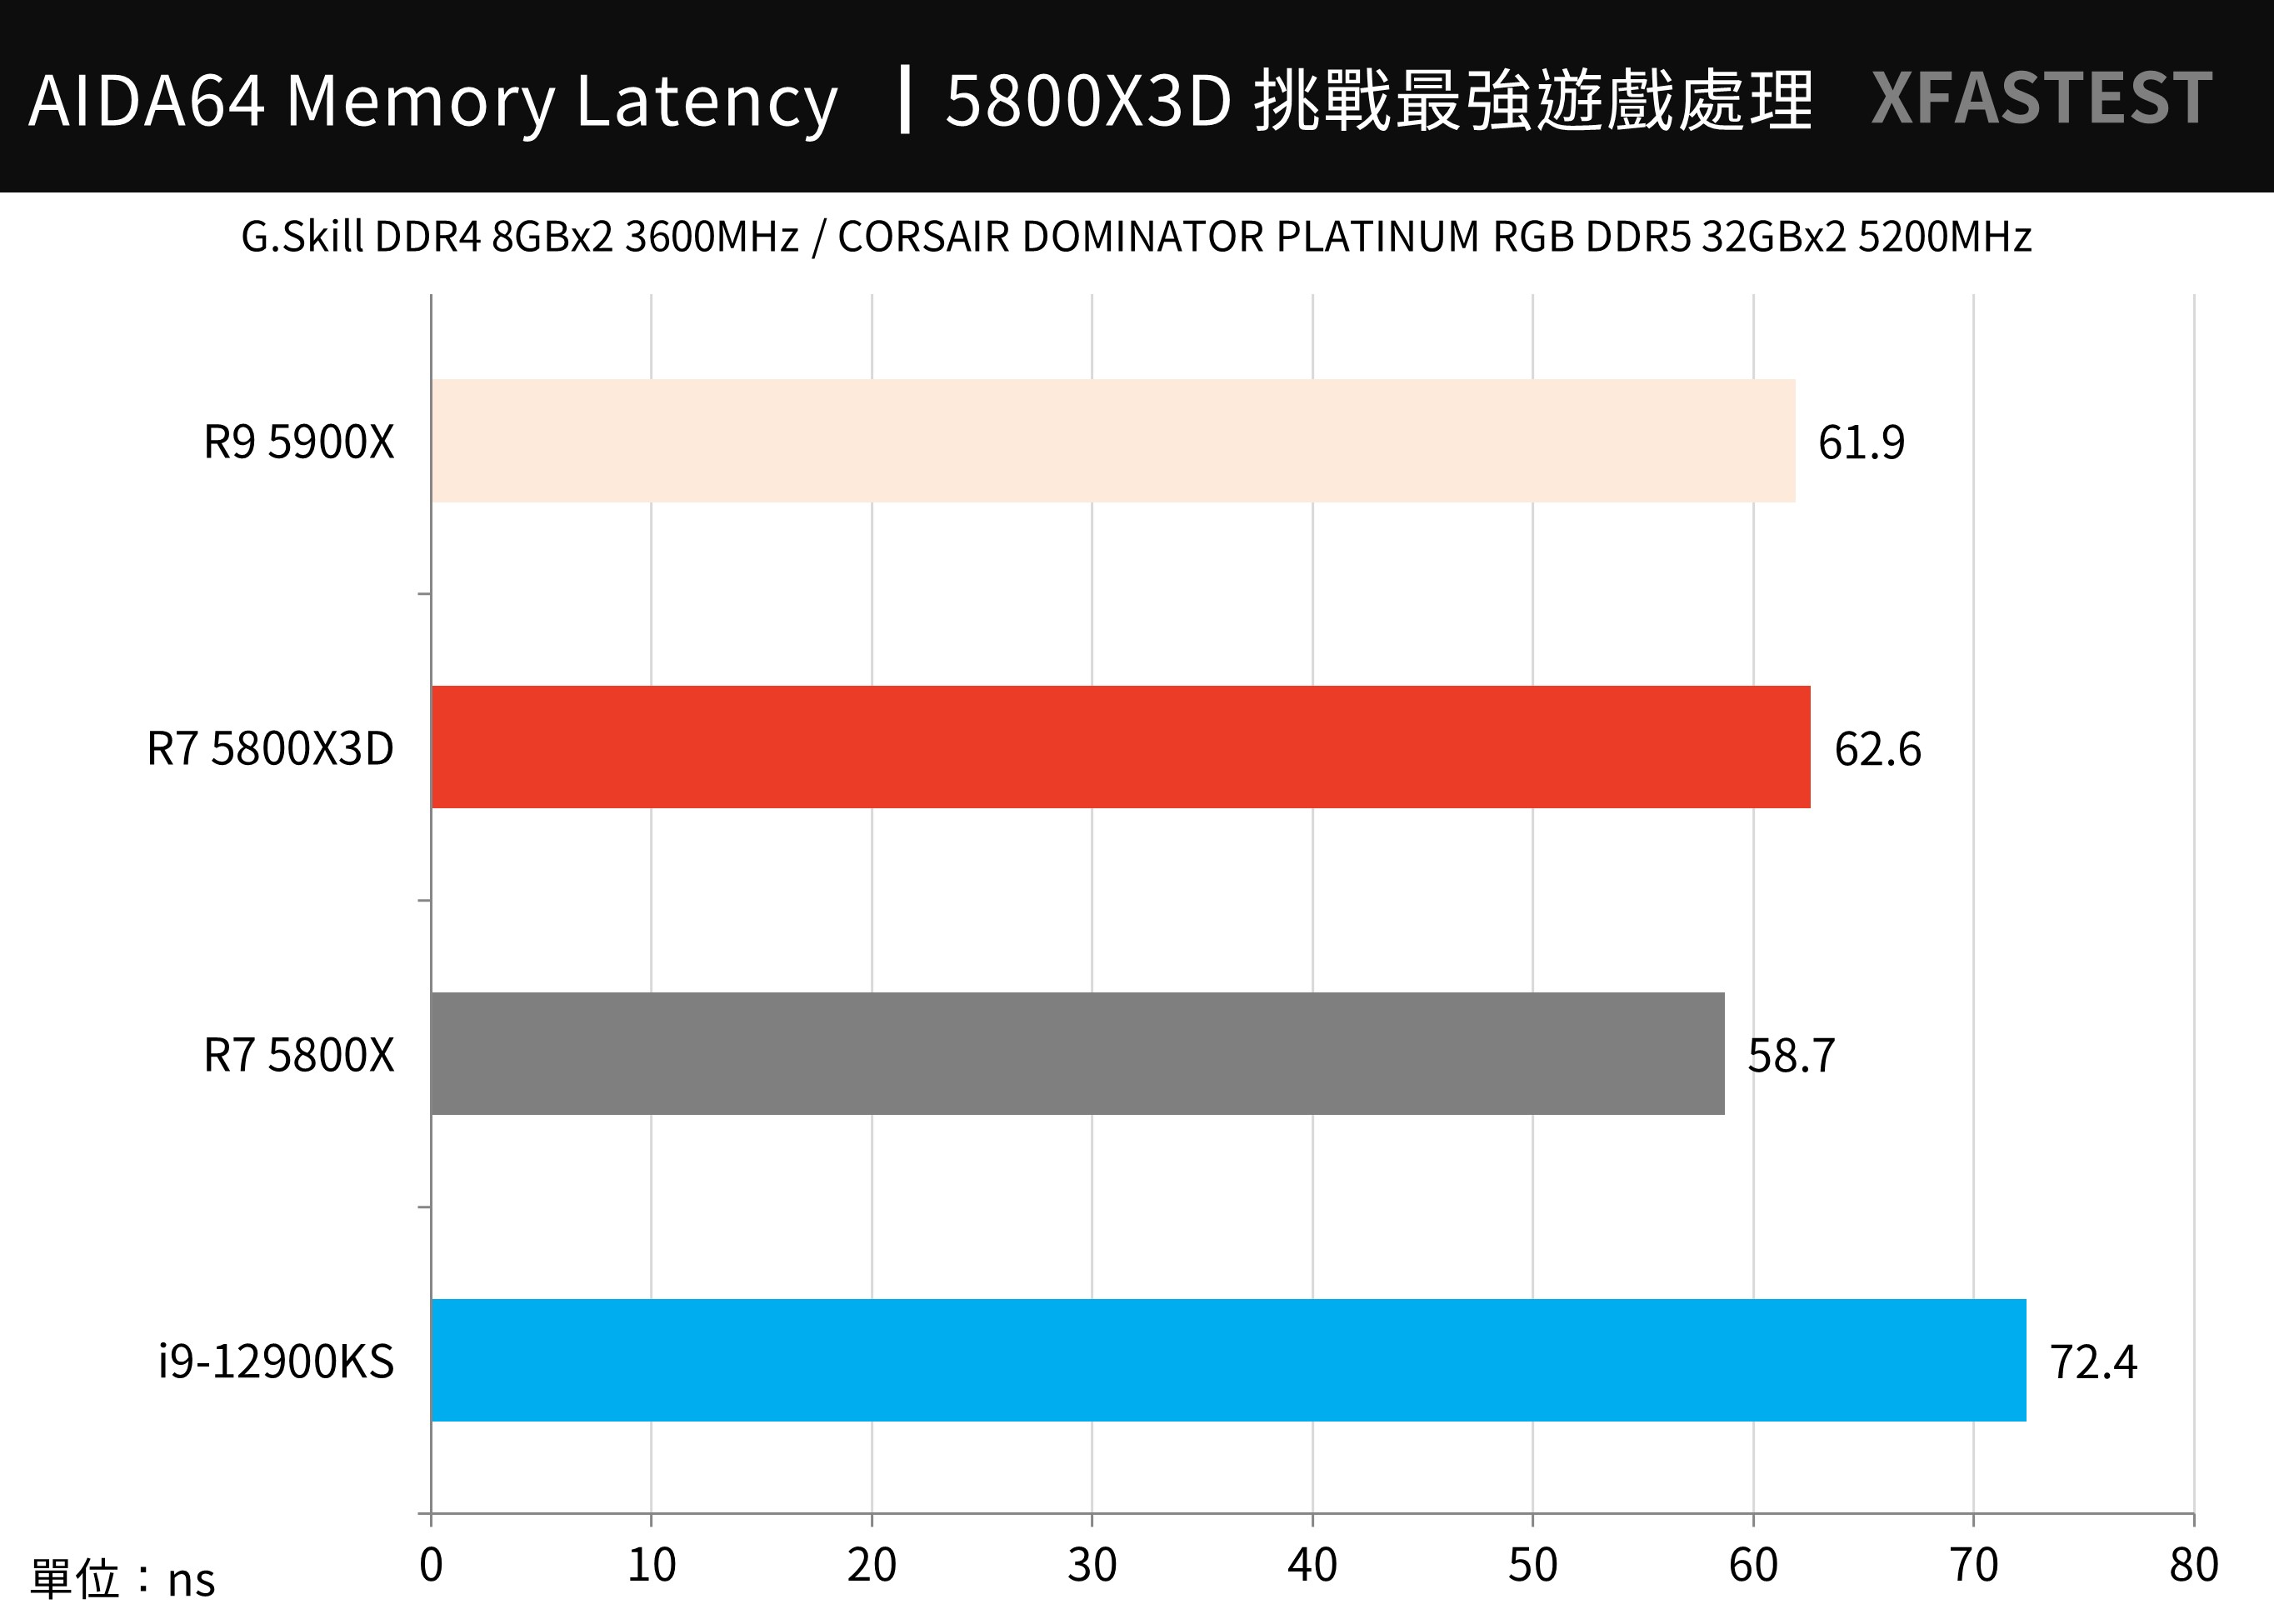
↑ Memory latency.
WinRAR Extensive and convenient compression software, supporting a lot of compressed files and formats, this one used to prefer high clock in performance, but in the Alder Lake generation, Ryzen has an advantage in performance.
On the contrary, this project is the strong direction of 5800X3D. With the larger L3 cache performance, it reaches a speed of 47527 KB/s, which is a 42% performance improvement compared to 5800X. It is also one of the few applications that prefer large-capacity cache in this test.
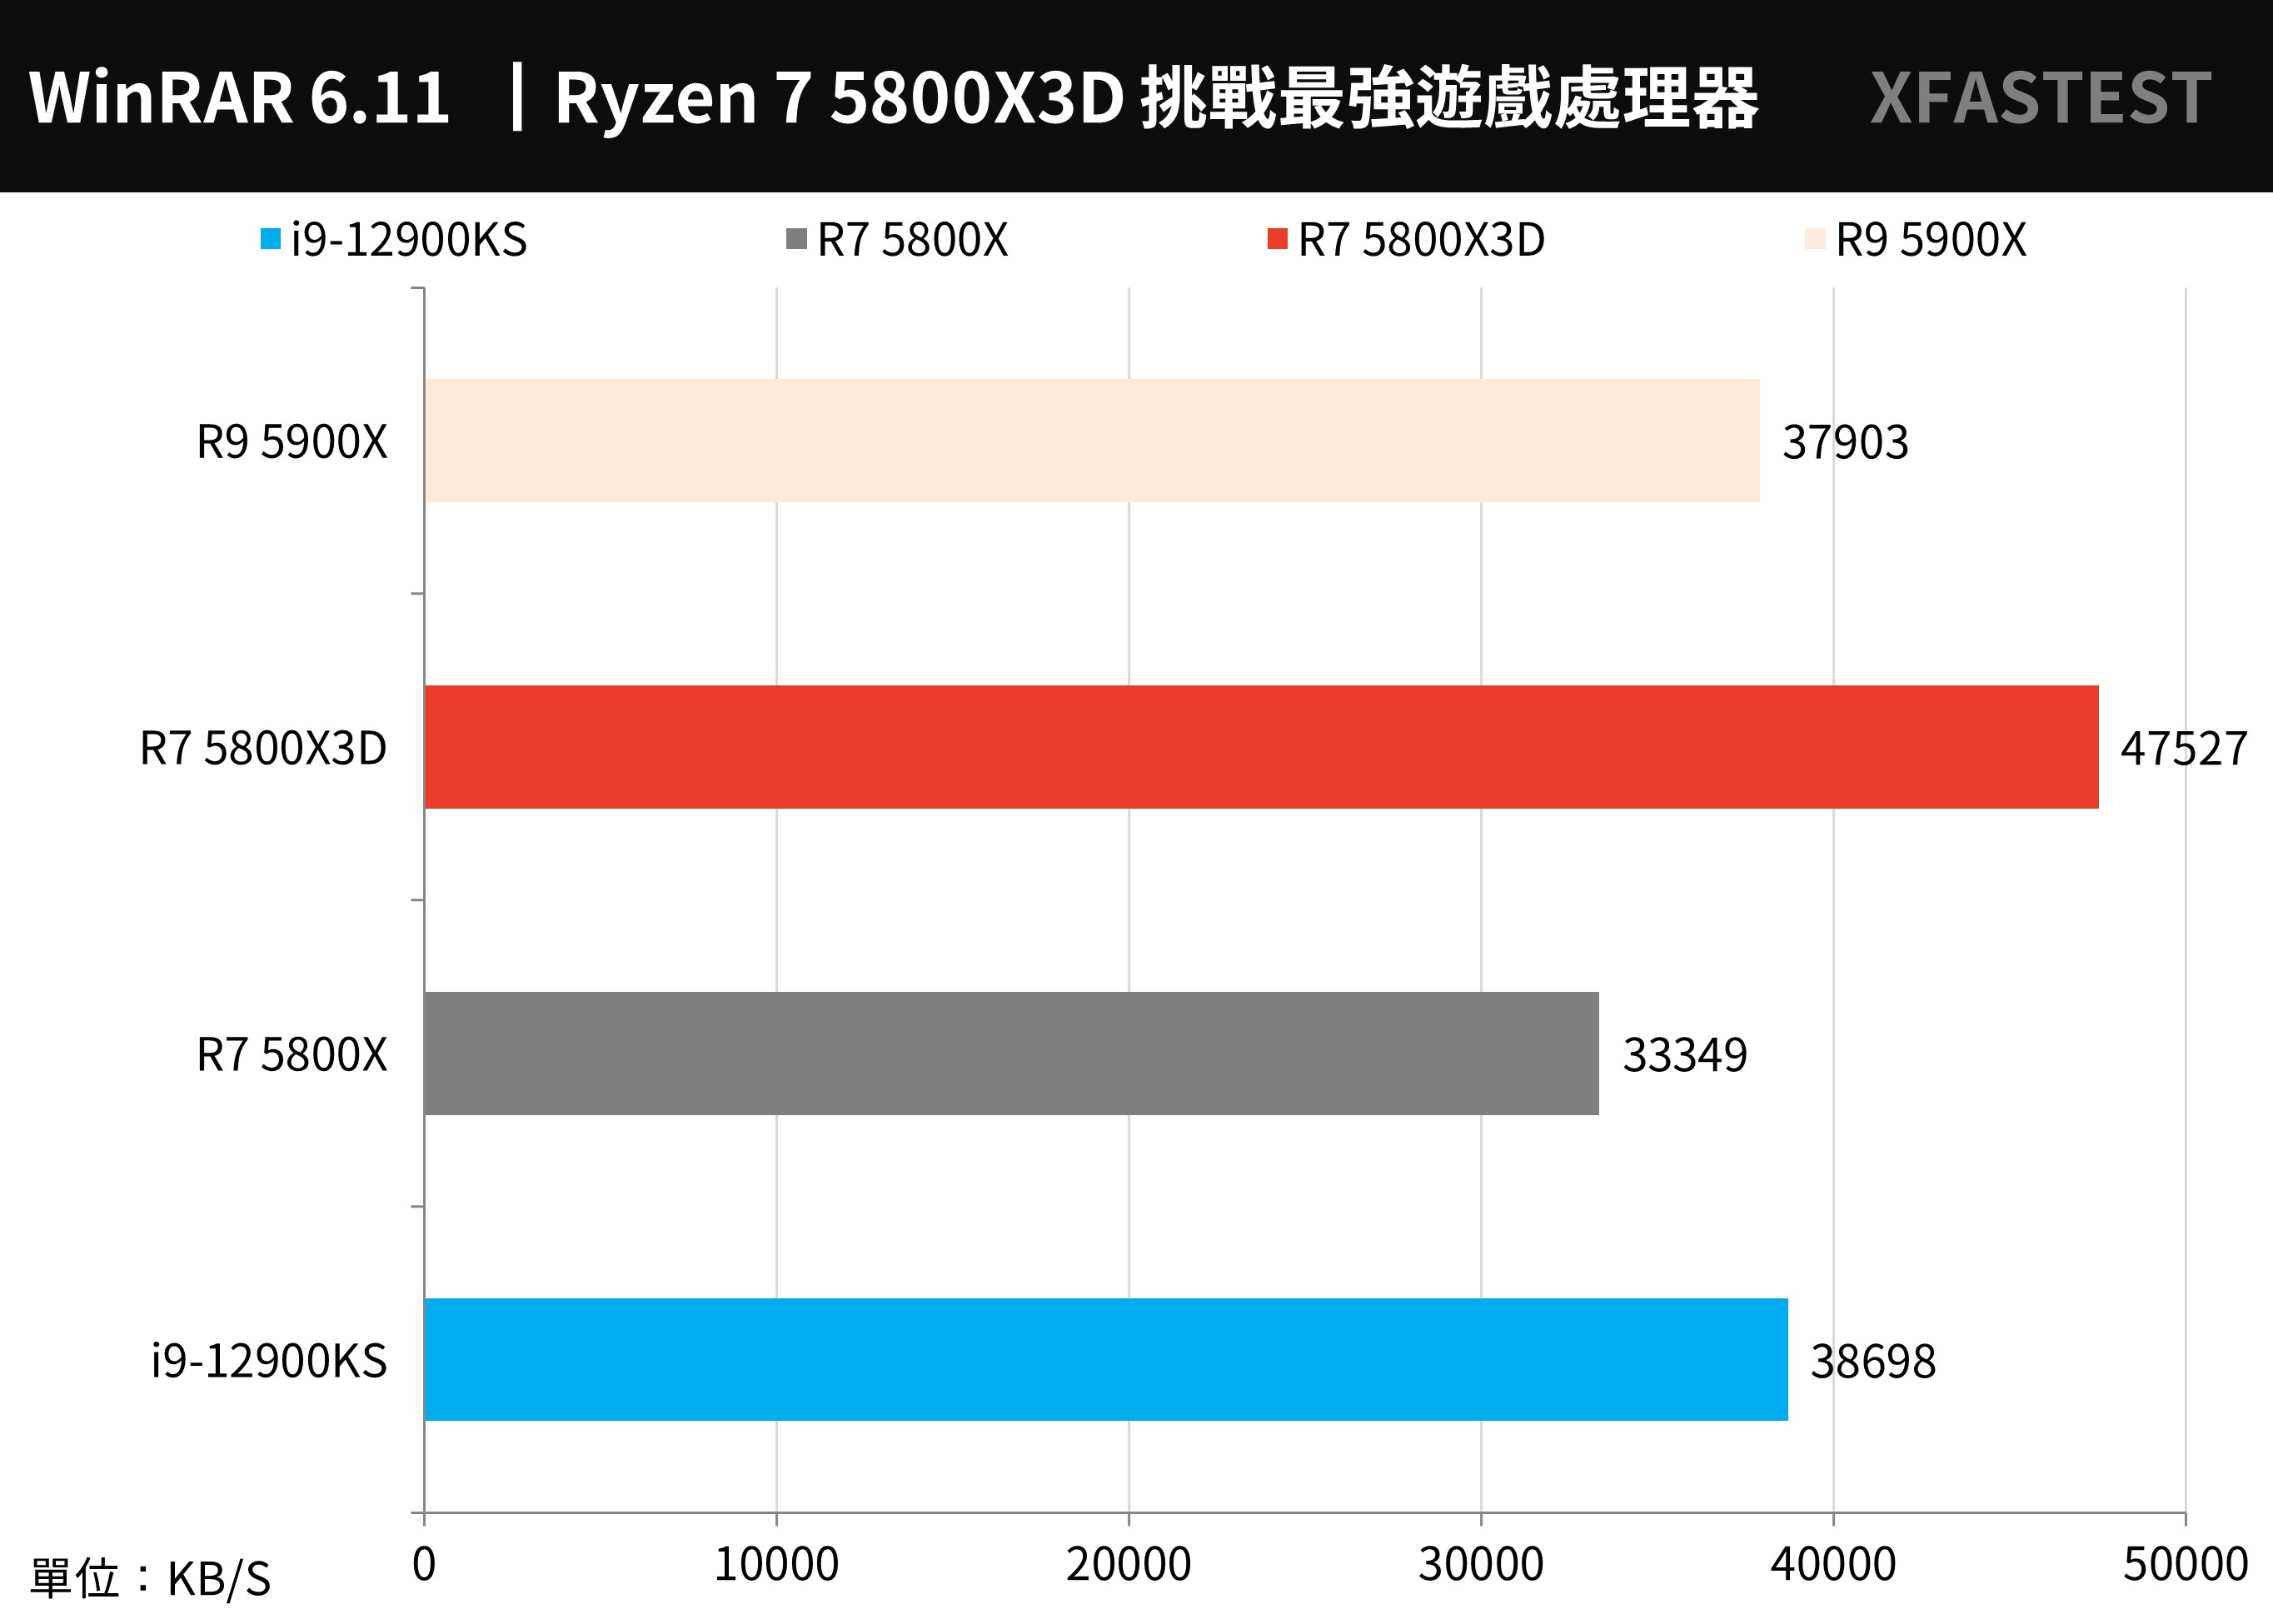
↑ WinRAR, the higher the performance, the better.
7-Zip The compression test prefers multi-core performance. The 5800X3D cannot exchange high-capacity L3 cache for higher performance. The compression ratio is 87.8 GIPS and the decompression ratio is 118.2 GIPS.
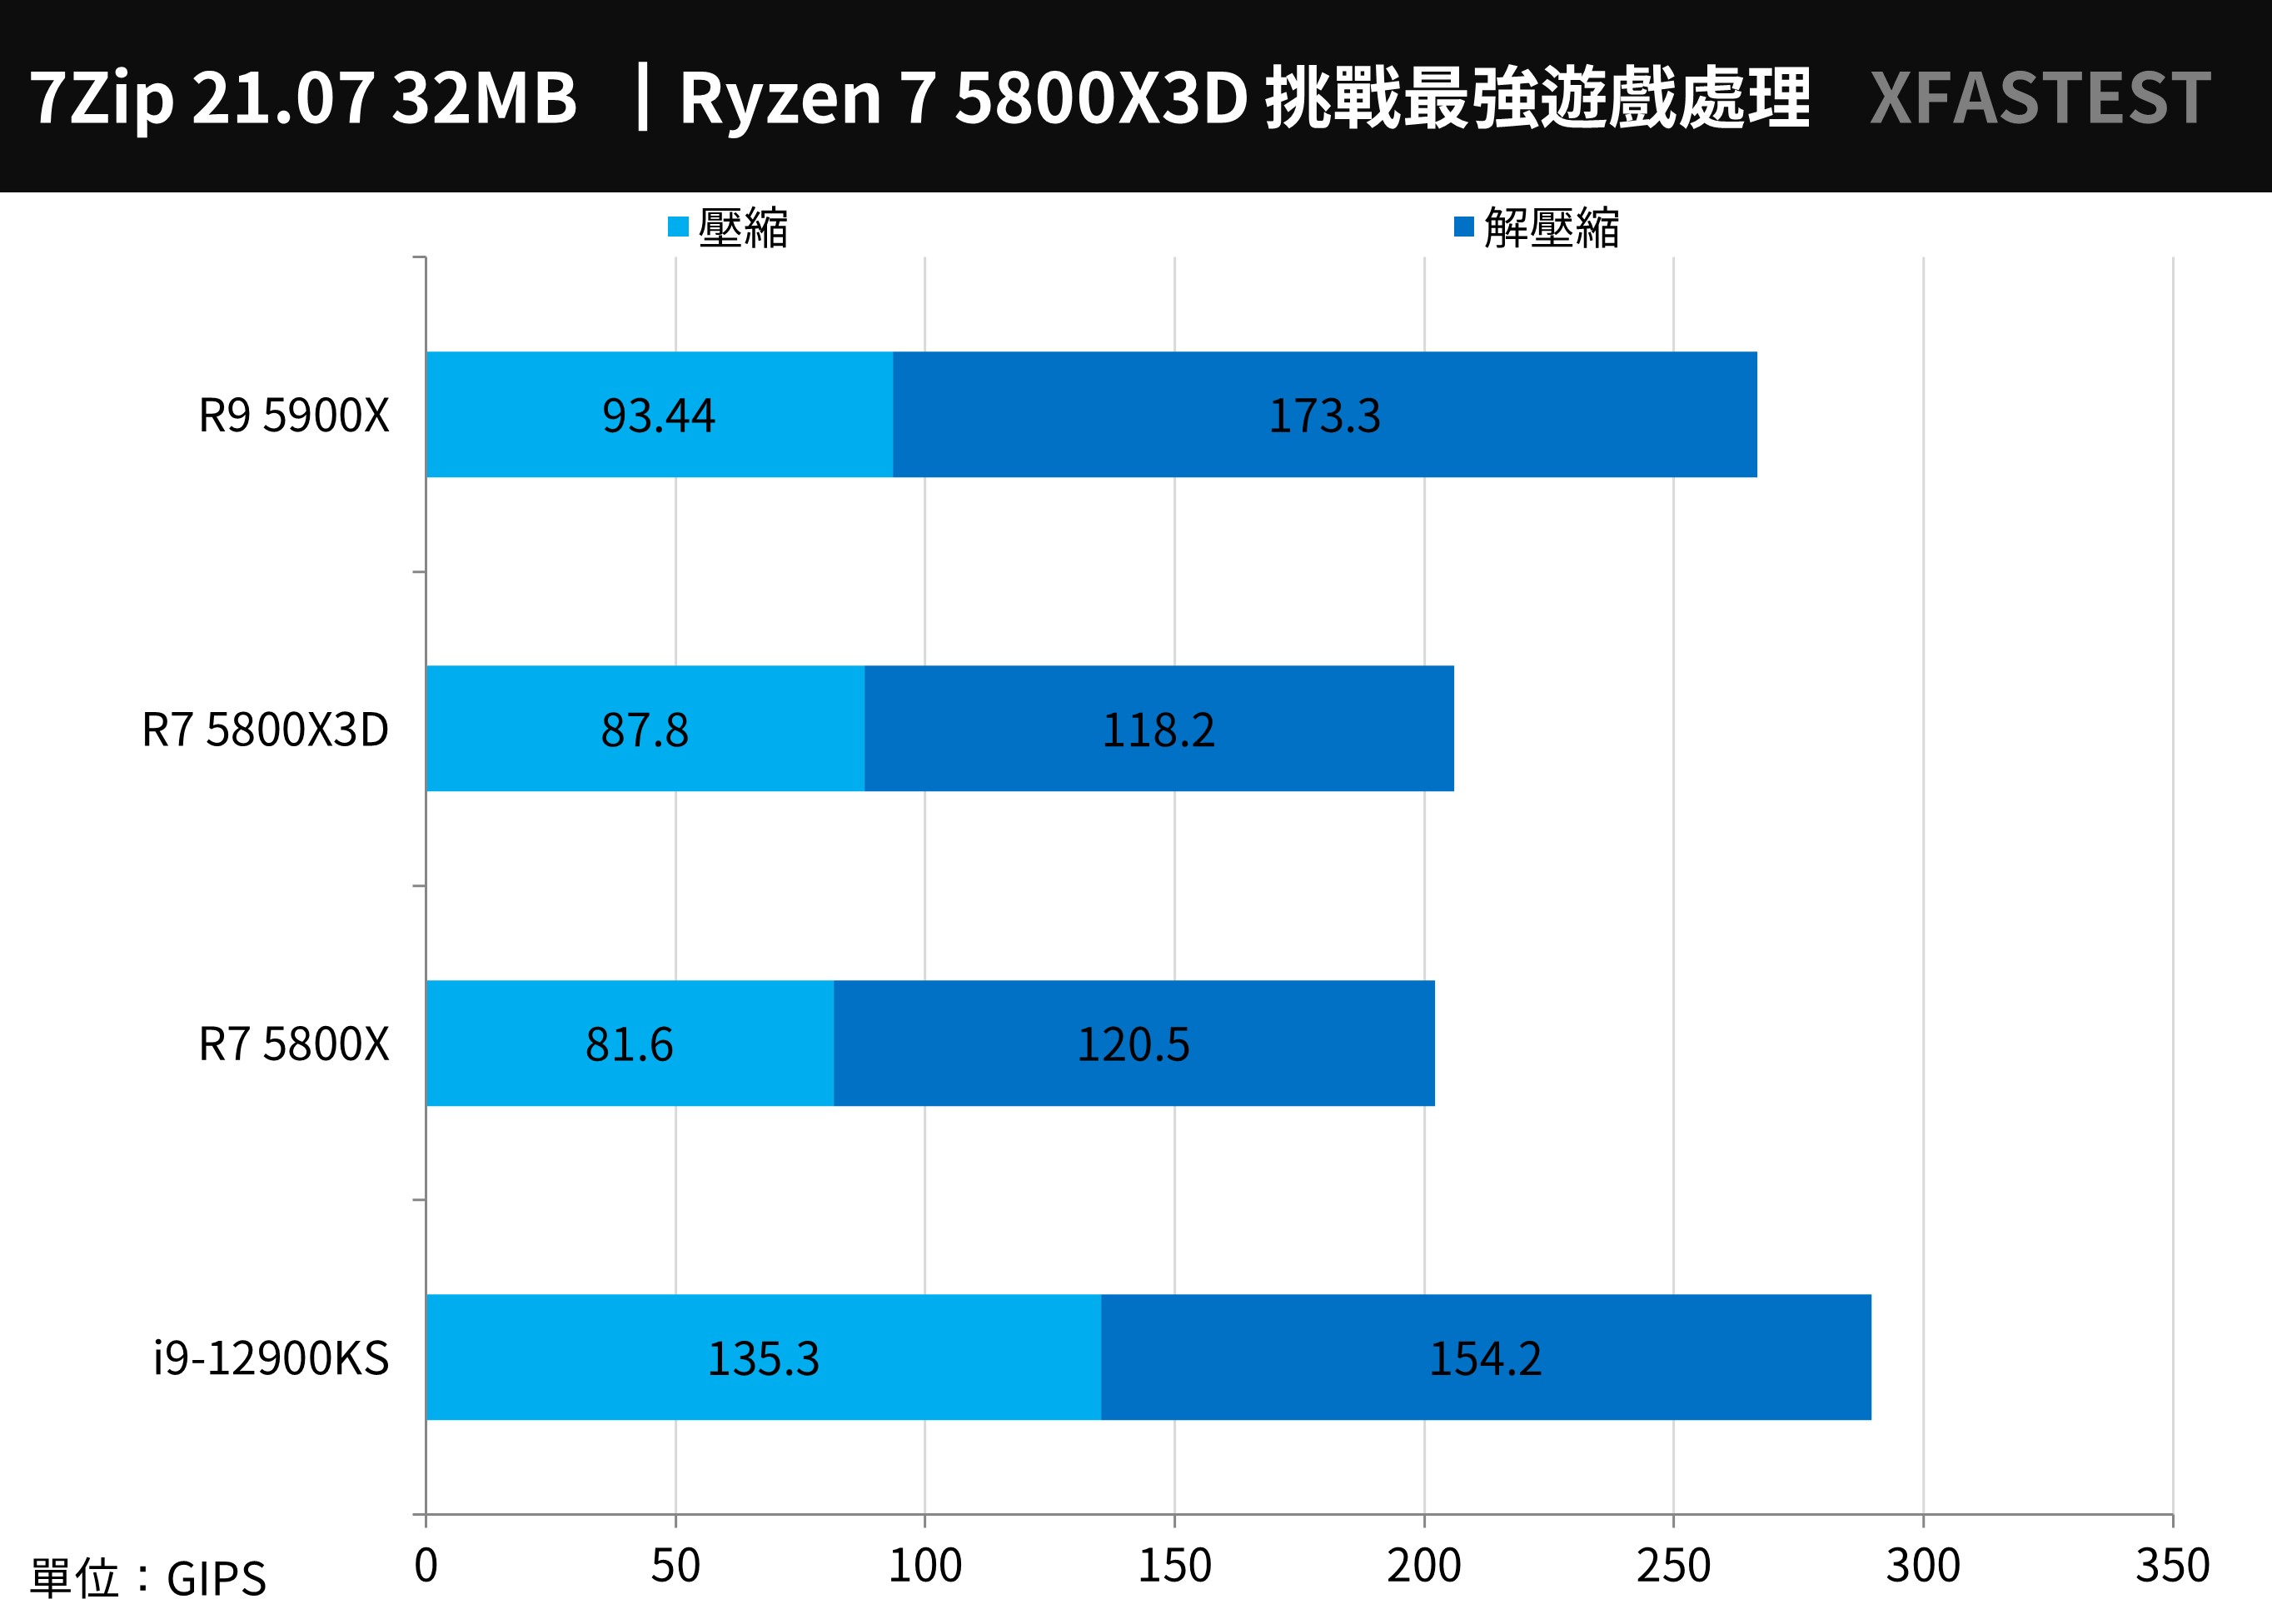
↑ 7-Zip, the higher the performance, the better.
PCMark 10, CrossMark and Office PC benchmarks
The overall performance of the computer is PCMark 10 For the test, you can score the basic computer work of Essentials, such as app startup speed, video conferencing, and web browsing performance, while the Productivity productivity test uses spreadsheets and paperwork as test items. As for Digital Content Creation, video content creation, Tests are based on photo/video editing, rendering and visualization.
The 5800X3D achieved a total score of 8169 points, 10845 points for basic computer work, 10291 points for productivity, and 13255 points for creation.
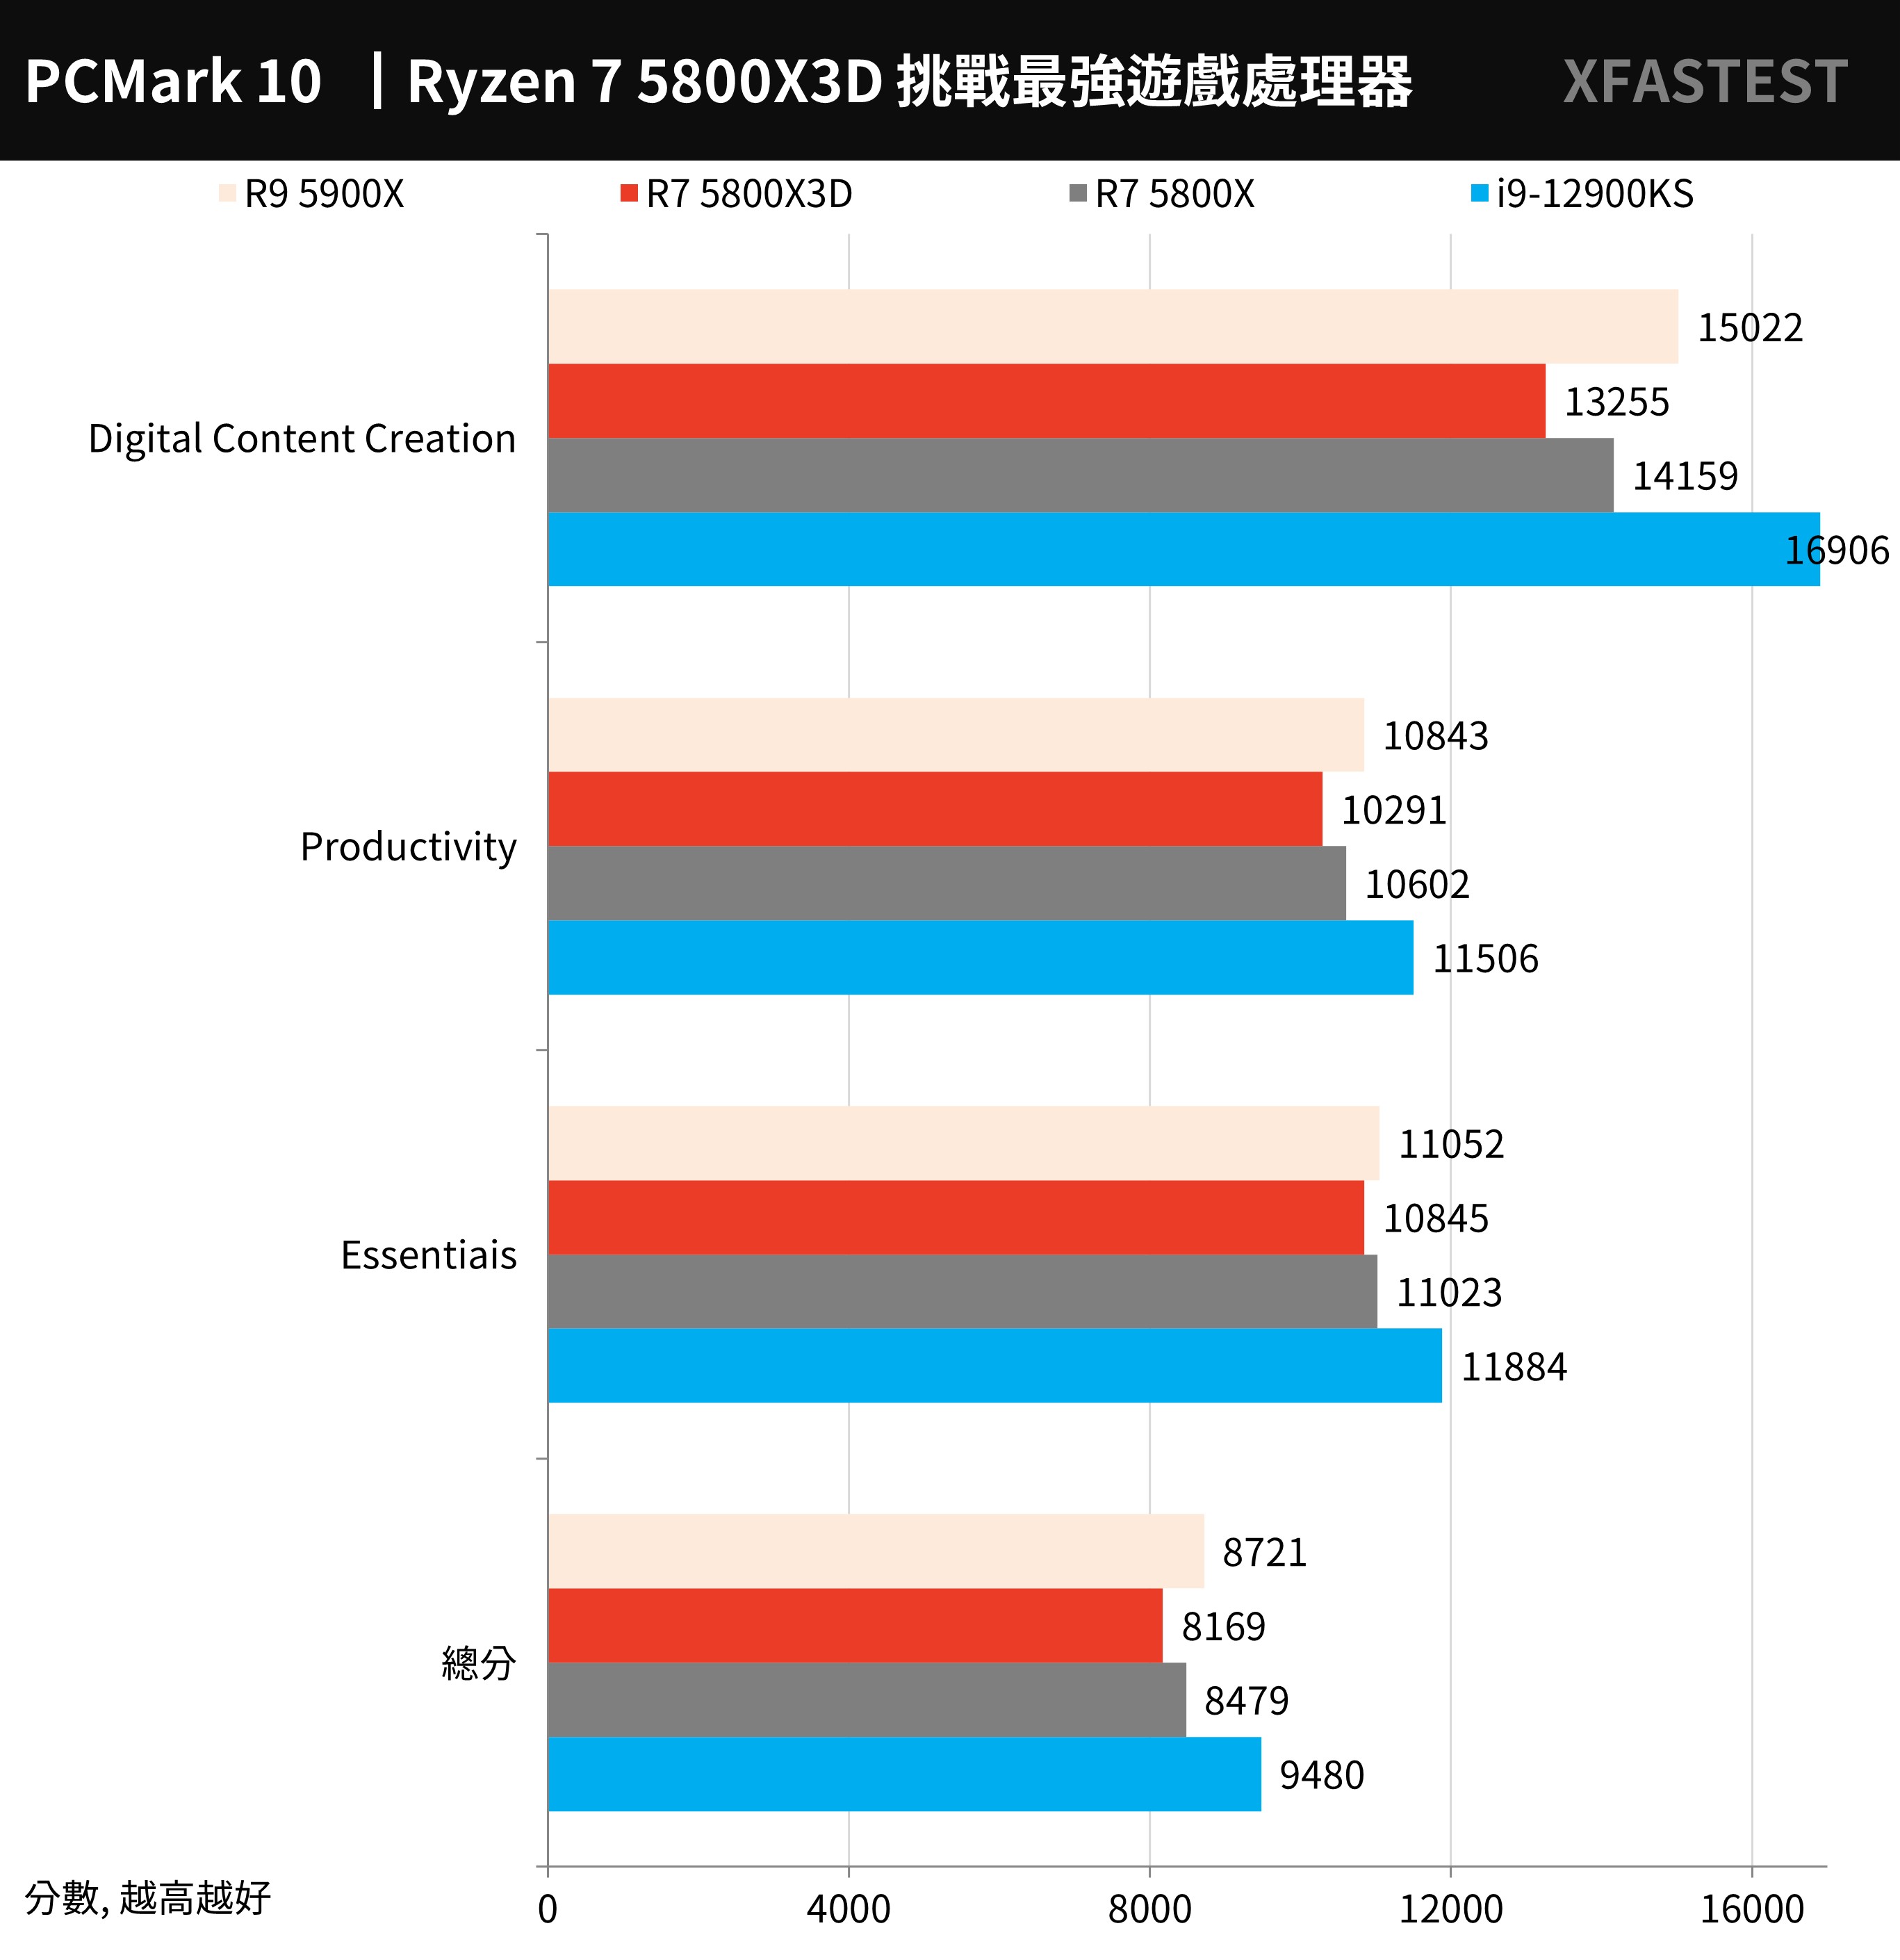
↑ PCMark 10, higher scores are better.
CrossMark The cross-platform computer performance testing tool is a free testing tool developed by BAPCo, which supports Windows, iOS/iPadOS, macOS and Android and other platforms, and is aimed at computer productivity, such as text editing, spreadsheets, web browsing, and authoring Class photo editing, organizing and video editing work, plus computer response speed for testing.
5800X3D scored 1699 points in total, 1643 points in productivity, 1852 points in creation and 1448 points in reaction.
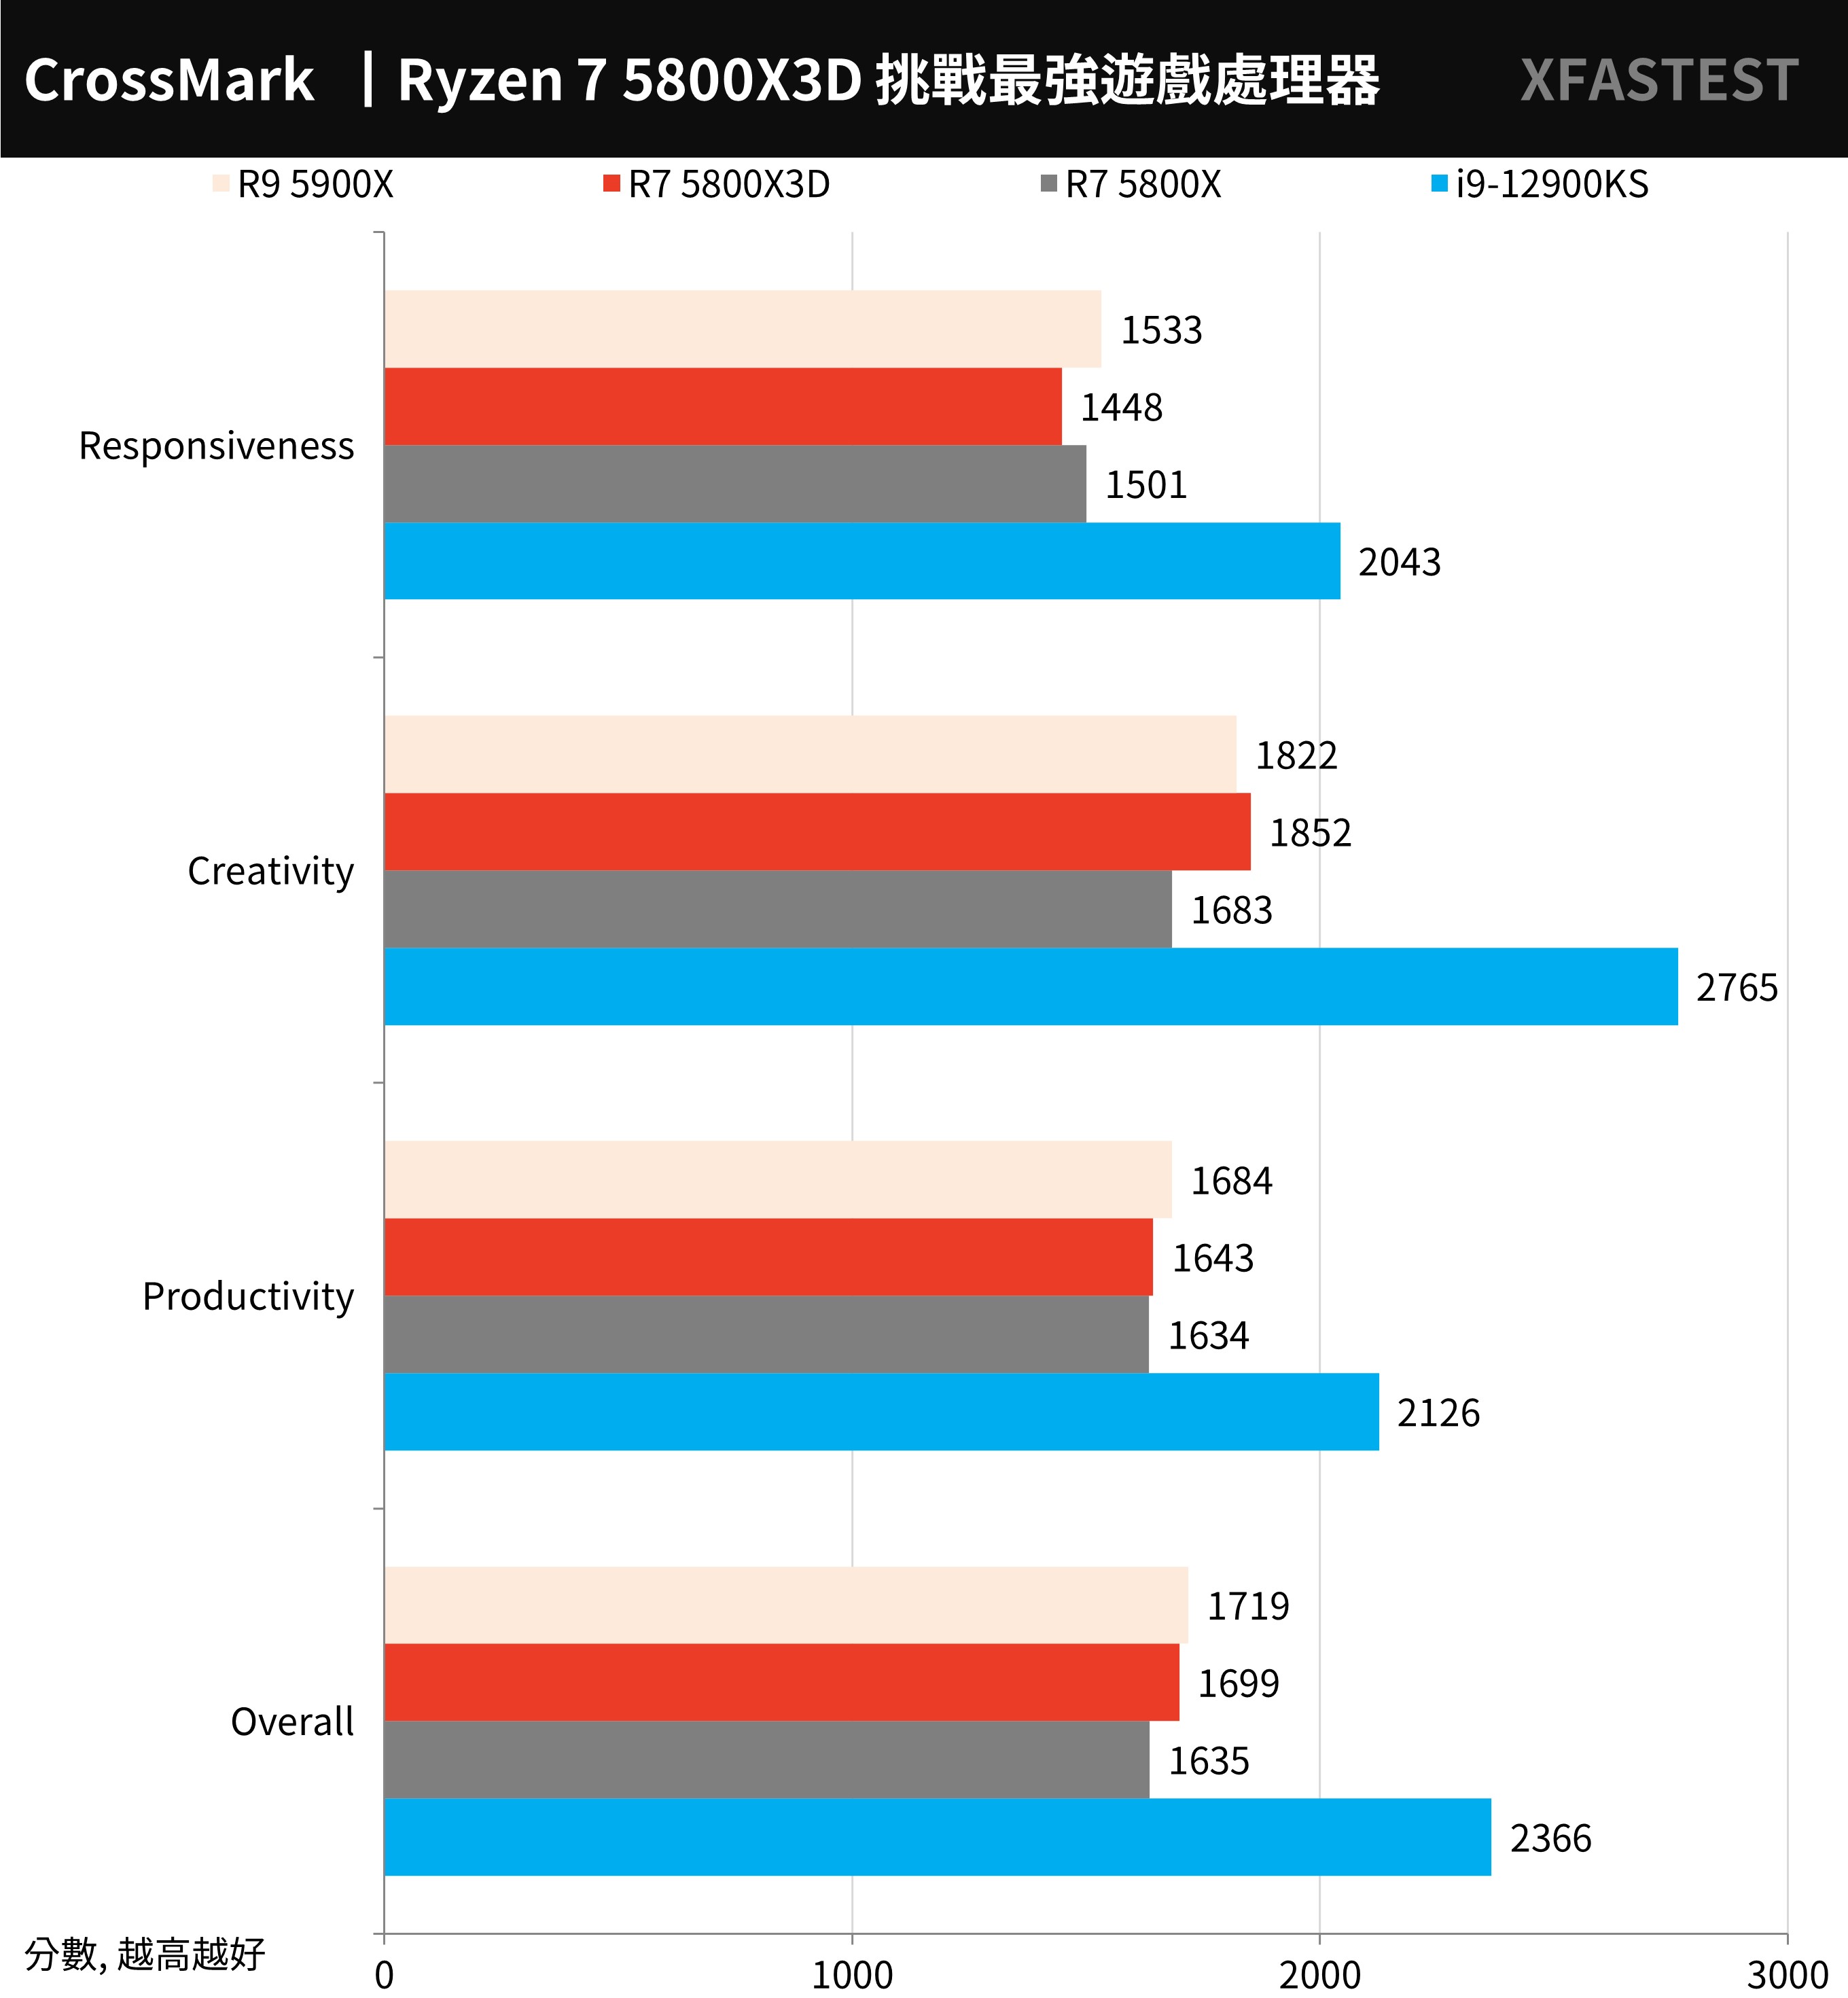
↑ CrossMark, the higher the score, the better.
UL Procyon Office Productivity Benchmark uses Microsoft Word, Excel, PowerPoint and Outlook to test the practical and real performance of Windows computers in daily work, and design test scenarios with common paperwork, from document opening, copying, input, spreadsheets Calculation, sorting, exporting, adding files, pictures, videos and emails to and from presentations, etc.
On the test, the 5800X3D scored 6789 points, Word 7048 points, Excel 6537 points, PowerPoint 8018 points, Outlook 4874 points.
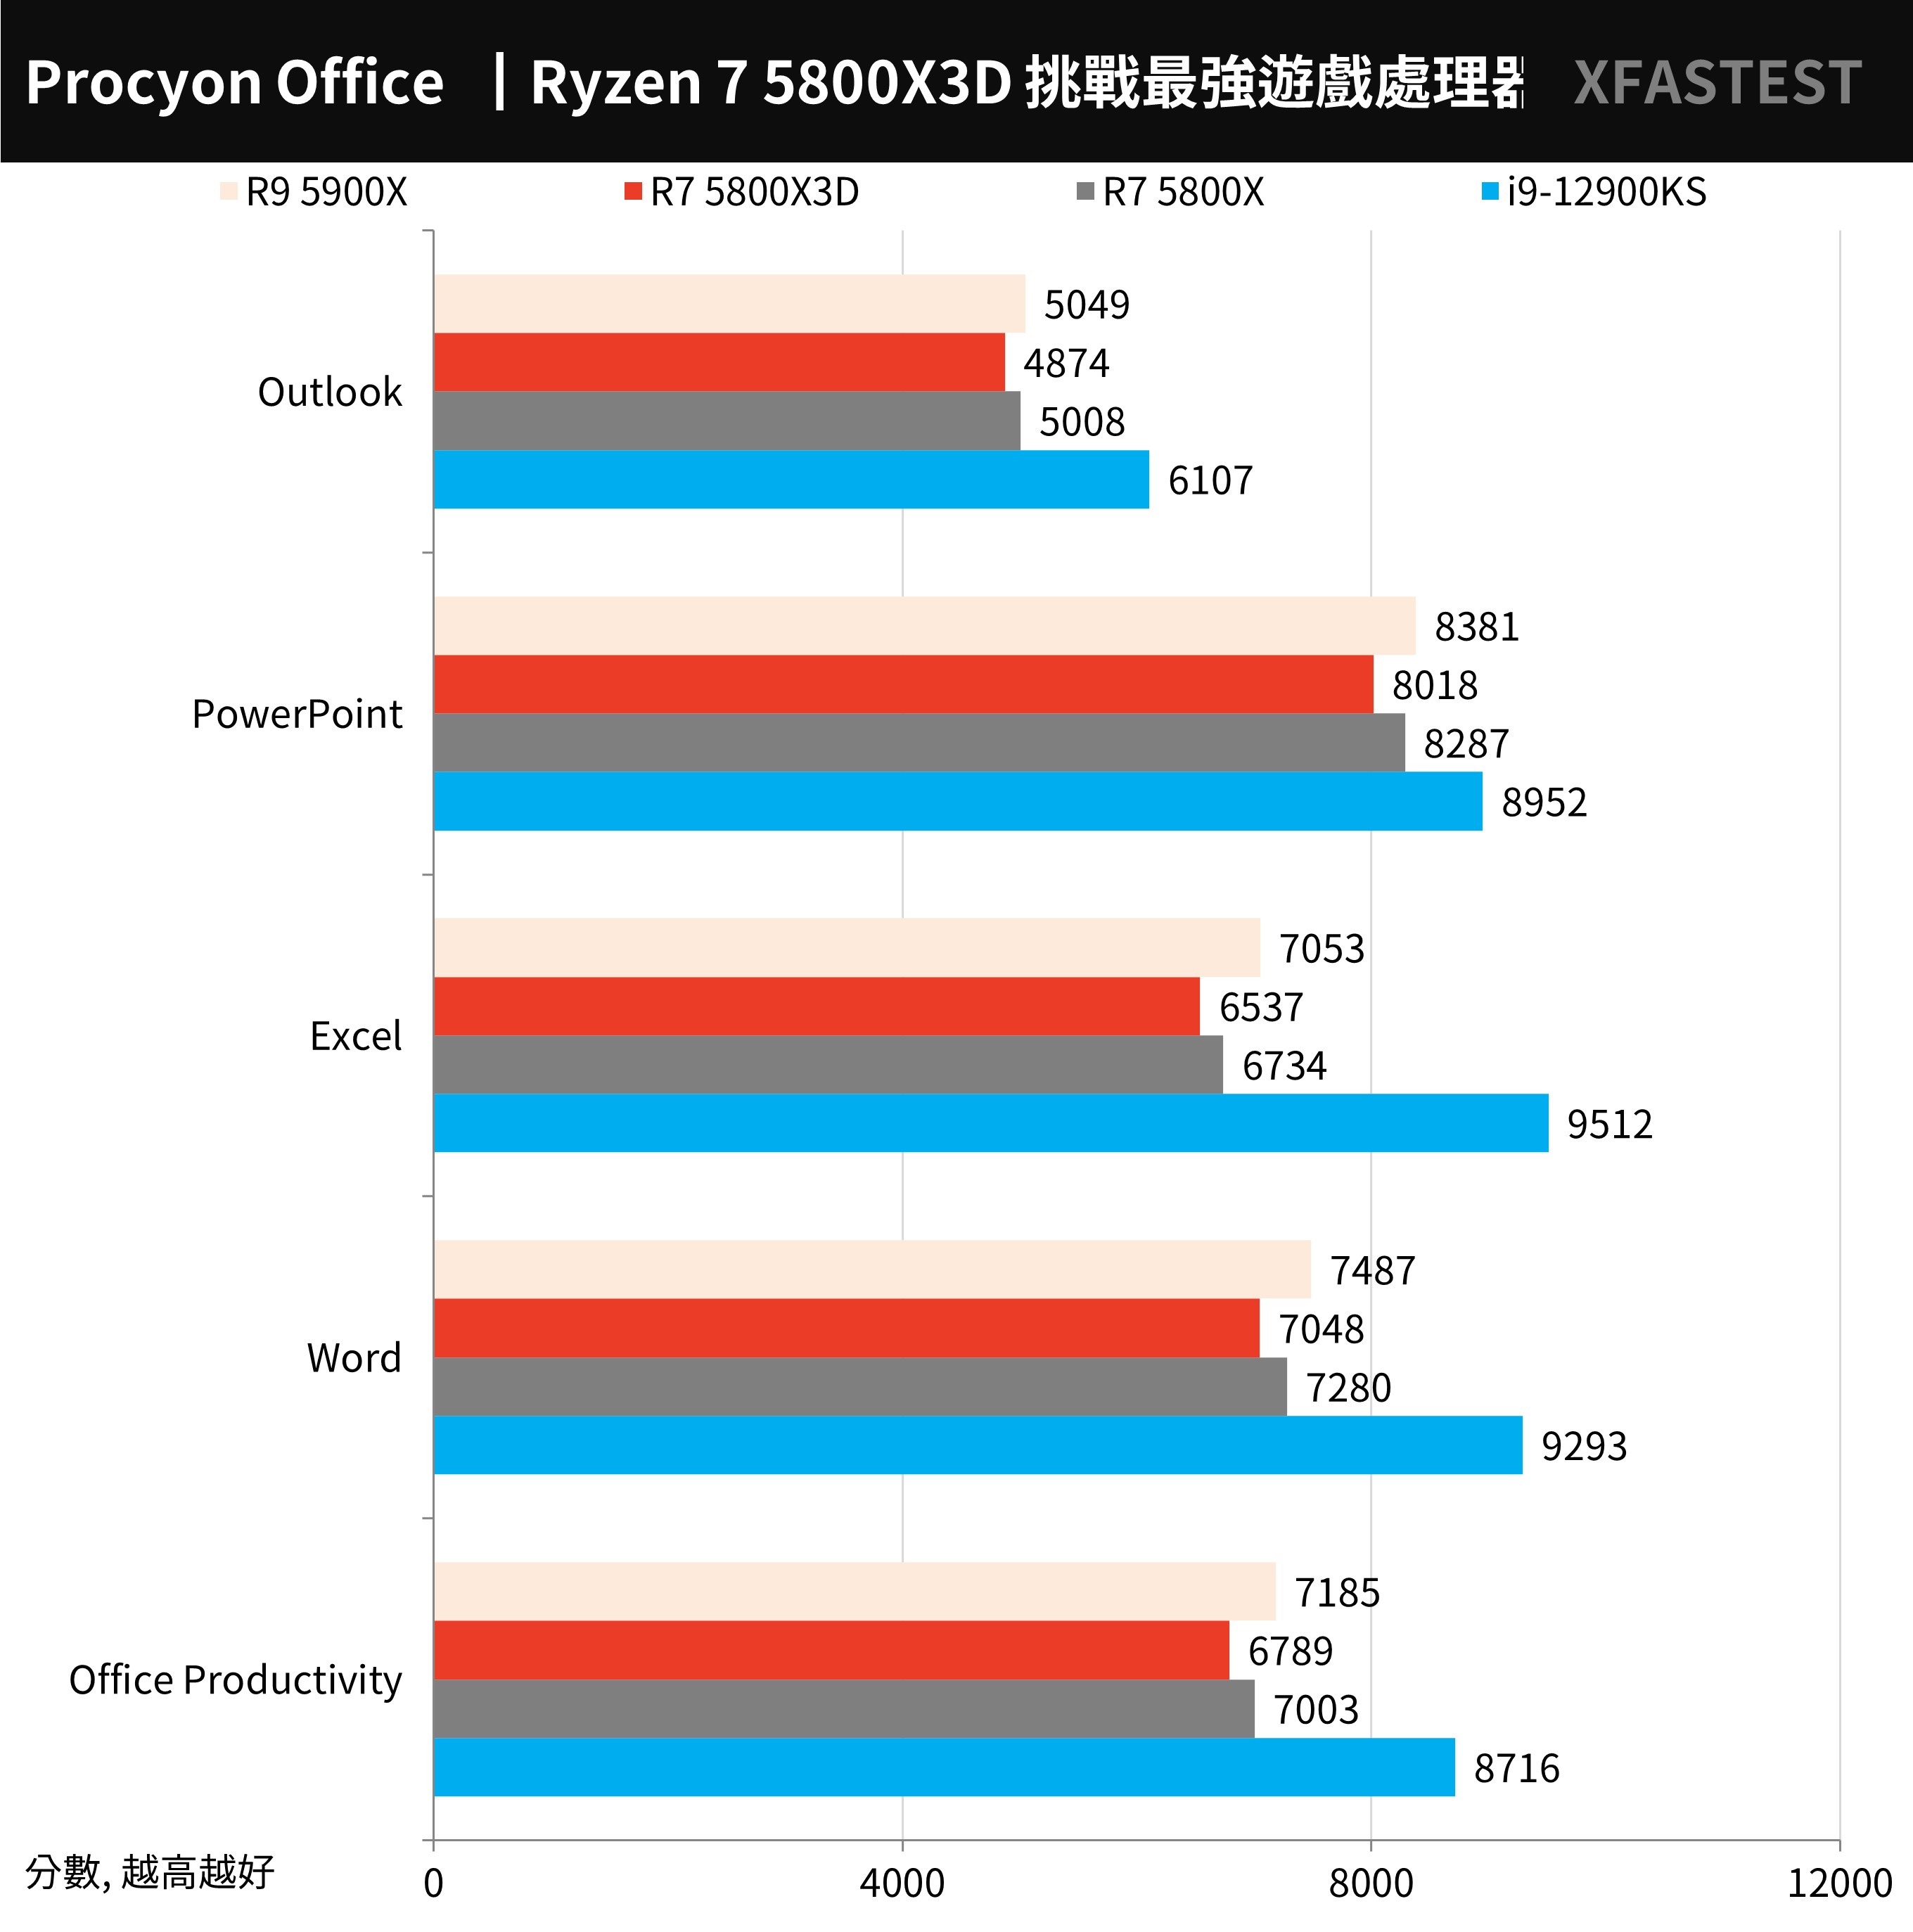
↑ UL Procyon Office, the higher the score, the better.
Ryzen 7 5800X3D processor temperature and power consumption test
From the above test, we can see that the Ryzen 7 5800X3D can achieve 11% in 1080p games with 96MB L3 cache. It is even better than the Xiaochao i9-12900KS, but why does AMD reduce the clock of the 5800X3D to make the CPU How about a small loss to the 5800X in terms of computing, rendering, computer and creative performance?
In fact, the answer is quite obvious. The 5800X3D uses 3D V-Cache technology to stack L3Die on the core CCX. In other words, the heat dissipation of the core needs to pass through the upper L3Die to reach the top cover of the processor. Therefore, AMD reduces the clock to let the 5800X3D There is no critical temperature upper limit in use.
In terms of stress test, ROG STRIX LC II 280mm water-cooled radiator was used in the test to compare AIDA64 CPU, FPU and Cinebench R23 10min burn-in; for general computer use, the temperature performance was close to the AIDA64 CPU test, while the FPU test was the highest load and Higher power consumption.
The 5800X3D reached 69°C in the AIDA64 CPU stress test, which is comparable to the 5800X, but the 5800X3D clock of 4.55GHz is lower than the 4.66GHz of the 5800X; also under the FPU stress test, the 5800X3D was pressed at a temperature of 90°C, but the clock was only 4.3GHz compared to The 4.53GHz of the 5800X is lower.
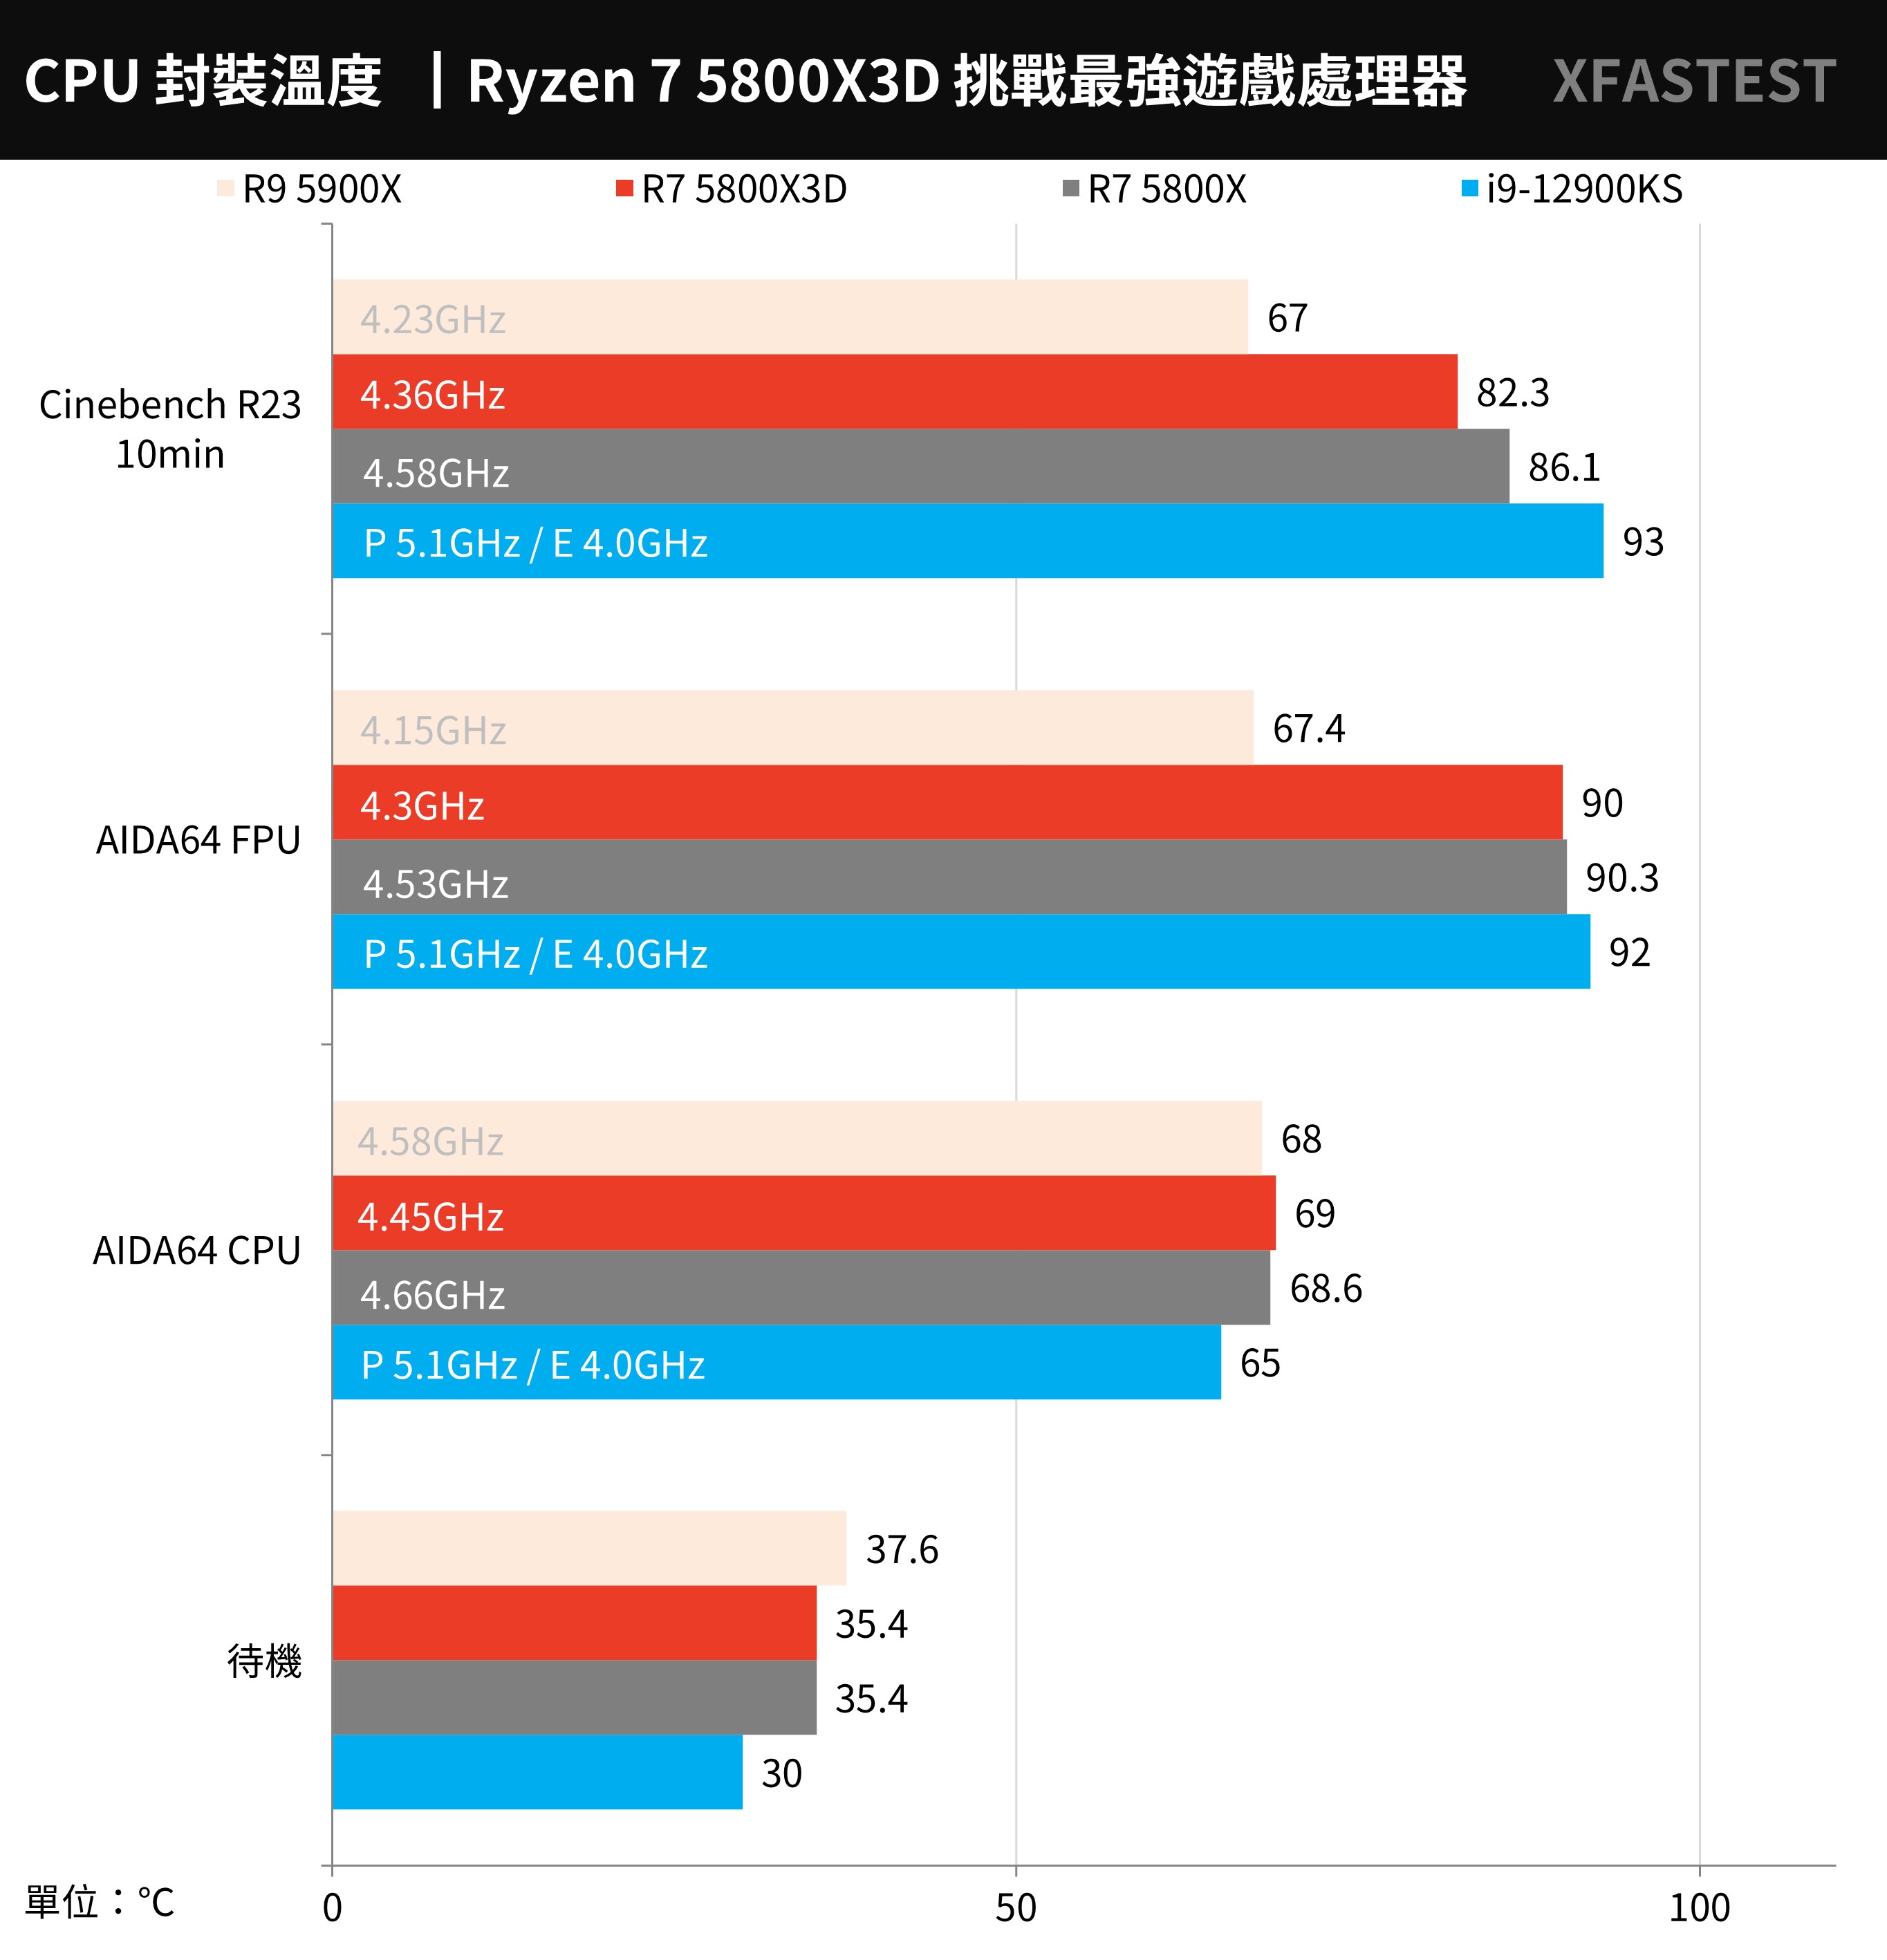
↑ CPU temperature test.
The CPU power consumption is mainly based on CPU Package Power. The AIDA64 CPU test power consumption of 5800X3D reaches 85W and FPU 116W. After all, the power consumption is also reduced when the clock frequency is low, but even if more L3Die is added, it will not increase too much. Too much power consumption.
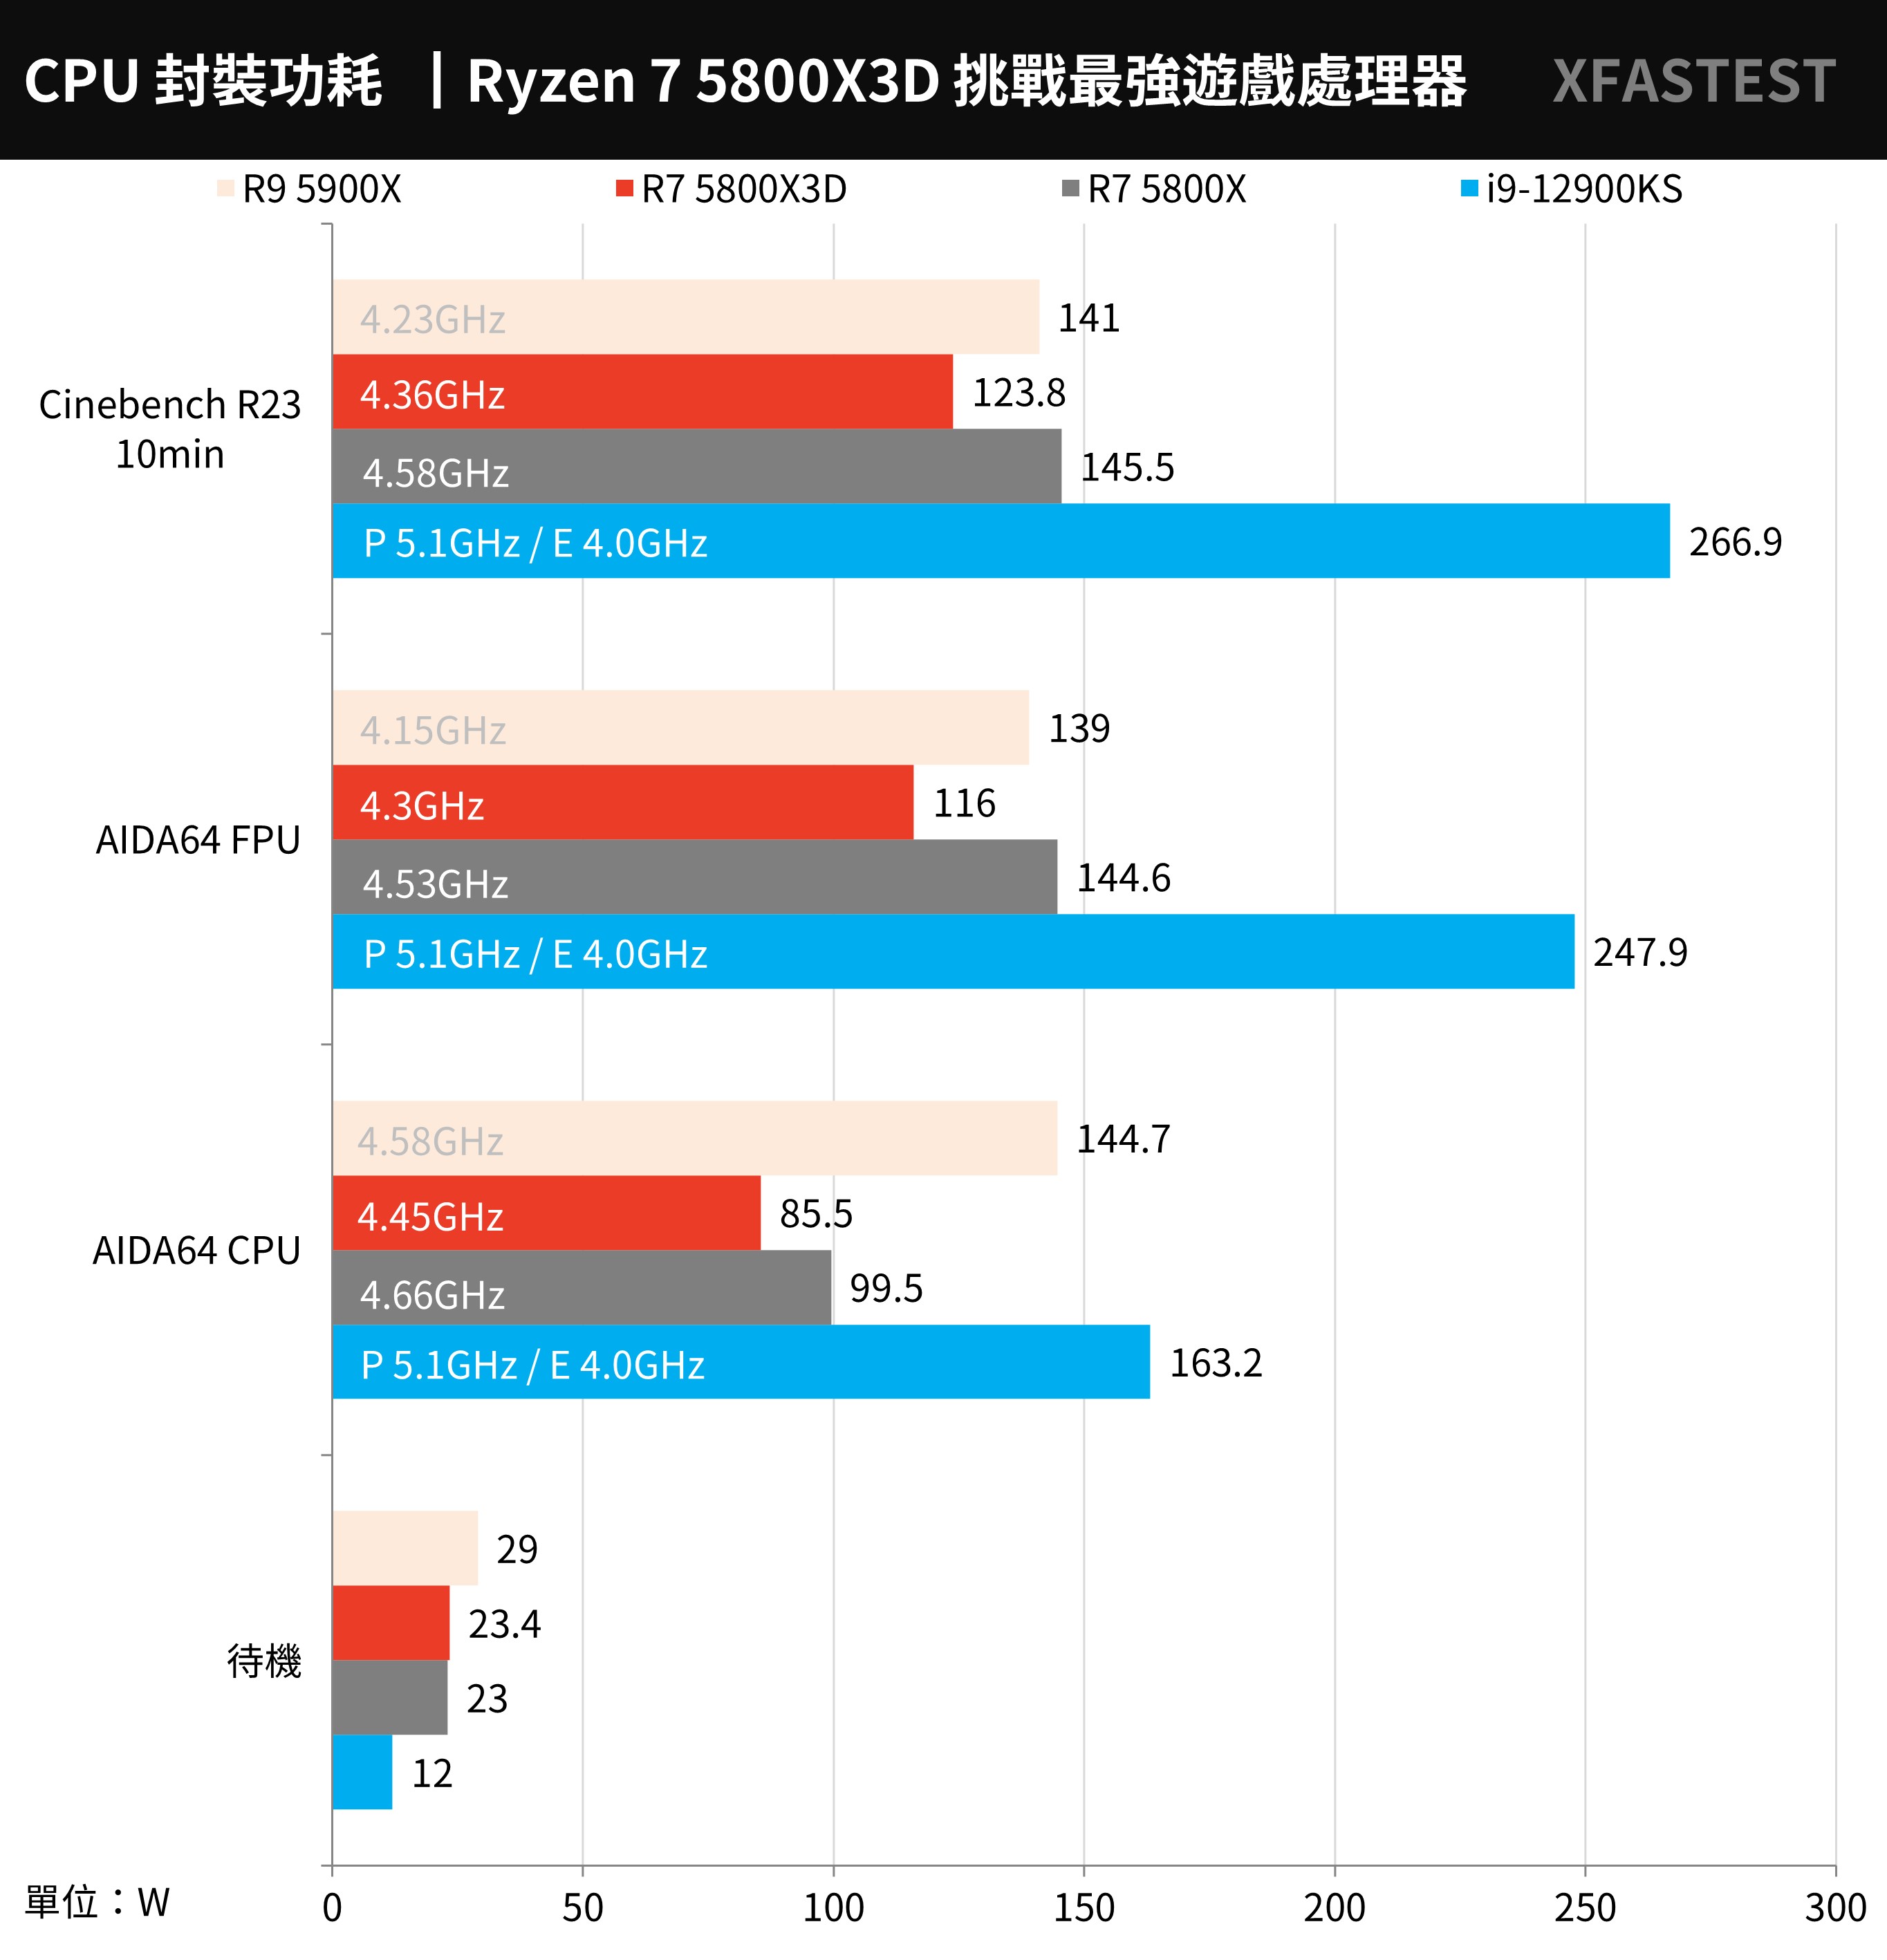
↑ CPU power consumption test.
Summarize
Is AMD Ryzen 7 5800X3D the most powerful gaming processor? From the test, it is true that in 9 AAA games, the 5800X3D has an average performance of 172.2 FPS, which is better than the 170.1 FPS of the i9-12900KS, and has an 11% increase in game performance compared to the 5900X.
However, there are also games that prefer a high clock, or the performance difference for the CPU is less obvious, so the results may be slightly different depending on the number and type of games tested.
As far as the game performance improvement is concerned, the 3D V-Cache of the 5800X3D is really powerful. If you are a 1080p gamer, the 5800X3D is indeed better in terms of game performance and price. If the Taiwan price is the same as the 5800X at $8,790, this 1080p game performance improvement is indeed Not bad, but relatively must sacrifice clock and overclocking playability.
However, what makes the author more interested is the debut of Zen 4 and the new platform in the second half of the year, when the processor war will be more lively.
Further reading: