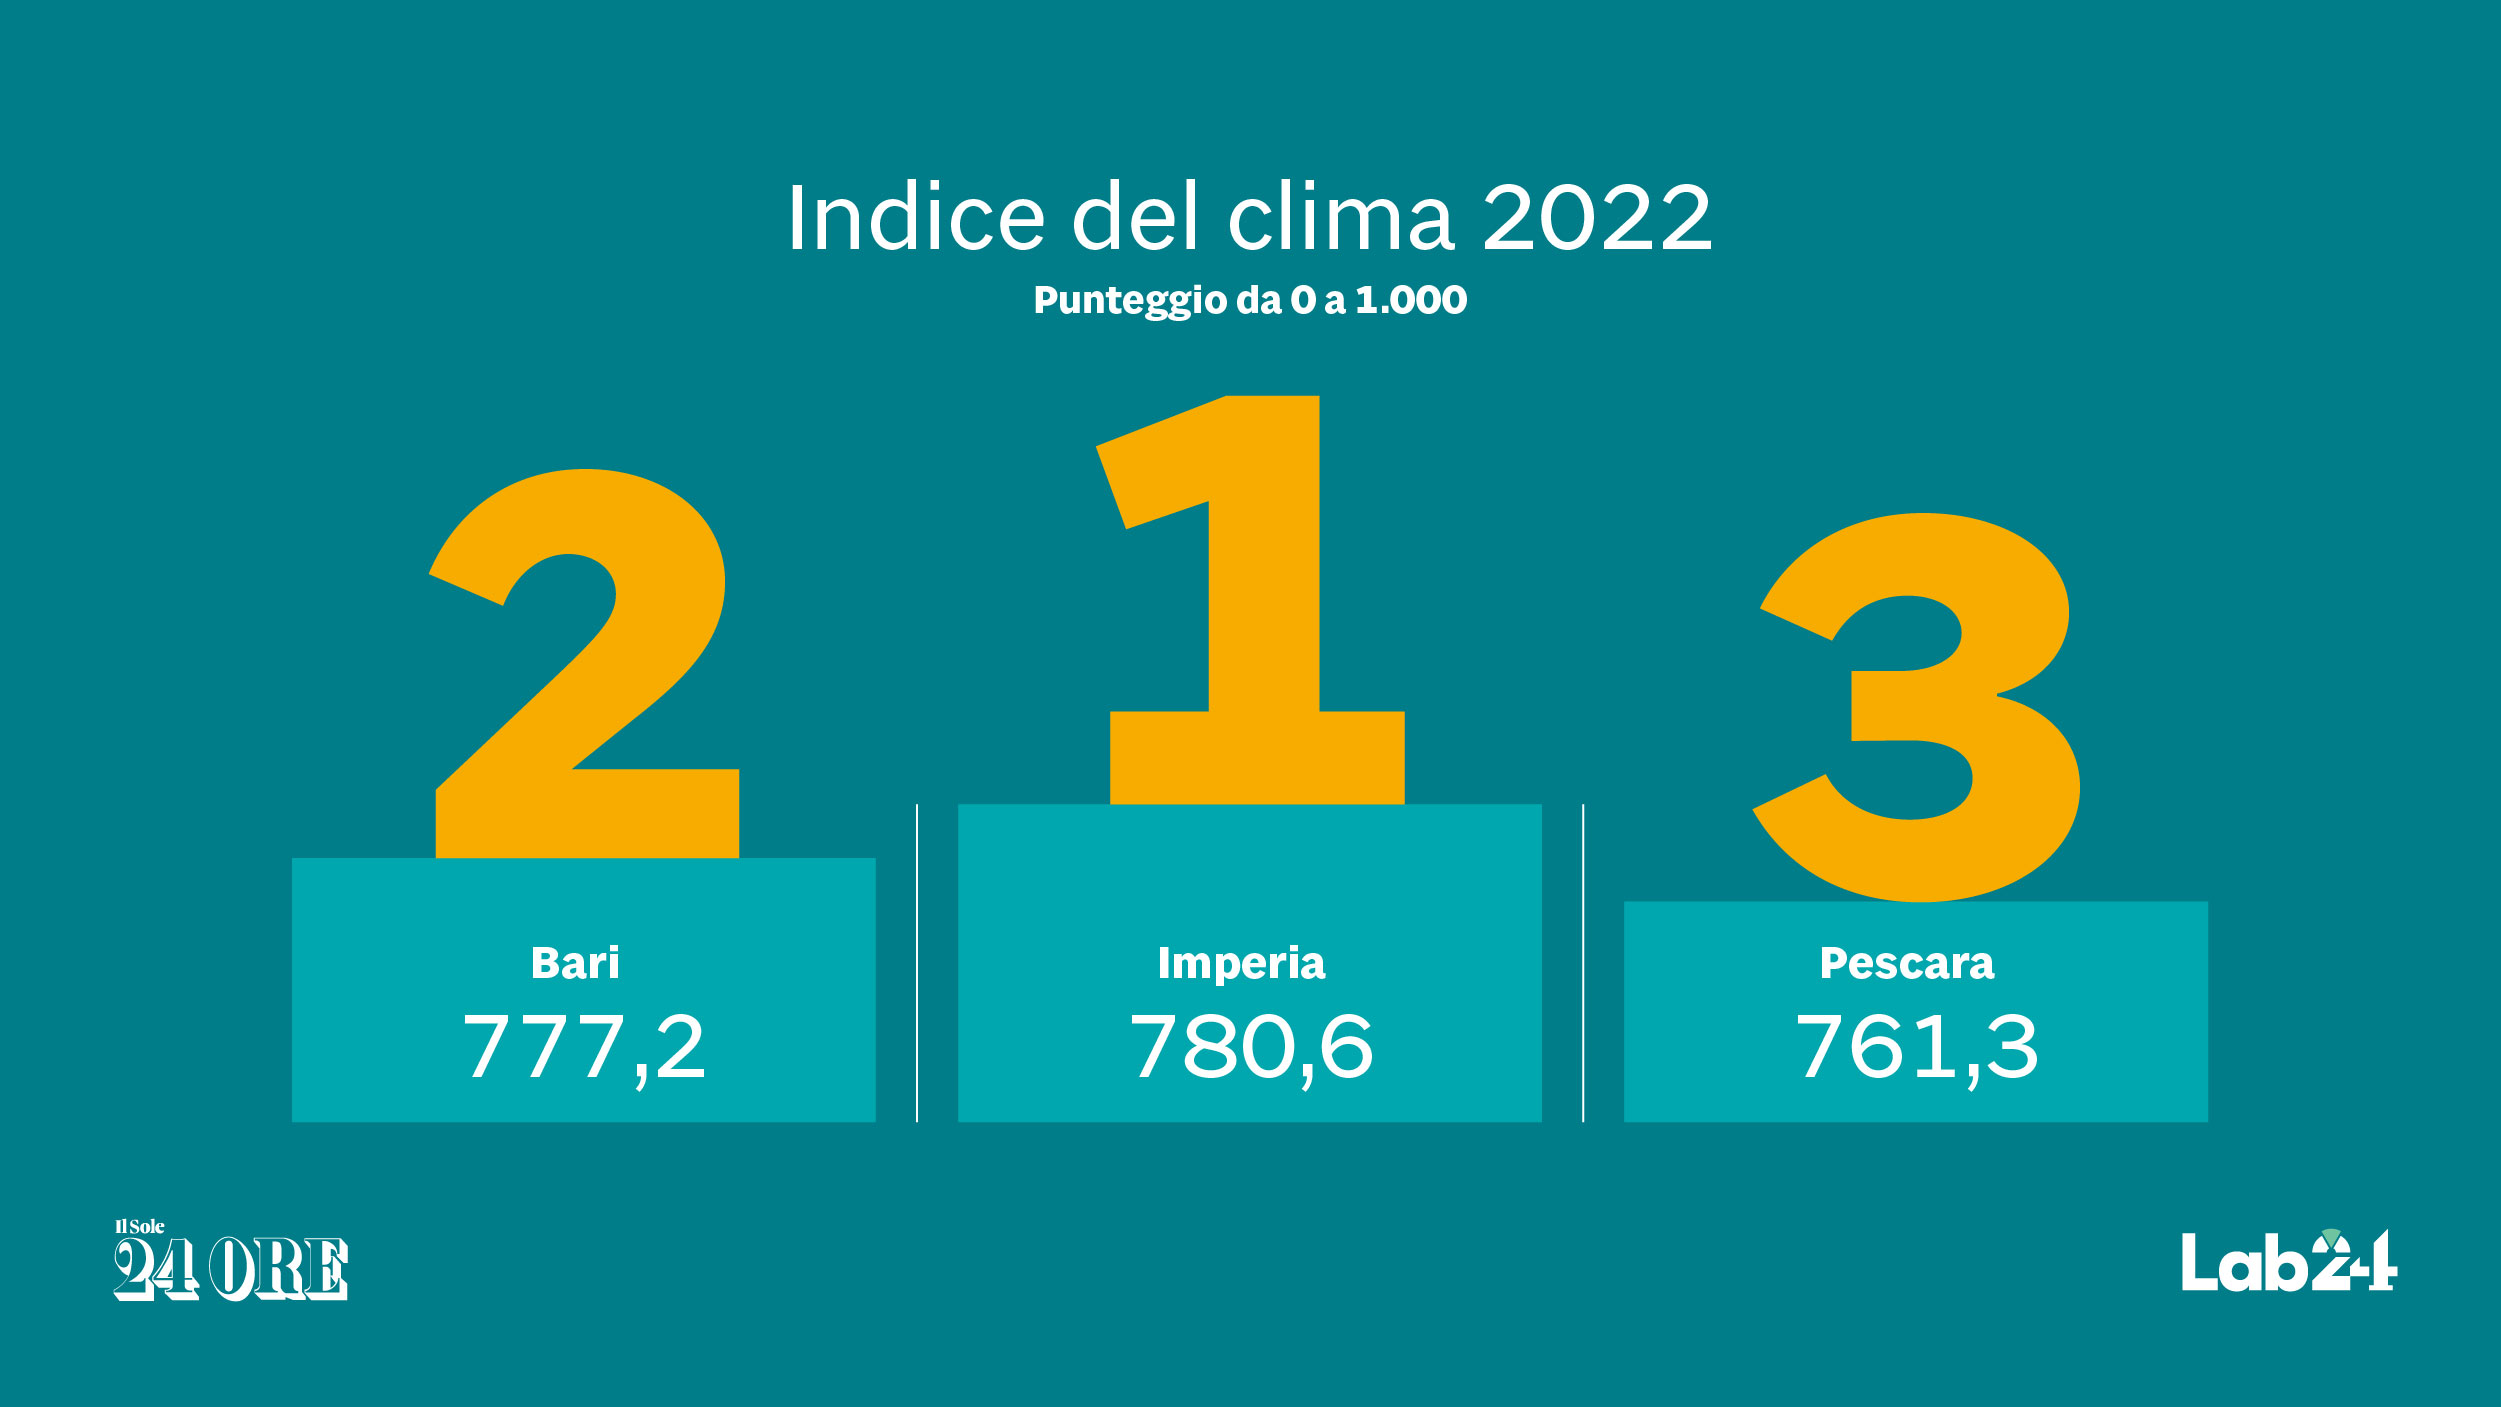
The first three provinces ranked. You can choose the podium for the general ranking or the one for the individual items (sun, wind, rain, etc.). To select point the individual bars on the podium, or use the menu at the top of the page.
The first three provinces ranked. You can choose the podium for the general ranking or the one for the individual items (sun, wind, rain, etc.). To select use the menu at the top of the page. Tap the individual bars to see the gauge data. Press and hold if you want the ranking for individual items.
The teeth of the wheel indicate the rankings. Choose or write the province in the top menu, or by aiming for the ranking. Below on the right are the main data of the province.
The teeth of the wheel indicate the positions in the standings. Choose or write the province in the top menu, or by aiming for the ranking. Below are the main data of the province.
Slide 1
Slide 1
Slide 1
Slide 1
Slide 1
Slide 1
Slide 1
Slide 1
Slide 1
Slide 1
Pesaro-Urbino
Indicator
Citta
Position
107
Value
Explains
13244
Score
13244
Find out the performance of the province for each indicator. You can change the province in the top menu.
Pesaro-Urbino
Find out how the provinces are positioned according to the indicator. You can change the province and the entry in the top menu. The size of the circle on the cities indicates the position in the relative ranking.
Indicator
Citta
Position
107
Value
Explains
13244
Score
13244
The provinces in the mirror. In the menu above, choose which ones you want to compare. You will be able to see the differences in climate well-being for each item.
Methodological notes:
The final ranking of the 107 provincial capital municipalities is the result of the average of the scores obtained by the different cities in the 10 climate indicators taken into consideration, validated by the 3Bmeteo team of meteorologists. For each parameter, the daily, annual or ten-year average value recorded in each city was calculated, starting from the meteorological data collected for six-hour bands over the period 2011-2021. Thus, for each ranking, one thousand points were awarded to the city with the best value. The score drops, depending on the distance from the first classified, to zero attributed to the last position. Some indicators are considered positive (the higher the value the better the performance of the city) others are considered negative (the lower the value the better). The data that unite several urban centers (Pesaro and Urbino, Barletta-Andria-Trani, Massa Carrara, Forlì Cesena), are the result of the average of the values referred to the individual cities.
– In heat waves, several consecutive days of heat are considered as multiples of three (e.g. 30 consecutive days are considered as 10 waves)
– For the relative humidity, the average daily data was calculated first, then the days outside the climatic comfort parameters
– The perceived temperature also takes into account humidity and wind
– In places at high altitude (> 350m above sea level) a reduction of 20% was applied assuming an overestimation of the source data
