
AMD launched the Ryzen 7000X3D processor update with 3D V-Cache. This generation launched 7950X3D, 7900X3D and 7800X3D high-core options at one go, so that gamers who love 1080p can rely on the large L3 cache to achieve 17% performance in games Improvement, but relative stacking cache on the core also lowers the processor clock speed slightly, and the multi-core performance decreases slightly by -5%, but in exchange for better power consumption performance, the strongest game processor will once again be powered by the Ryzen 7000X3D Takeover.
AMD Expands 3D V-Cache Series: 7950X3D, 7900X3D and 7800X3D
AMD Ryzen 7000X3D processor adopts Zen 4 micro-architecture, 5nm process, AM5 new platform and DDR5 memory, and uses “3D V-Cache” packaging technology to stack 64MB L3 cache on the core chip CCX to improve 1080p resolution degree of gaming performance.
The difference between Ryzen 7950X3D, 7900X3D and 7800X3D processors and the general X version lies in the L3 cache capacity, the difference between the default and Boost clocks, and the TDP reduction. First of all, the 7950X3D still has 16 cores and 32 threads, 128MB L3 cache, 4.2/5.7GHz clock speed, 120W TDP, and the price is the same as the 7950X at $699.
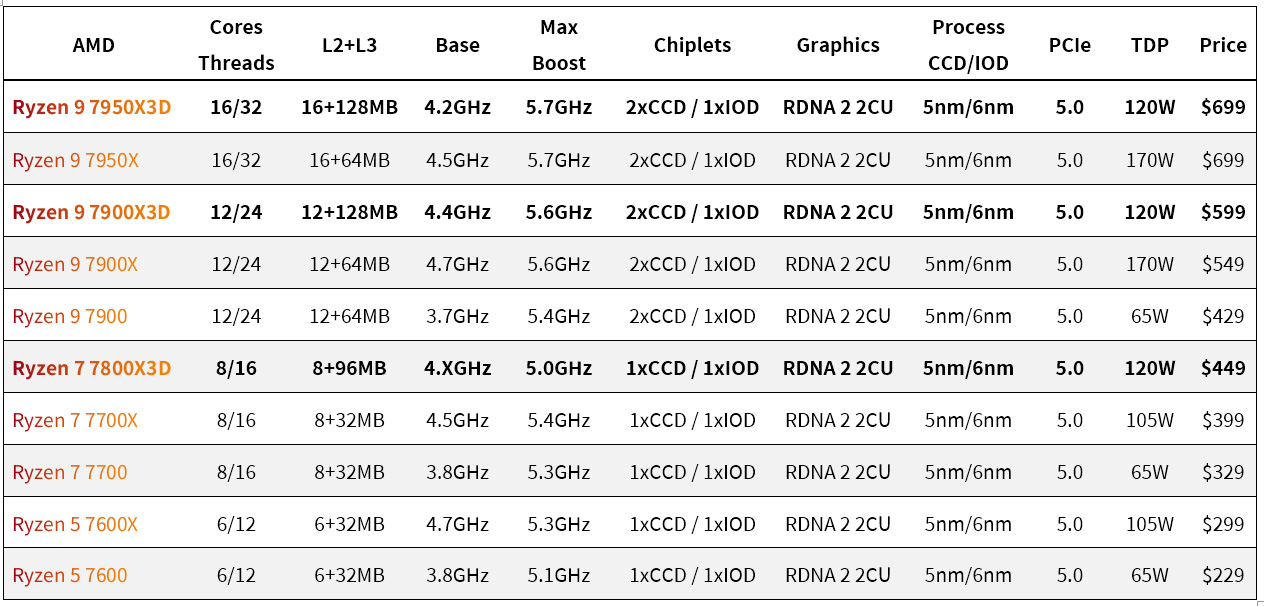
↑ Ryzen 7000X, X3D processor specifications.
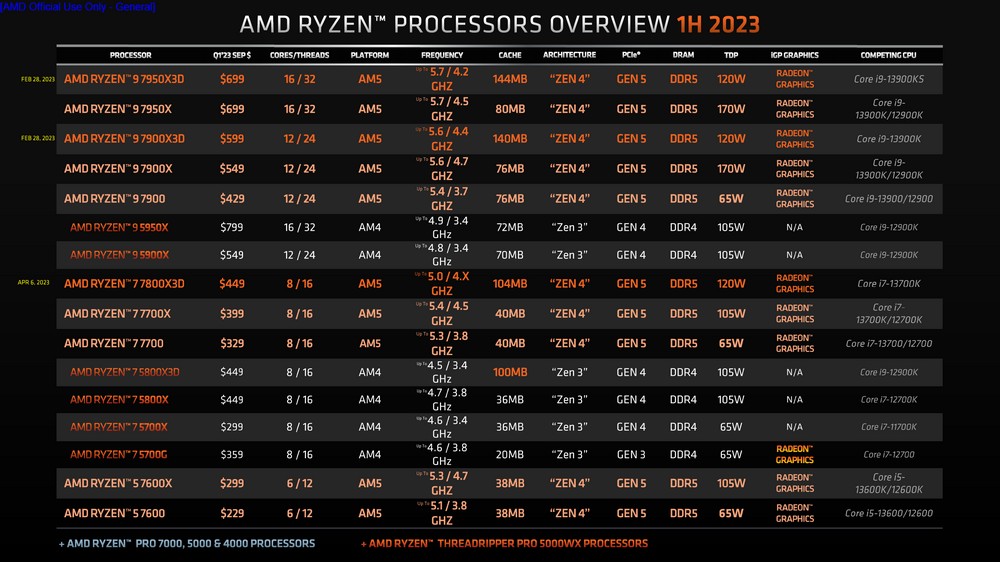
↑ Ryzen 5000, 7000 and rivals marked.
The 7900X3D has 12 cores, 24 threads, 128MB L3 cache, 4.4/5.6GHz clock speed, and 120W TDP. The US price is $599, which is slightly higher than the 7900X, about $50; as for the 7800X3D, which will not be launched until April 6, it is 8 Core 16 execution threads, 96MB L3 cache, 4.X/5.0GHz clock frequency, 120W TDP, priced at $449 in US dollars.
The first wave of Ryzen 7950X3D and 7900X3D will go on sale at 10:00 pm on 2/28. Interested players can remember to pay attention to the news of the original price house and other channels.
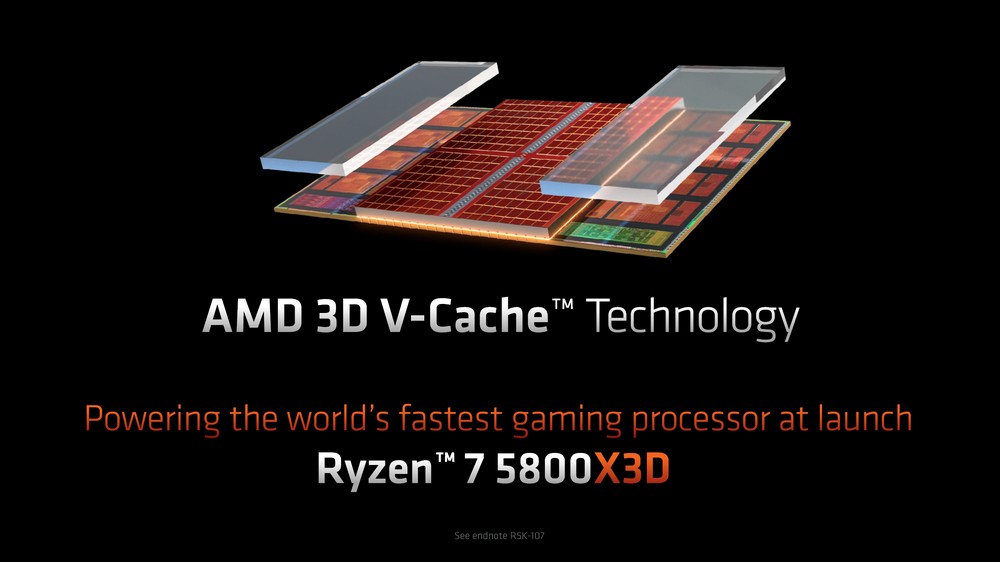
↑ This generation of 3D V-Cache technology has not changed, the same as the previous generation 5800X3D, vertically stacked 64MB L3 cache.
Windows Game Mode, 3D V-Cache optimization and PPM exclusive driver update
This generation of Ryzen 7000X3D processors, because 7950X3D and 7900X3D are both 2x CCD / 1xIOD Chiplets design, but when stacking 3D V-Cache, AMD specially adopts 2 independent CCX configurations, one CCX with 3D V-Cache, the other One is the standard CCX configuration.
AMD mentioned: “Integrating two CCX configurations, the CCX with a very low-latency L3 large cache and the CCX with a higher clock speed, the overall cost will be more cost-effective than two CCXs equipped with 3D V-Cache, and can Games are prioritized for CCXs with 3D V-Cache, while applications are prioritized for standard CCXs.”
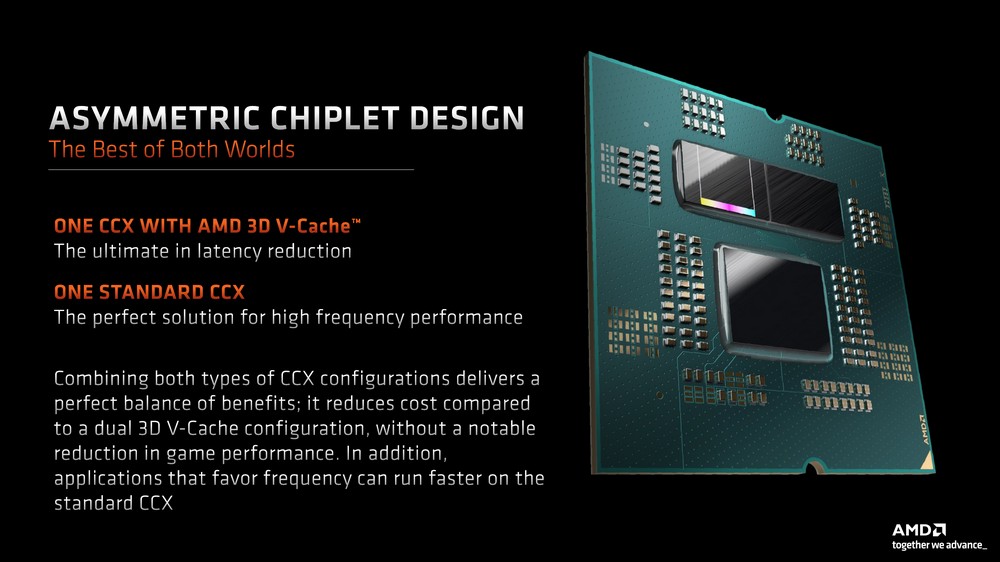
↑ Asymmetric Chiplet Asymmetric small chip design, using standard CCX and CCX with 3D V-Cache.
Two different configurations of CCX mean that it needs to be automatically scheduled through the operating system and drivers. Therefore, when upgrading the Ryzen 7000X3D processor, players must first update the motherboard BIOS and install the latest AMD Chipset Drivers, which includes AMD PPM Provisioning File Driver and AMD 3D V-Cache Performance Optimizer Driver updated.
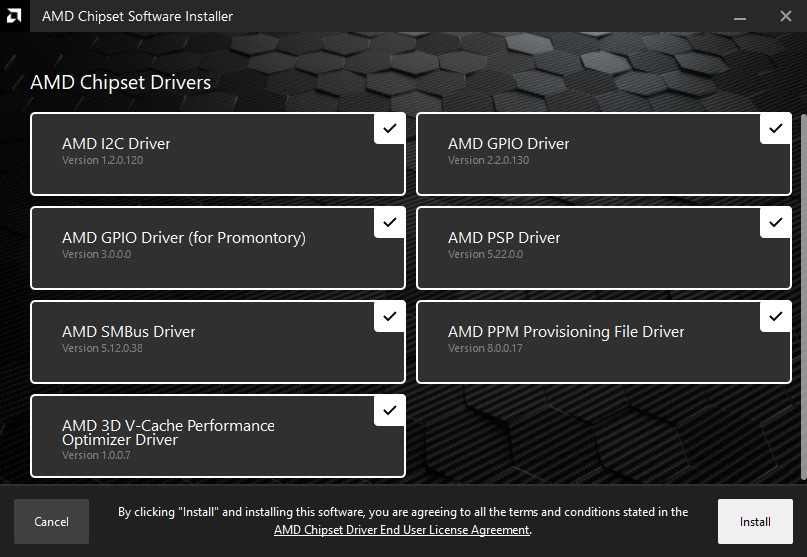
↑ AMD Chipset Drivers Update.
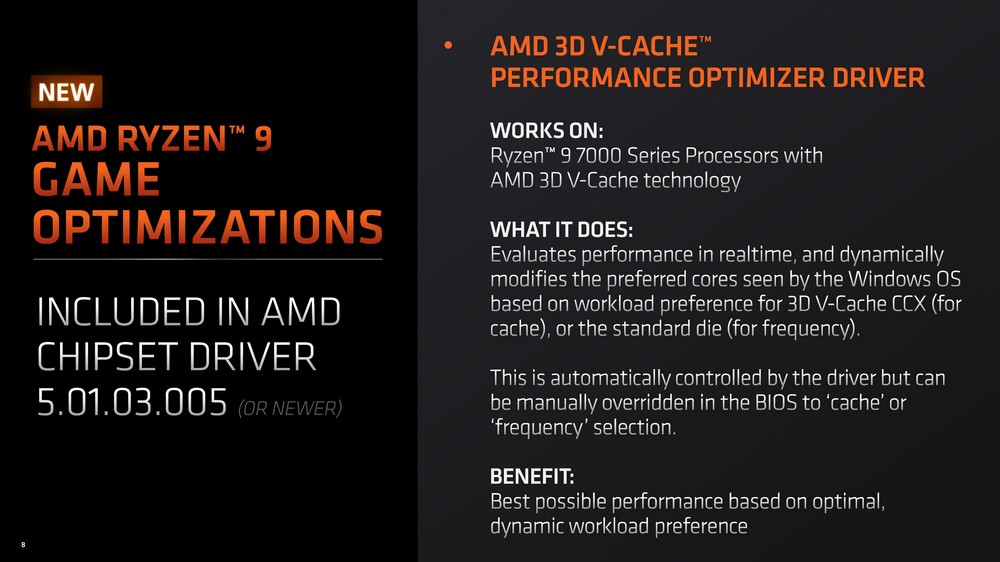
↑ Performance Optimizer Driver, which can automatically allocate 3D V-Cache CCX or general CXX according to the workload of the OS.
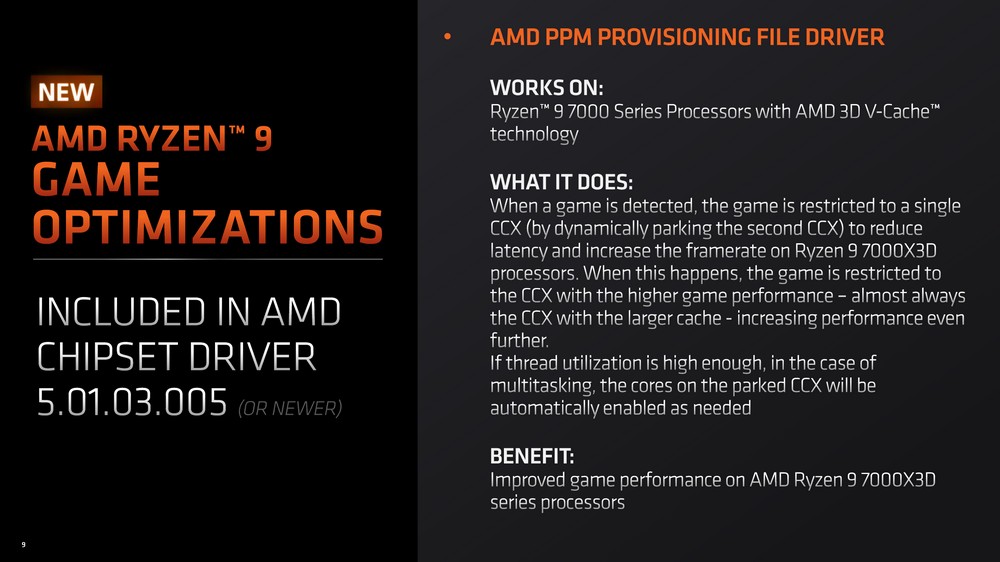
↑ PPM Provisioning File Driver, which can uniformly hand over the game to a single 3D V-Cache CCX for execution, ensuring low latency between cores.
In addition, when using it, please turn on the Game Mode mode that is enabled by default in Windows. If it is judged by the operating system that the game is being executed, the workload will be given priority to the CCX with 3D V-Cache, so that the multi-threading of the game has the lowest delay, and If it is a general application program, it is preferred to use the general CCX to execute.
At the same time, players are also requested to update the Xbox Game Bar app, and this judgment is made by the Microsoft app.
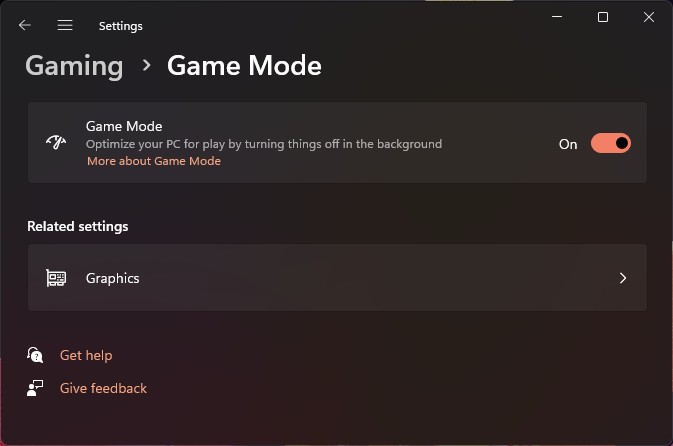
↑ Windows Game Mode must be enabled.
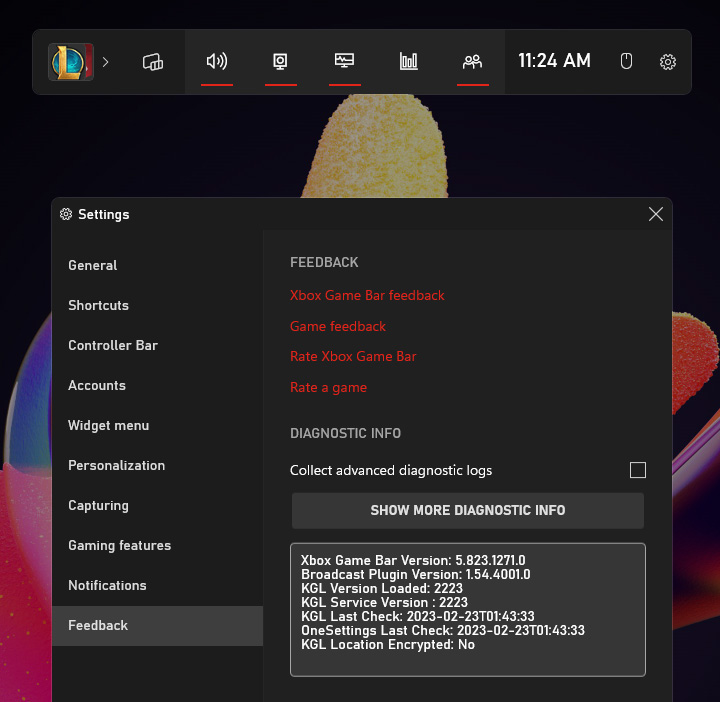
↑ Please also remember to update to the latest version of the Xbox Game Bar app.
Test platform and settings
This test mainly focuses on the game performance of AMD Ryzen 9 7950X3D, and compares Intel Core i9-13900K and AMD Ryzen 9 7950X, 5800X3D processors; the radiator uses AIO 360mm water-cooled radiator uniformly, and is set to the motherboard default Auto unlock Power consumption limit, using DDR5-6000 EXPO memory; the test platform is provided as follows for your reference.
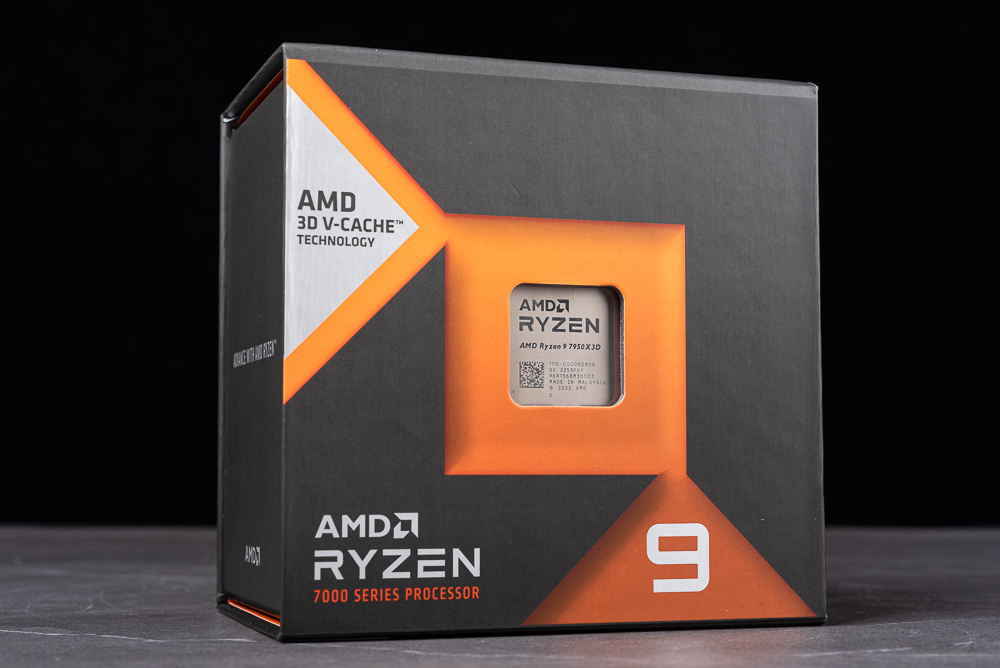
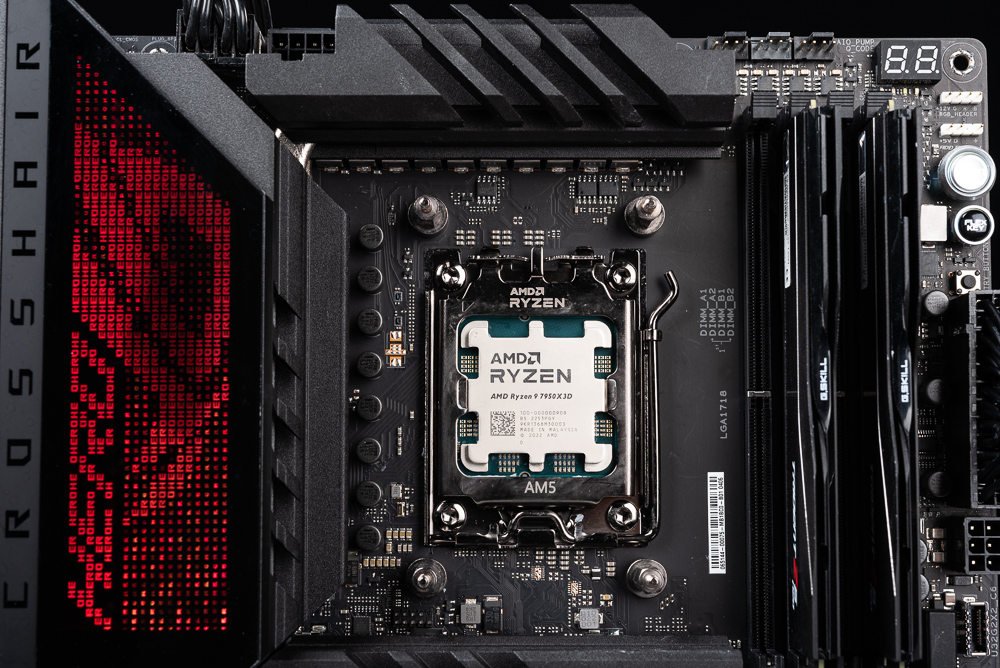
↑ AMD Ryzen 9 7950X packaging.
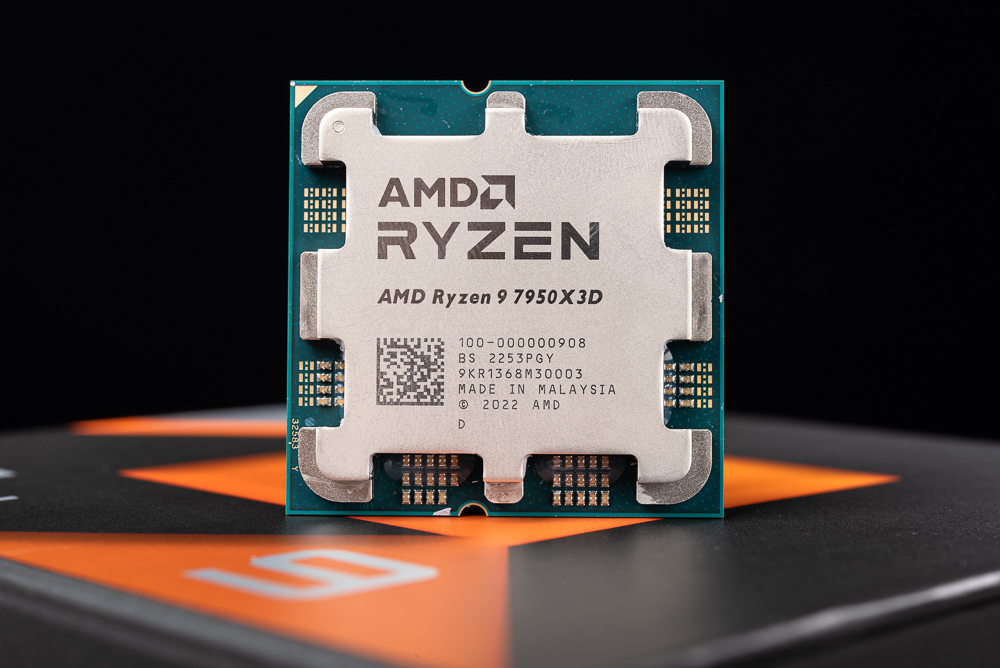
↑ AMD Ryzen 9 7950X。
testing platform
Processor: AMD Ryzen 9 7950X3D/7950X, Intel Core i9-13900K, Ryzen 7 5800X3D
Motherboard: ROG CROSSHAIR X670E HERO, ASRock Z790 Taichi, ROG Crosshair VIII Dark Hero
Memory: G.SKILL TRIDENT Z5 NEO DDR5-6000 16GBx2
Graphics Card: NVIDIA GeForce RTX 4090
System drive: Solidigm P41 Plus 1TB PCIe 4.0 SSD
Radiator: 360mm AIO liquid cooler
Power supply: Seasonic PRIME PX-1000
OS: Windows 11 Pro 22H2
CPU-Z Check the AMD Ryzen 9 7950X3D processor information, code-named Raphael, 5nm process, TDP 120W, with 16 cores, 32 threads, the tested motherboard is ROG CROSSHAIR X670E HERO, and the memory is DDR6 6000 16GBx2.
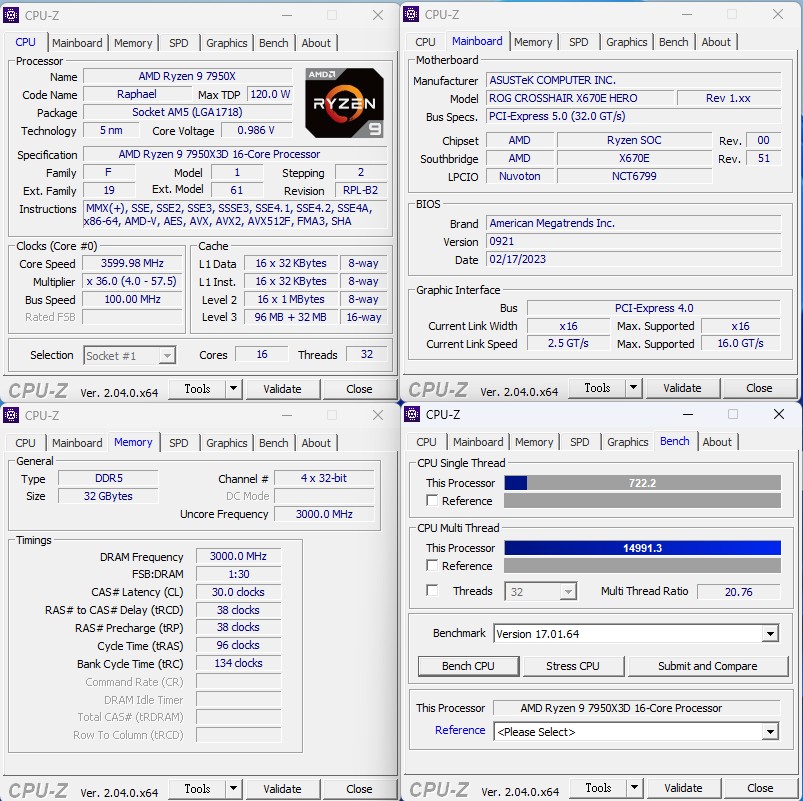
↑ CPU-Z。
Processor computing performance Cinebench, VRay rendering test
CINEBENCH R20developed by MAXON based on Cinema 4D, can be used to evaluate the 3D rendering performance of computer processors. It is also a reliable test software that can quickly evaluate the performance of CPU multi-core computing.
nT multi-threaded 7950X3D achieved a score of 14000 points, 1T single-threaded 791 points, compared with 7950X multi-core reduced -6.5%, single-threaded performance is equivalent, but compared with i9-13900K is multi-core output -9.5%, Single-threaded loss -8.9%.
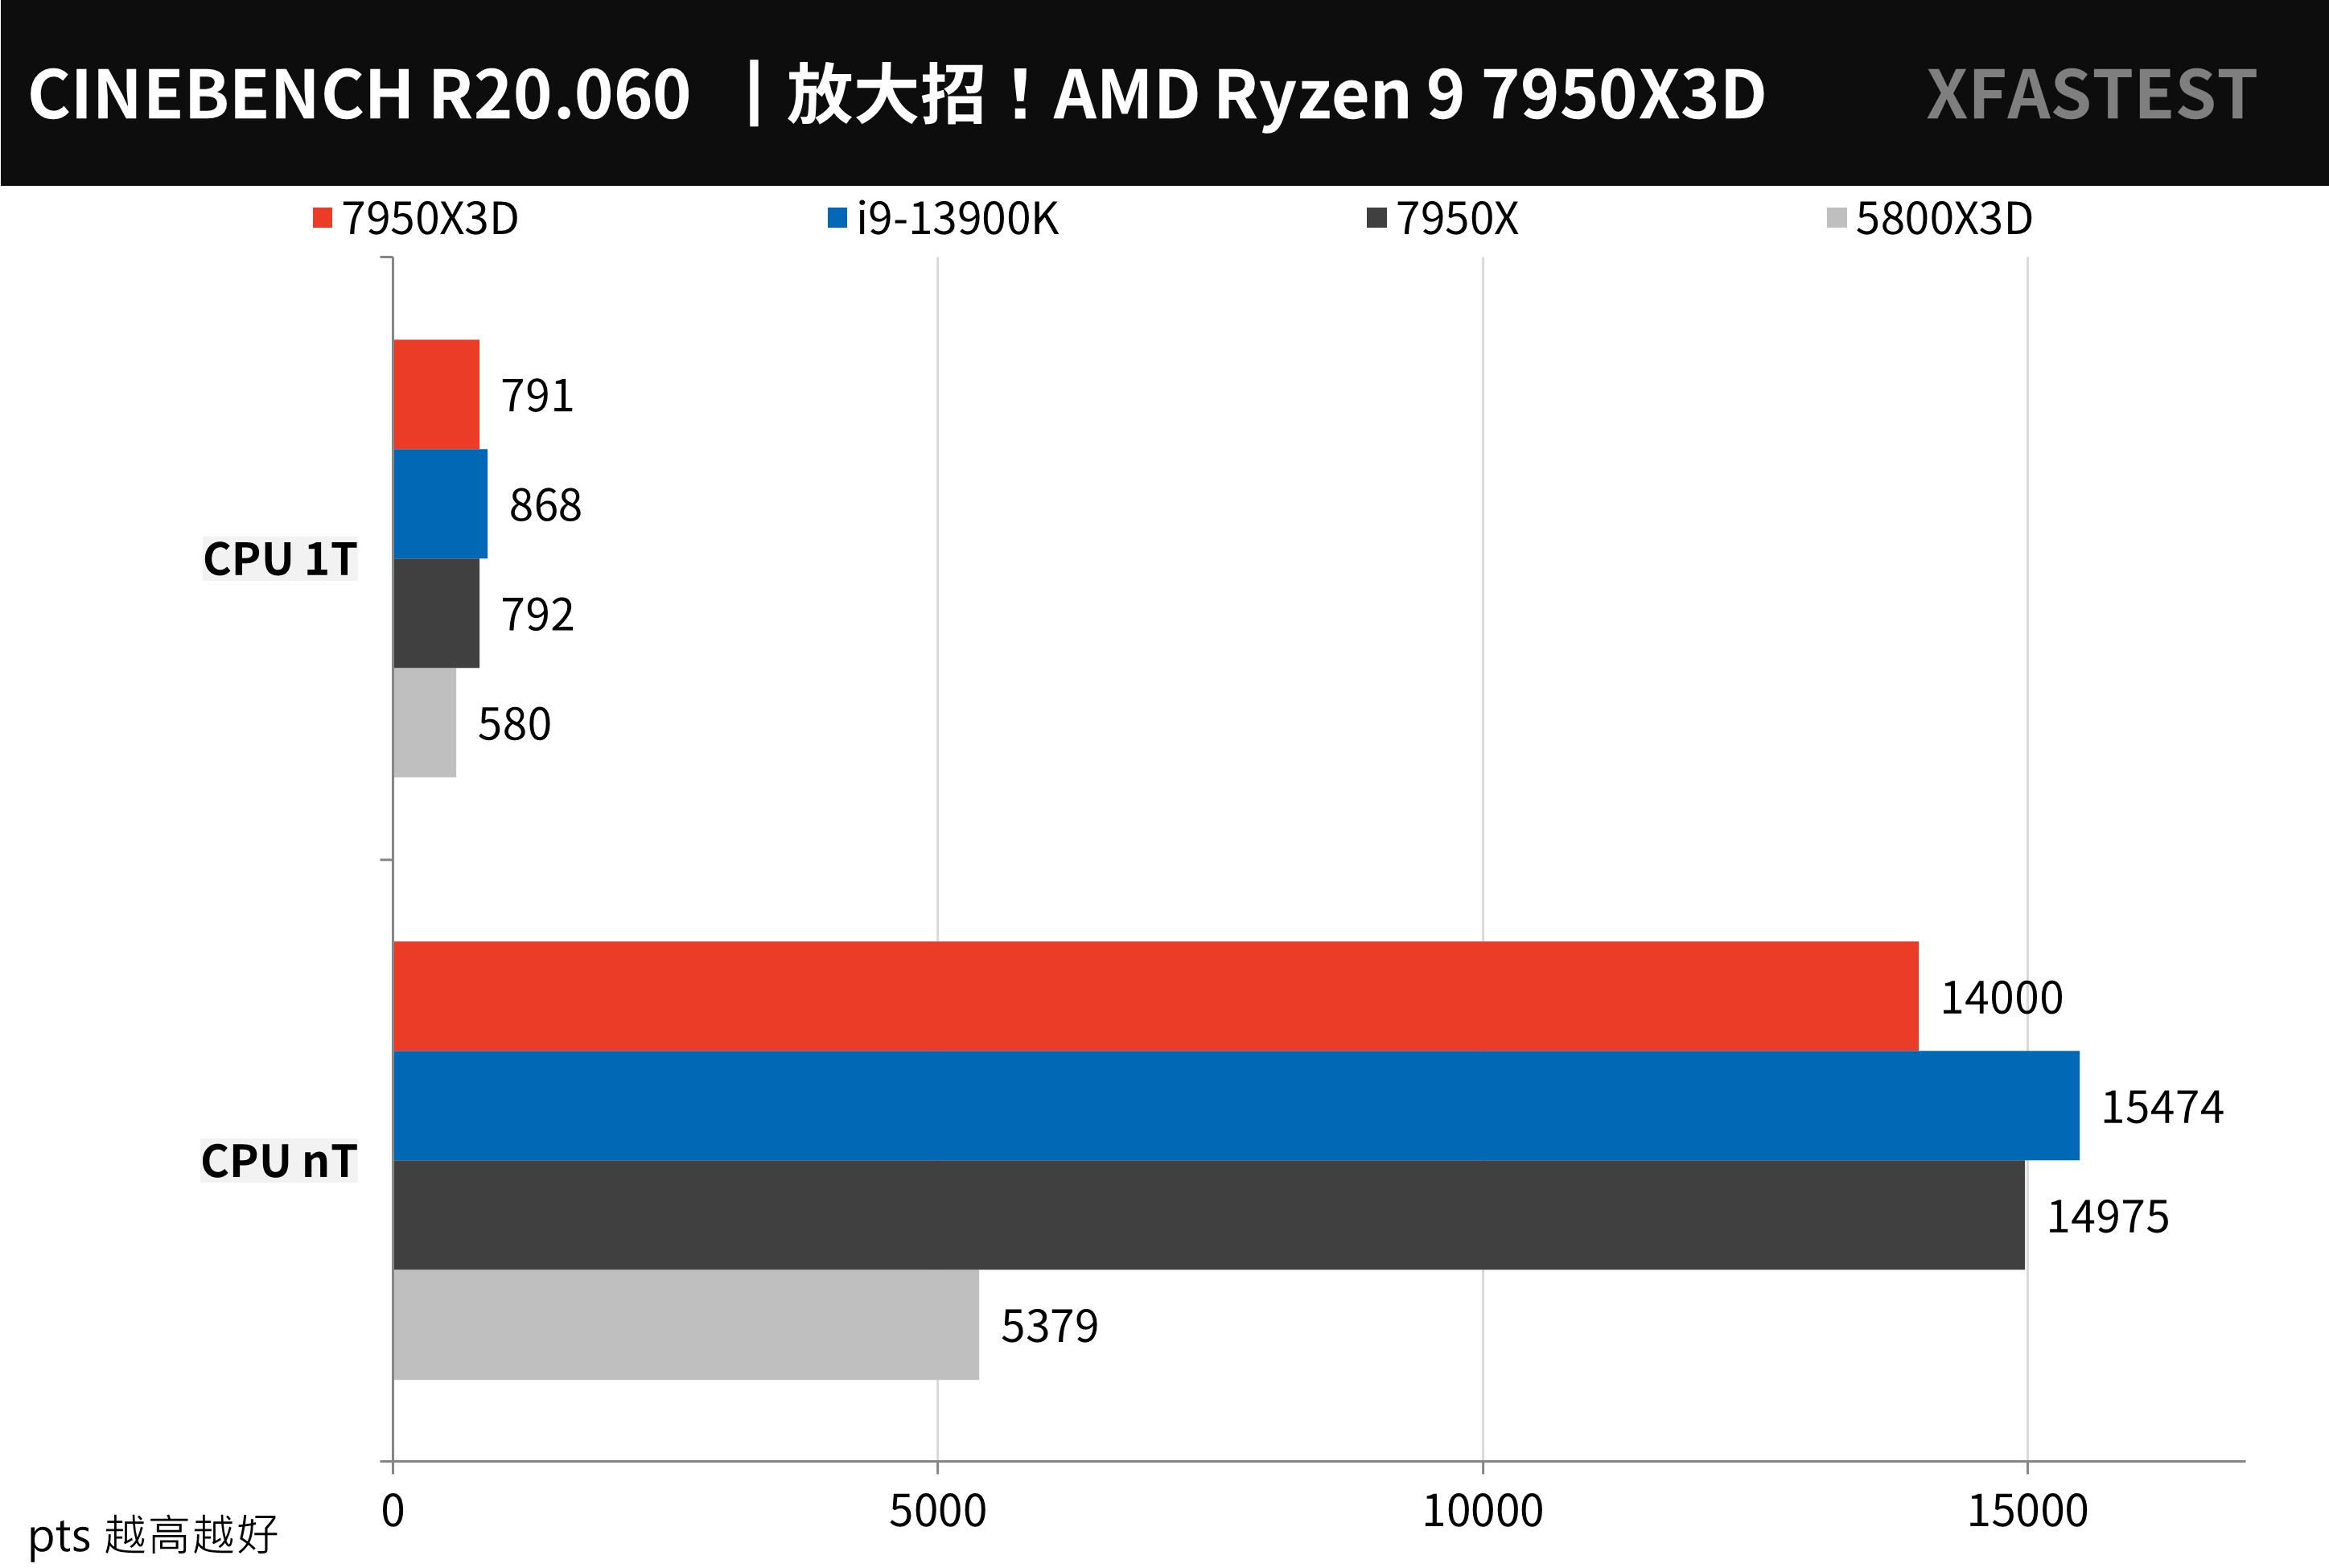
↑ CINEBENCH R20, the higher the better.
CINEBENCH R23 The test scenario is the same as R20, with a new compiler and a stress test function. Players can customize the Minimum Test Duration time, such as 10 or 30 minutes to test the stability of the computer; however, the results of R23 cannot be compared with R20.
nT multi-threaded 7950X3D achieved a score of 36294 points, 1T single-threaded 2037 points, compared with 7950X multi-core reduced -5.6%, single-threaded performance is equivalent, but compared with i9-13900K is multi-core output -10.4%, Single-threaded loss -9.3%.
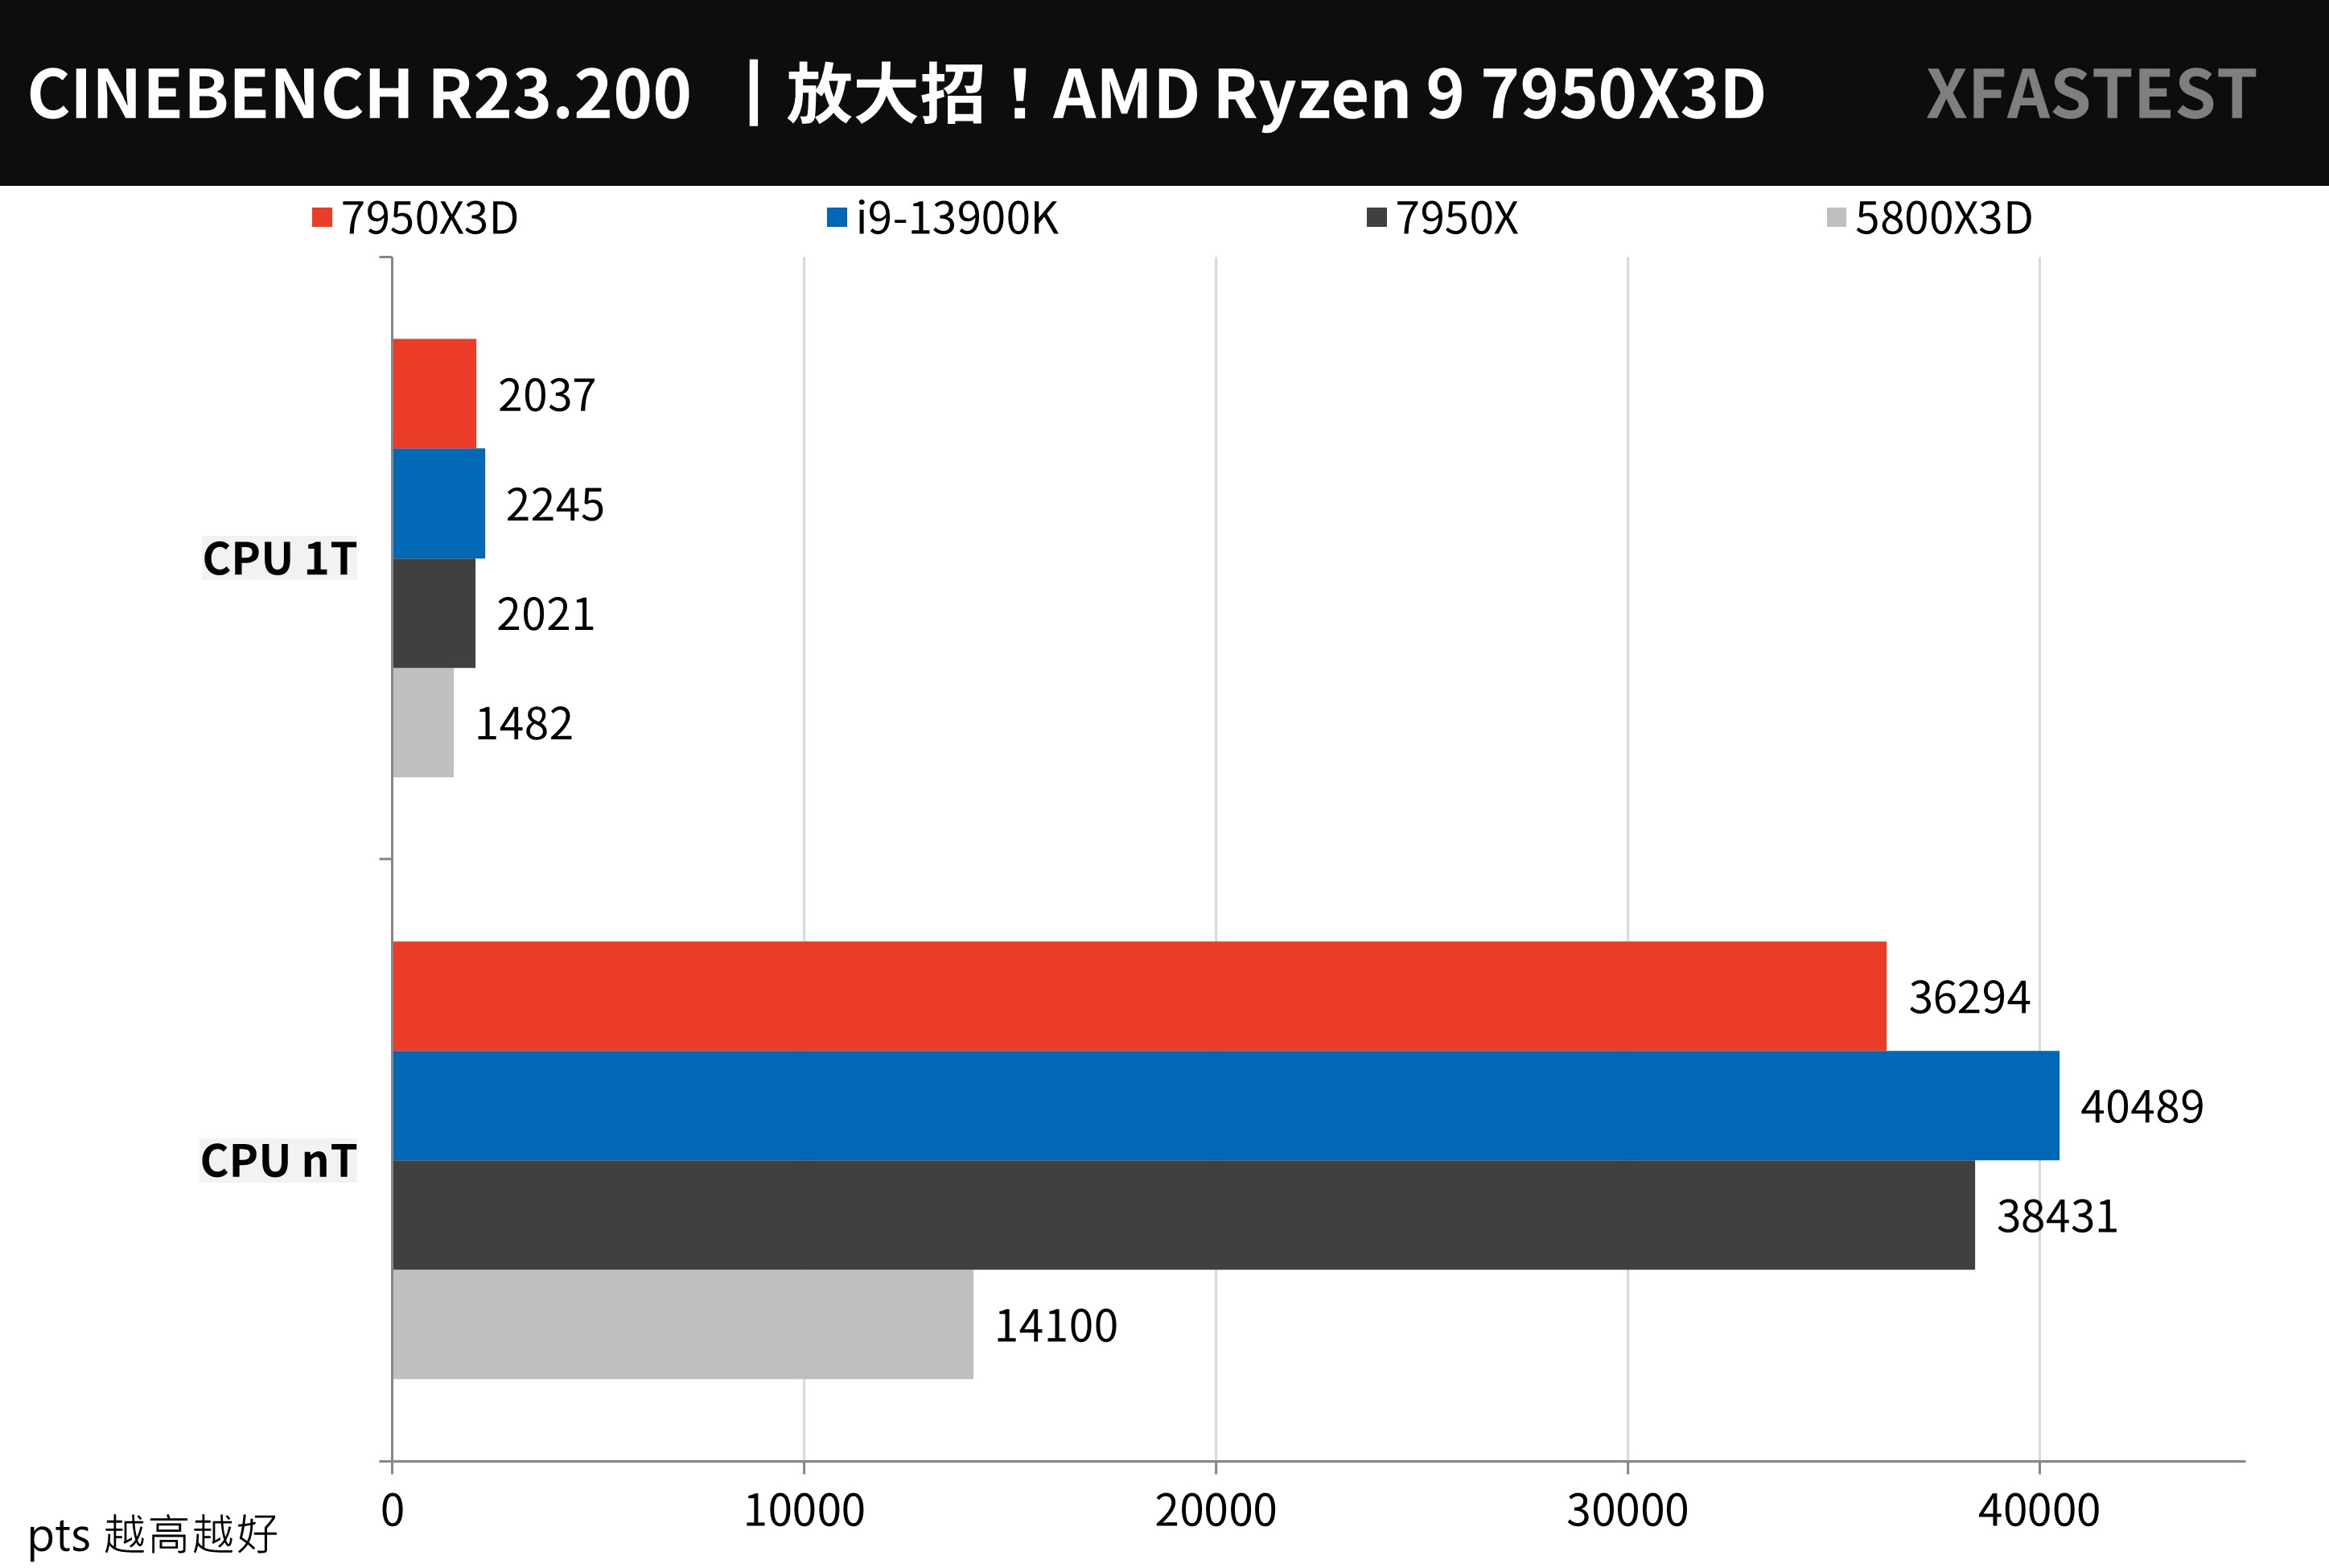
↑ CINEBENCH R23, the higher the better.
V-Ray Benchmark Developed by Chaos Group, V-Ray is a ray rendering software designed based on the laws of physics. This tool can test the computing performance of the rendered image for ray tracing on the CPU. The CPU score is calculated in units of vsamples per second.
The 7950X3D achieved a score of 28639 points. Compared with the 7950X, the computing performance was reduced by -2.9%, but this item was about 4.9% better than the performance of the i9-13900K.
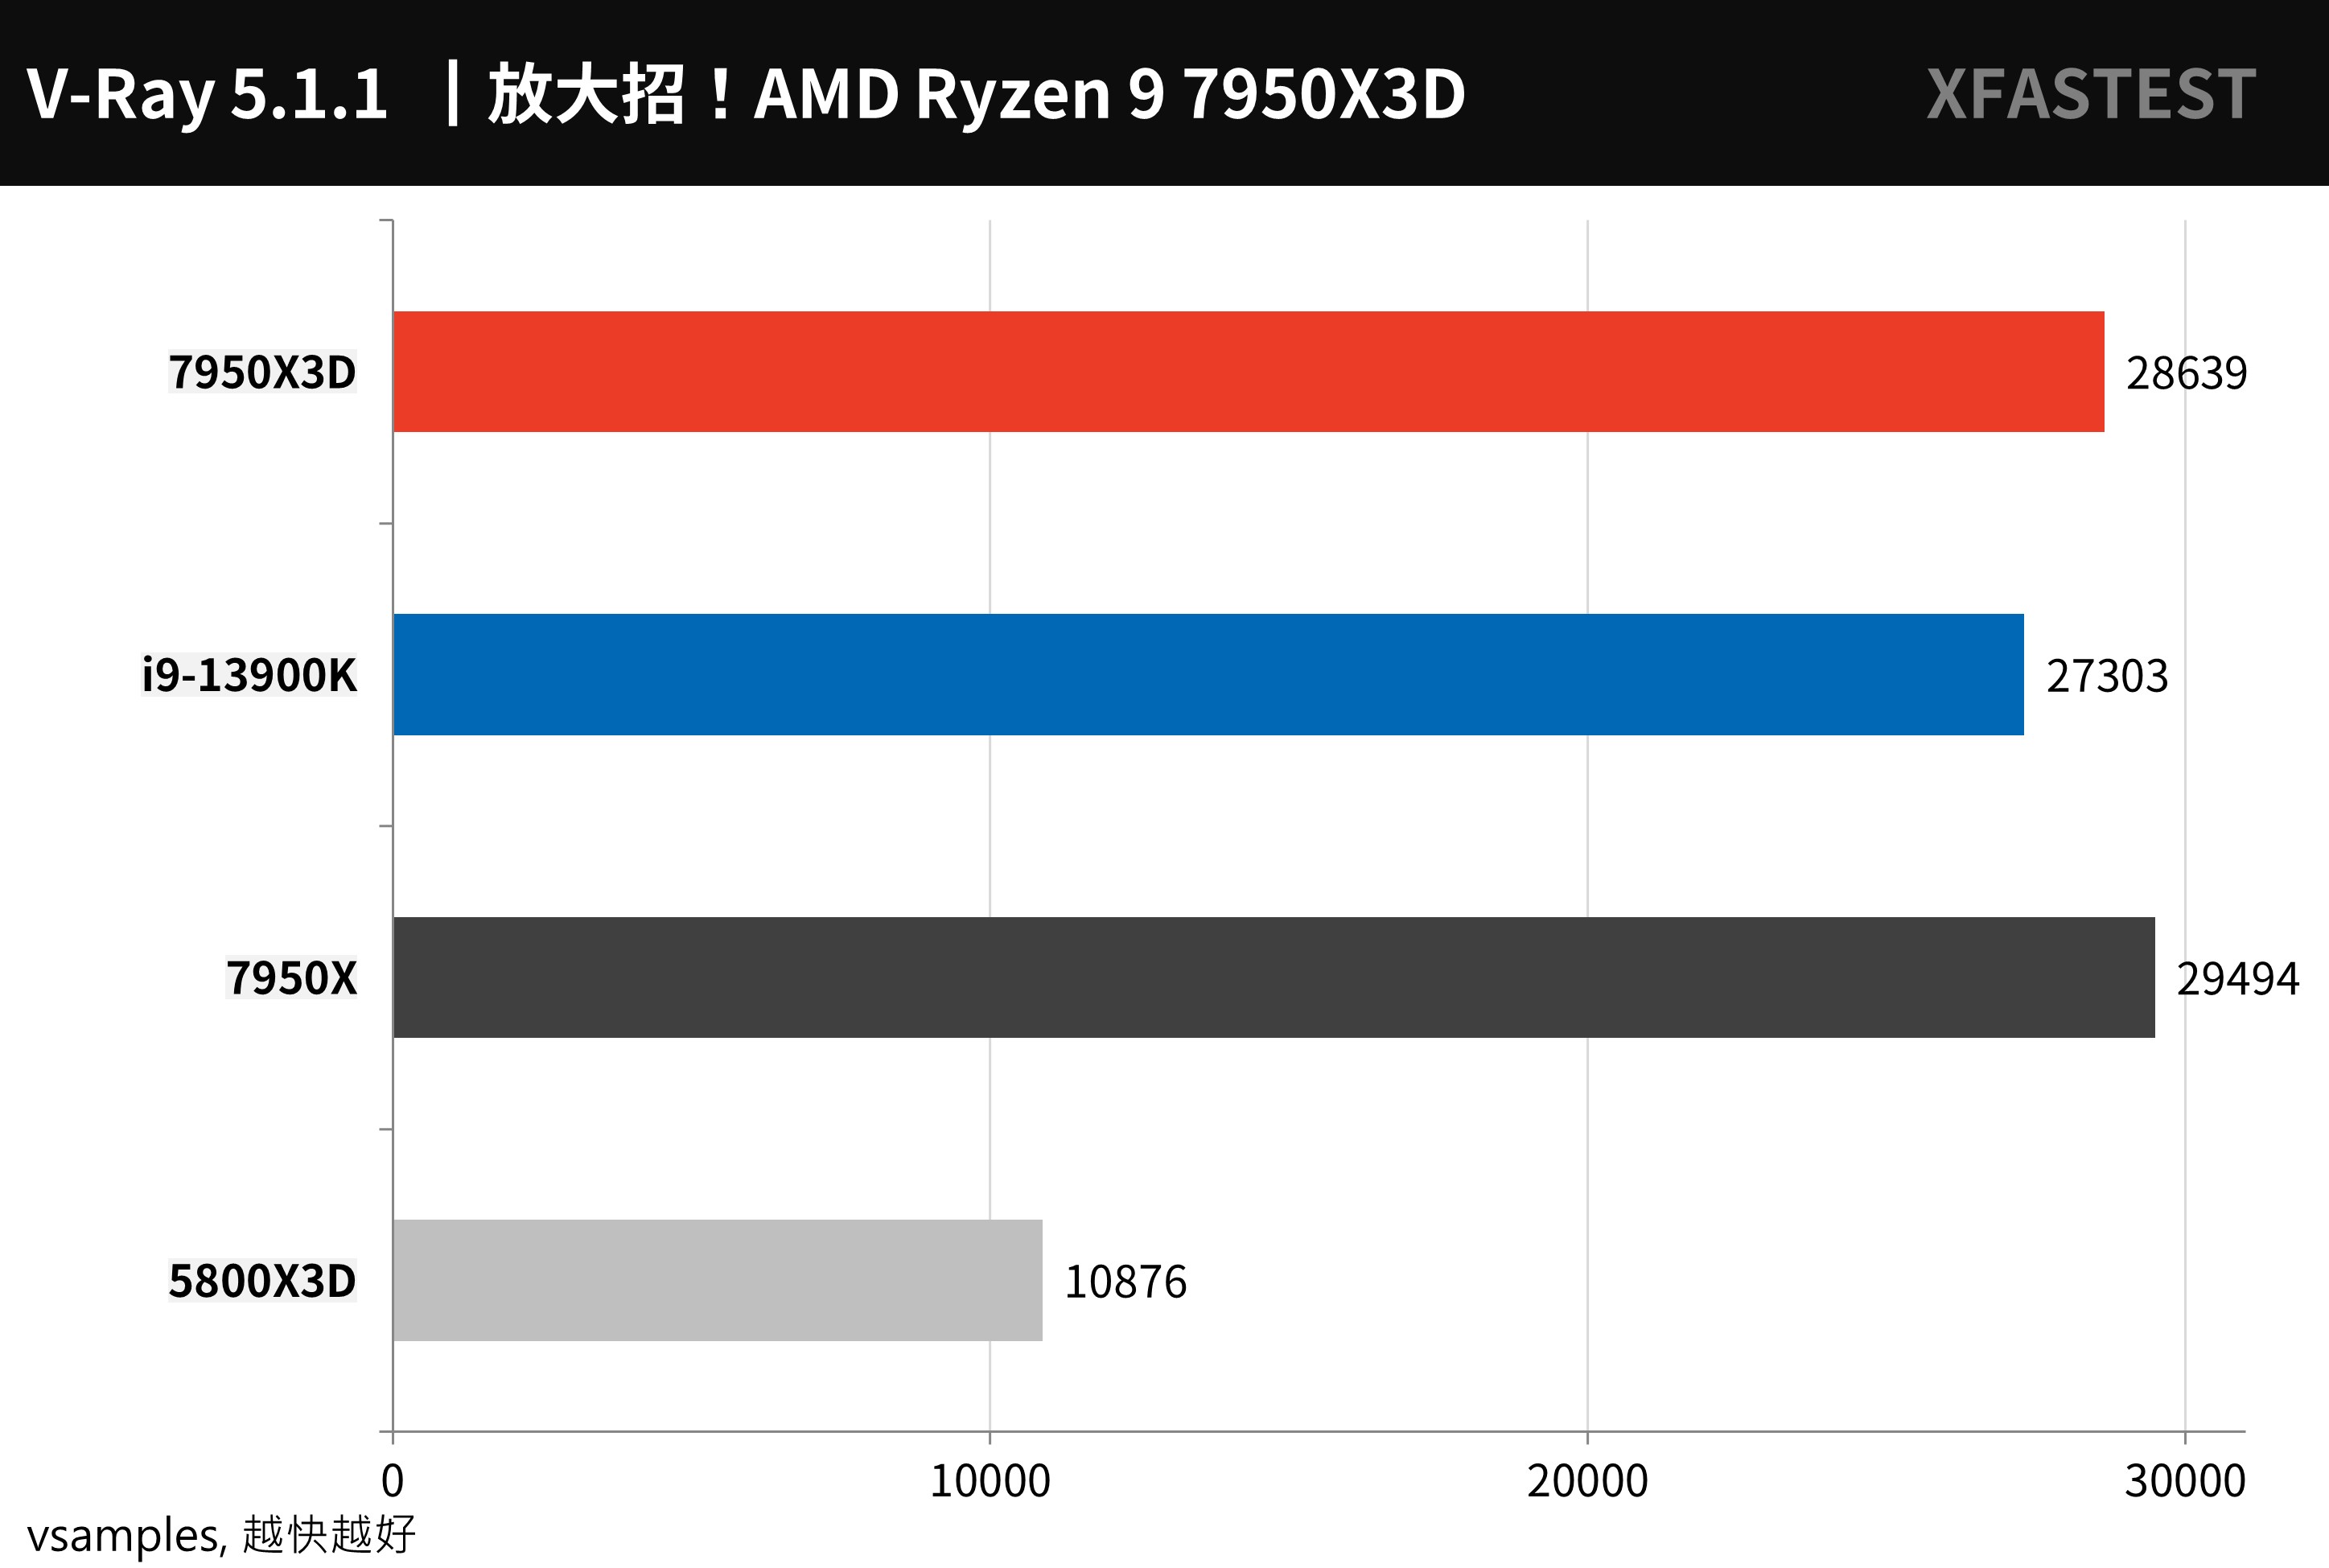
↑ V-Ray Benchmark, the higher the better.
POV-Ray It is another set of free ray tracing 3D rendering tools, which uses the computing power of multi-core CPU to calculate the rendering of light and shadow and 3D images.
The 7950X3D achieved a score of 11725.37 PPS. Compared with the 7950X, it reduced the computing performance by -6.3%, and if compared with the i9-13900K, it lost -11.9% performance.
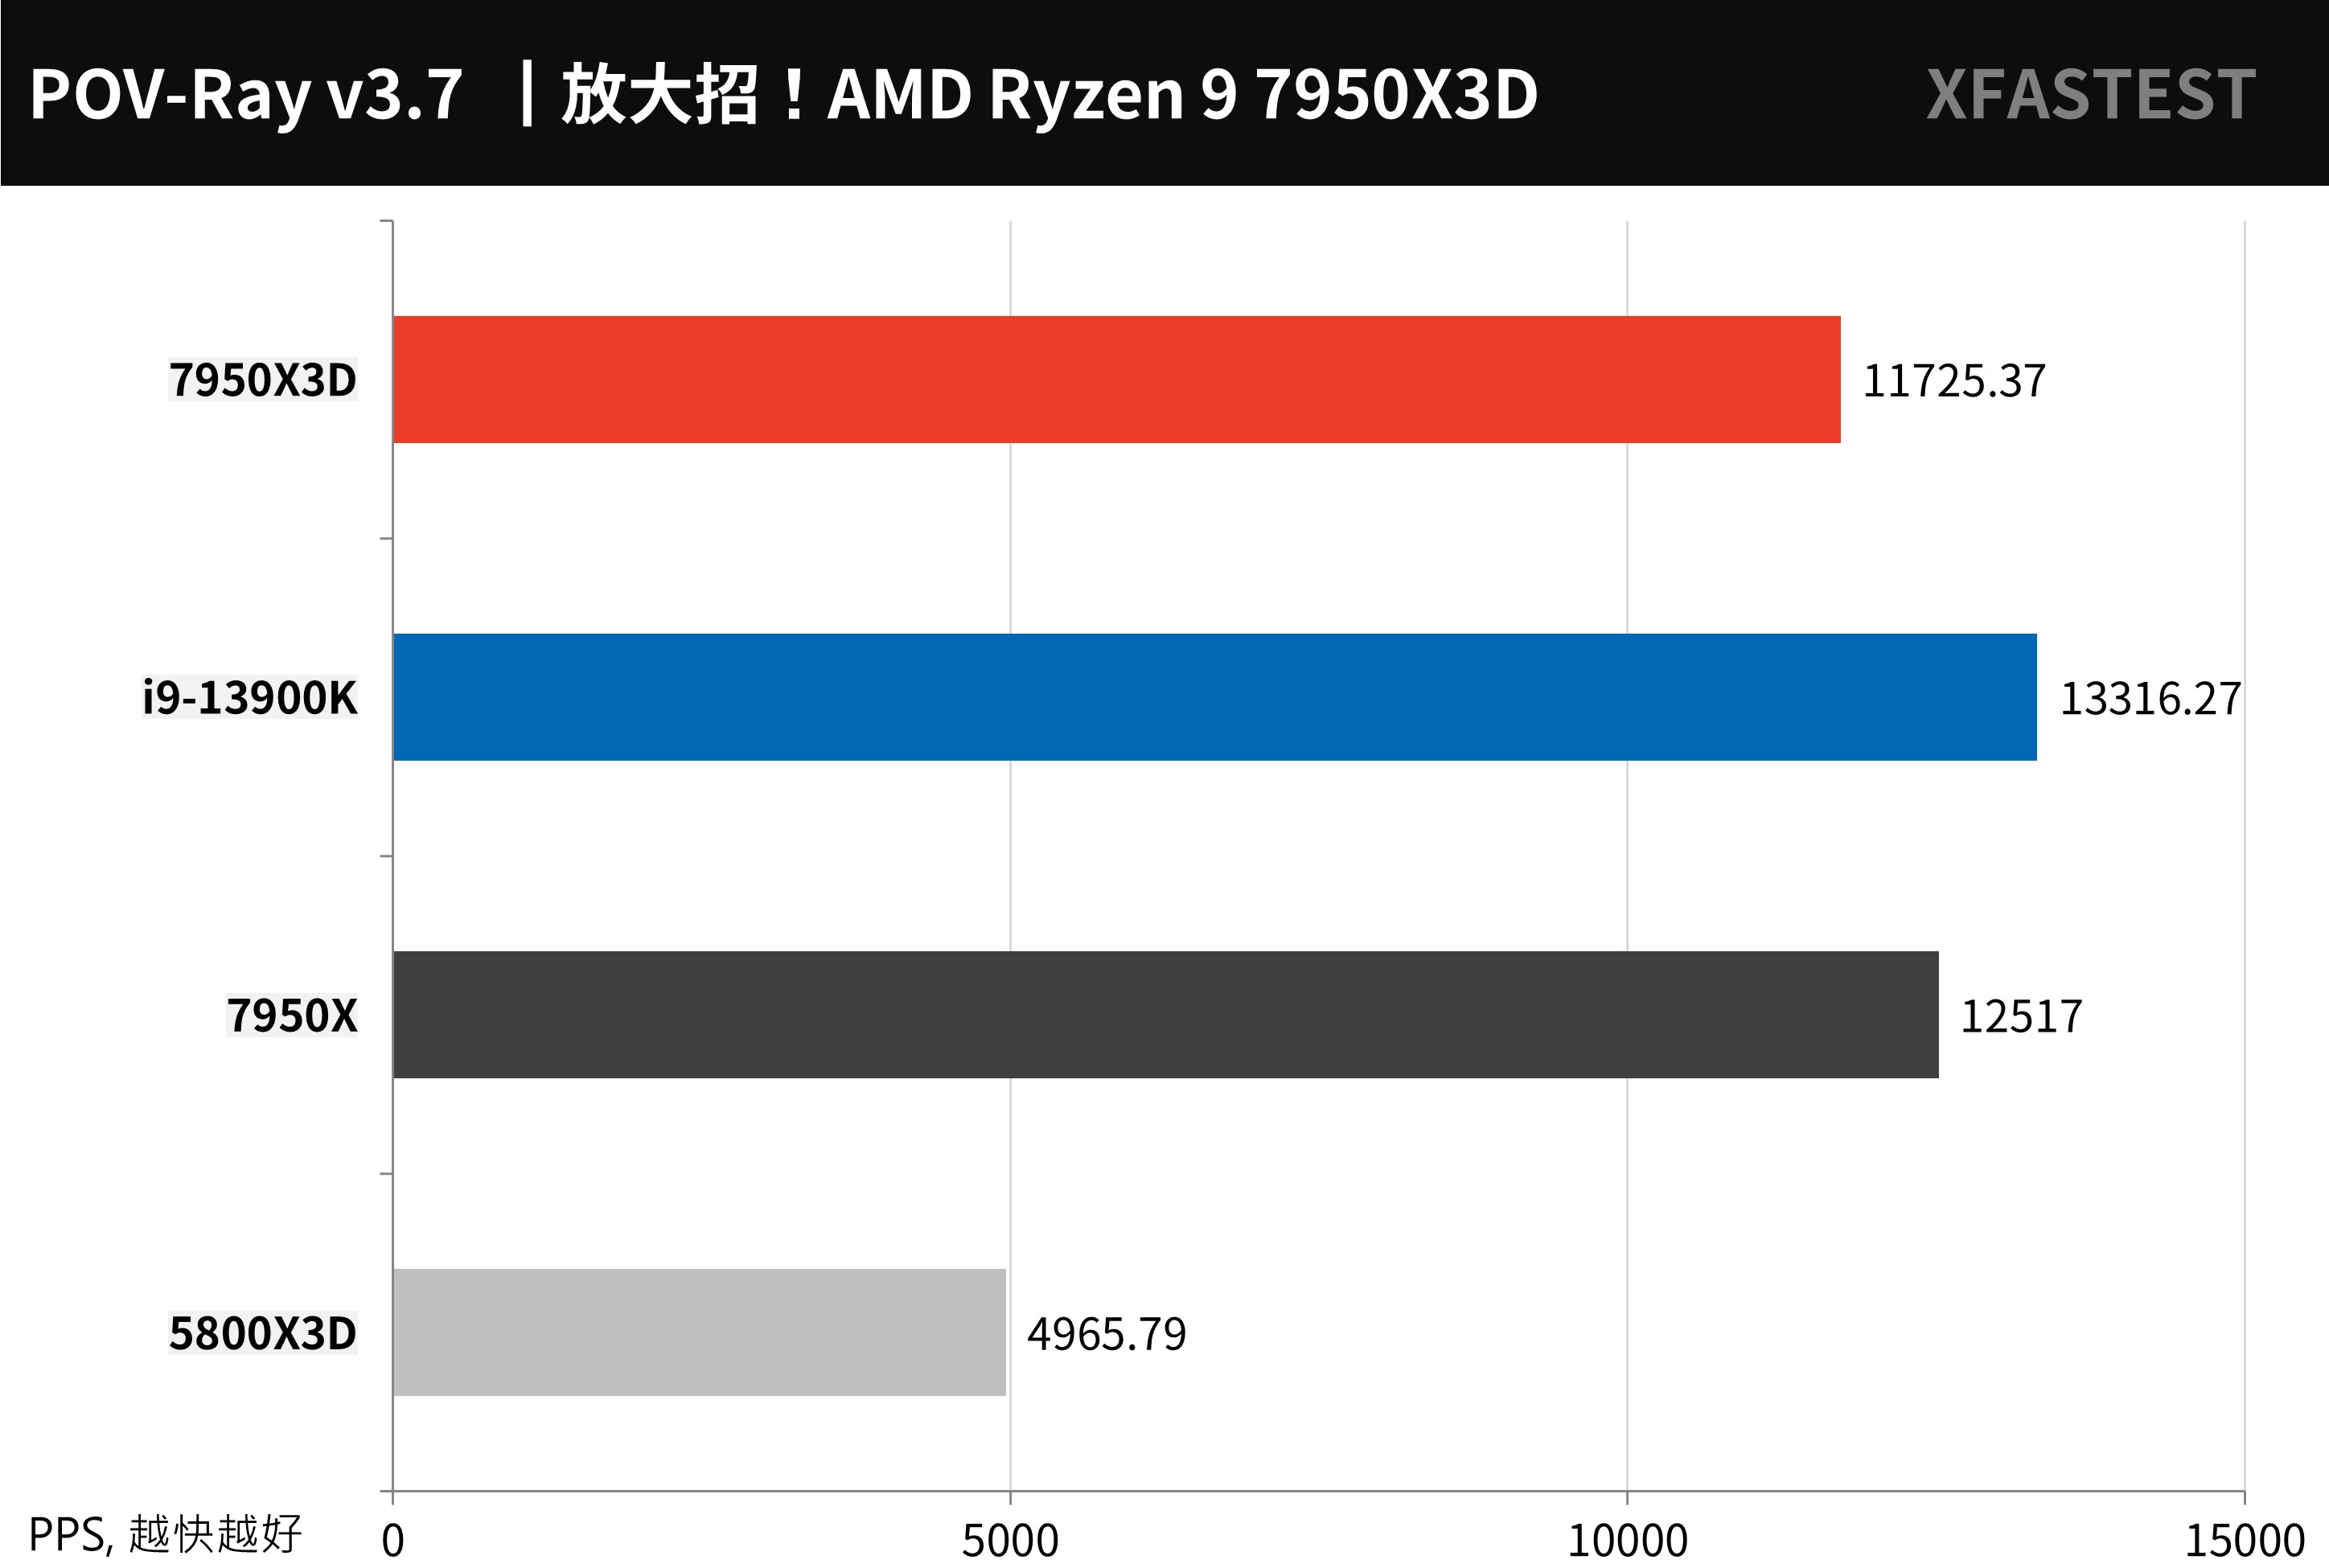
↑ POV-Ray, the higher the better.
Blender It is a cross-platform, open-source 3D creation tool that supports CPU and GPU rendering acceleration functions, as well as various 3D operations: Modeling, Rigging, Animation, Simulation, Rendering, Compositing and Motion Tracking, etc.
The 7950X3D has a sample performance of 133.459 in classroom, 172.809 in junkshop, and 272.724 in monster. Compared with 7950X, the performance of this project is -3.6% lower, but it still beats the computing performance of i9-13900K by about 3.1%.
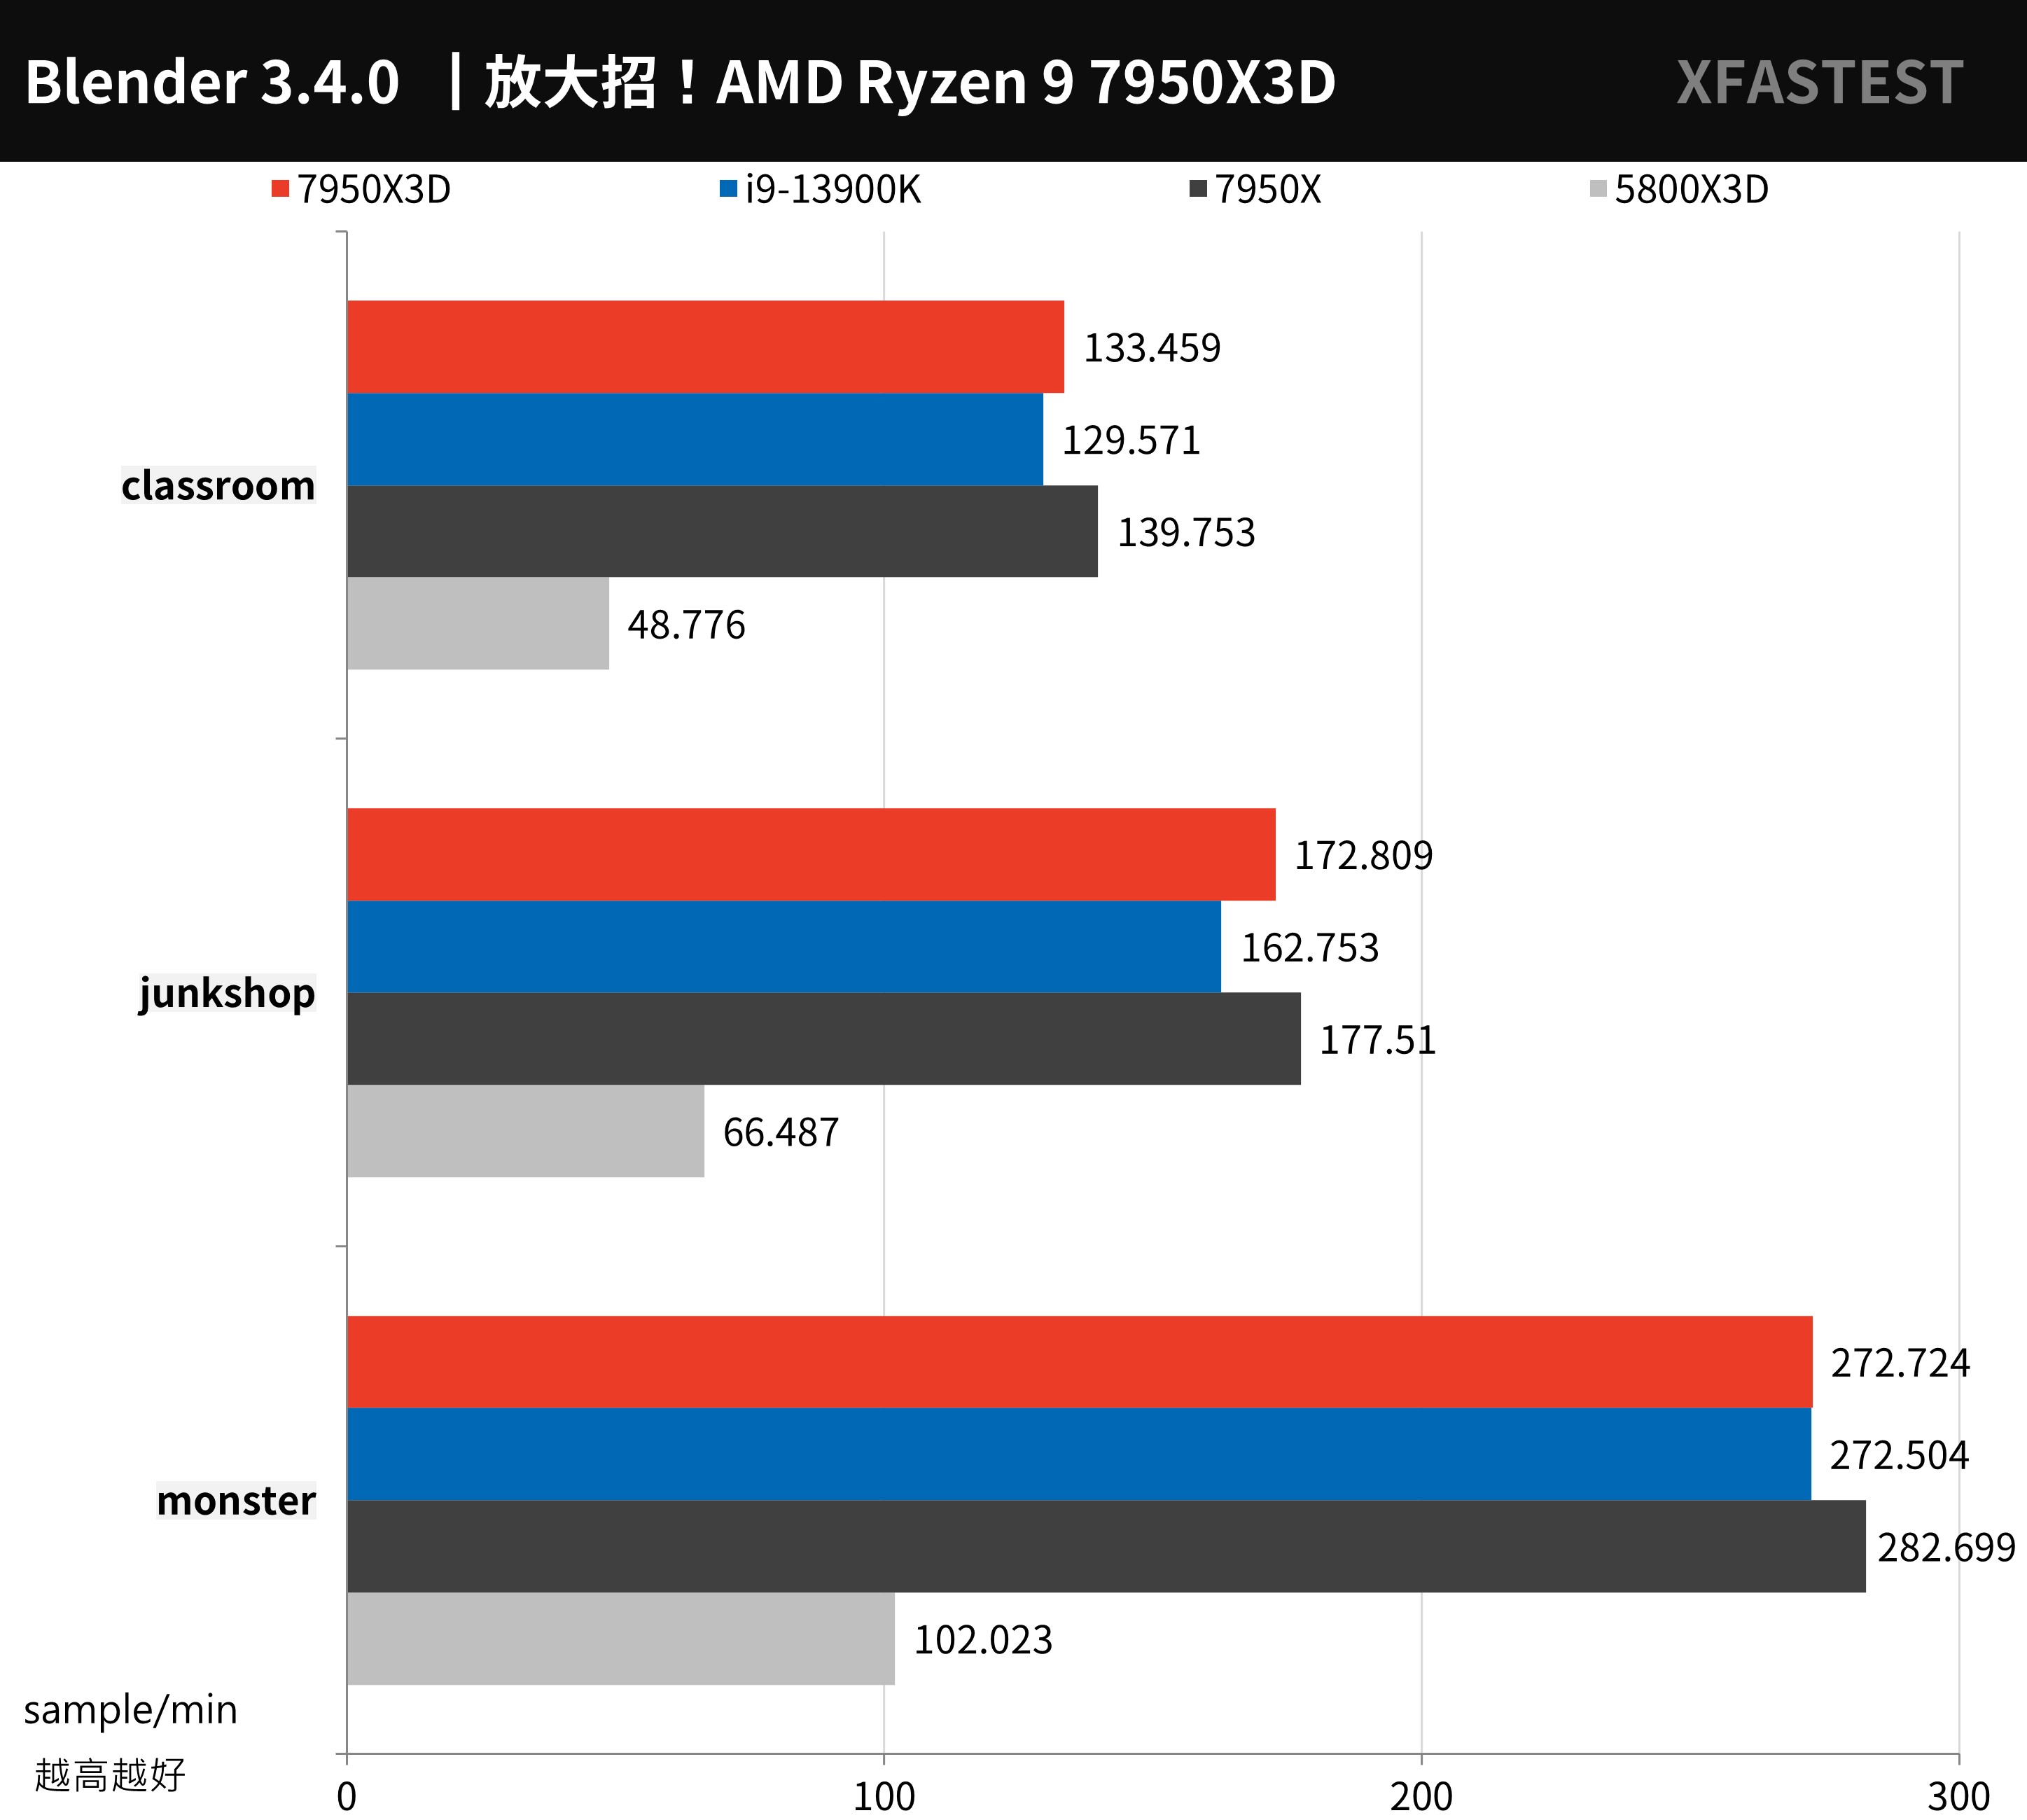
↑ Blender, the higher the better.
Creative PR image output, LR and PS photo editing performance test
For the conversion output test of Adobe Premiere Pro 2020, this time using UL Procyon Video Editing Benchmark Test tool, the test scenario is to use 2160p 30/60 FPS video, output as H.264 – YouTube 1080p Full HD and HEVC (H.265) – 4K UHD format respectively, and compare the output performance of pure CPU output and adding GPU acceleration . Tested using RX 7900 XTX graphics card.
7950X3D and 7950X have faster CPU output performance, so they reached 11847 points, which is 17.3% faster than i9-13900K; but if you compare GPU accelerated shifting, there is not much difference.
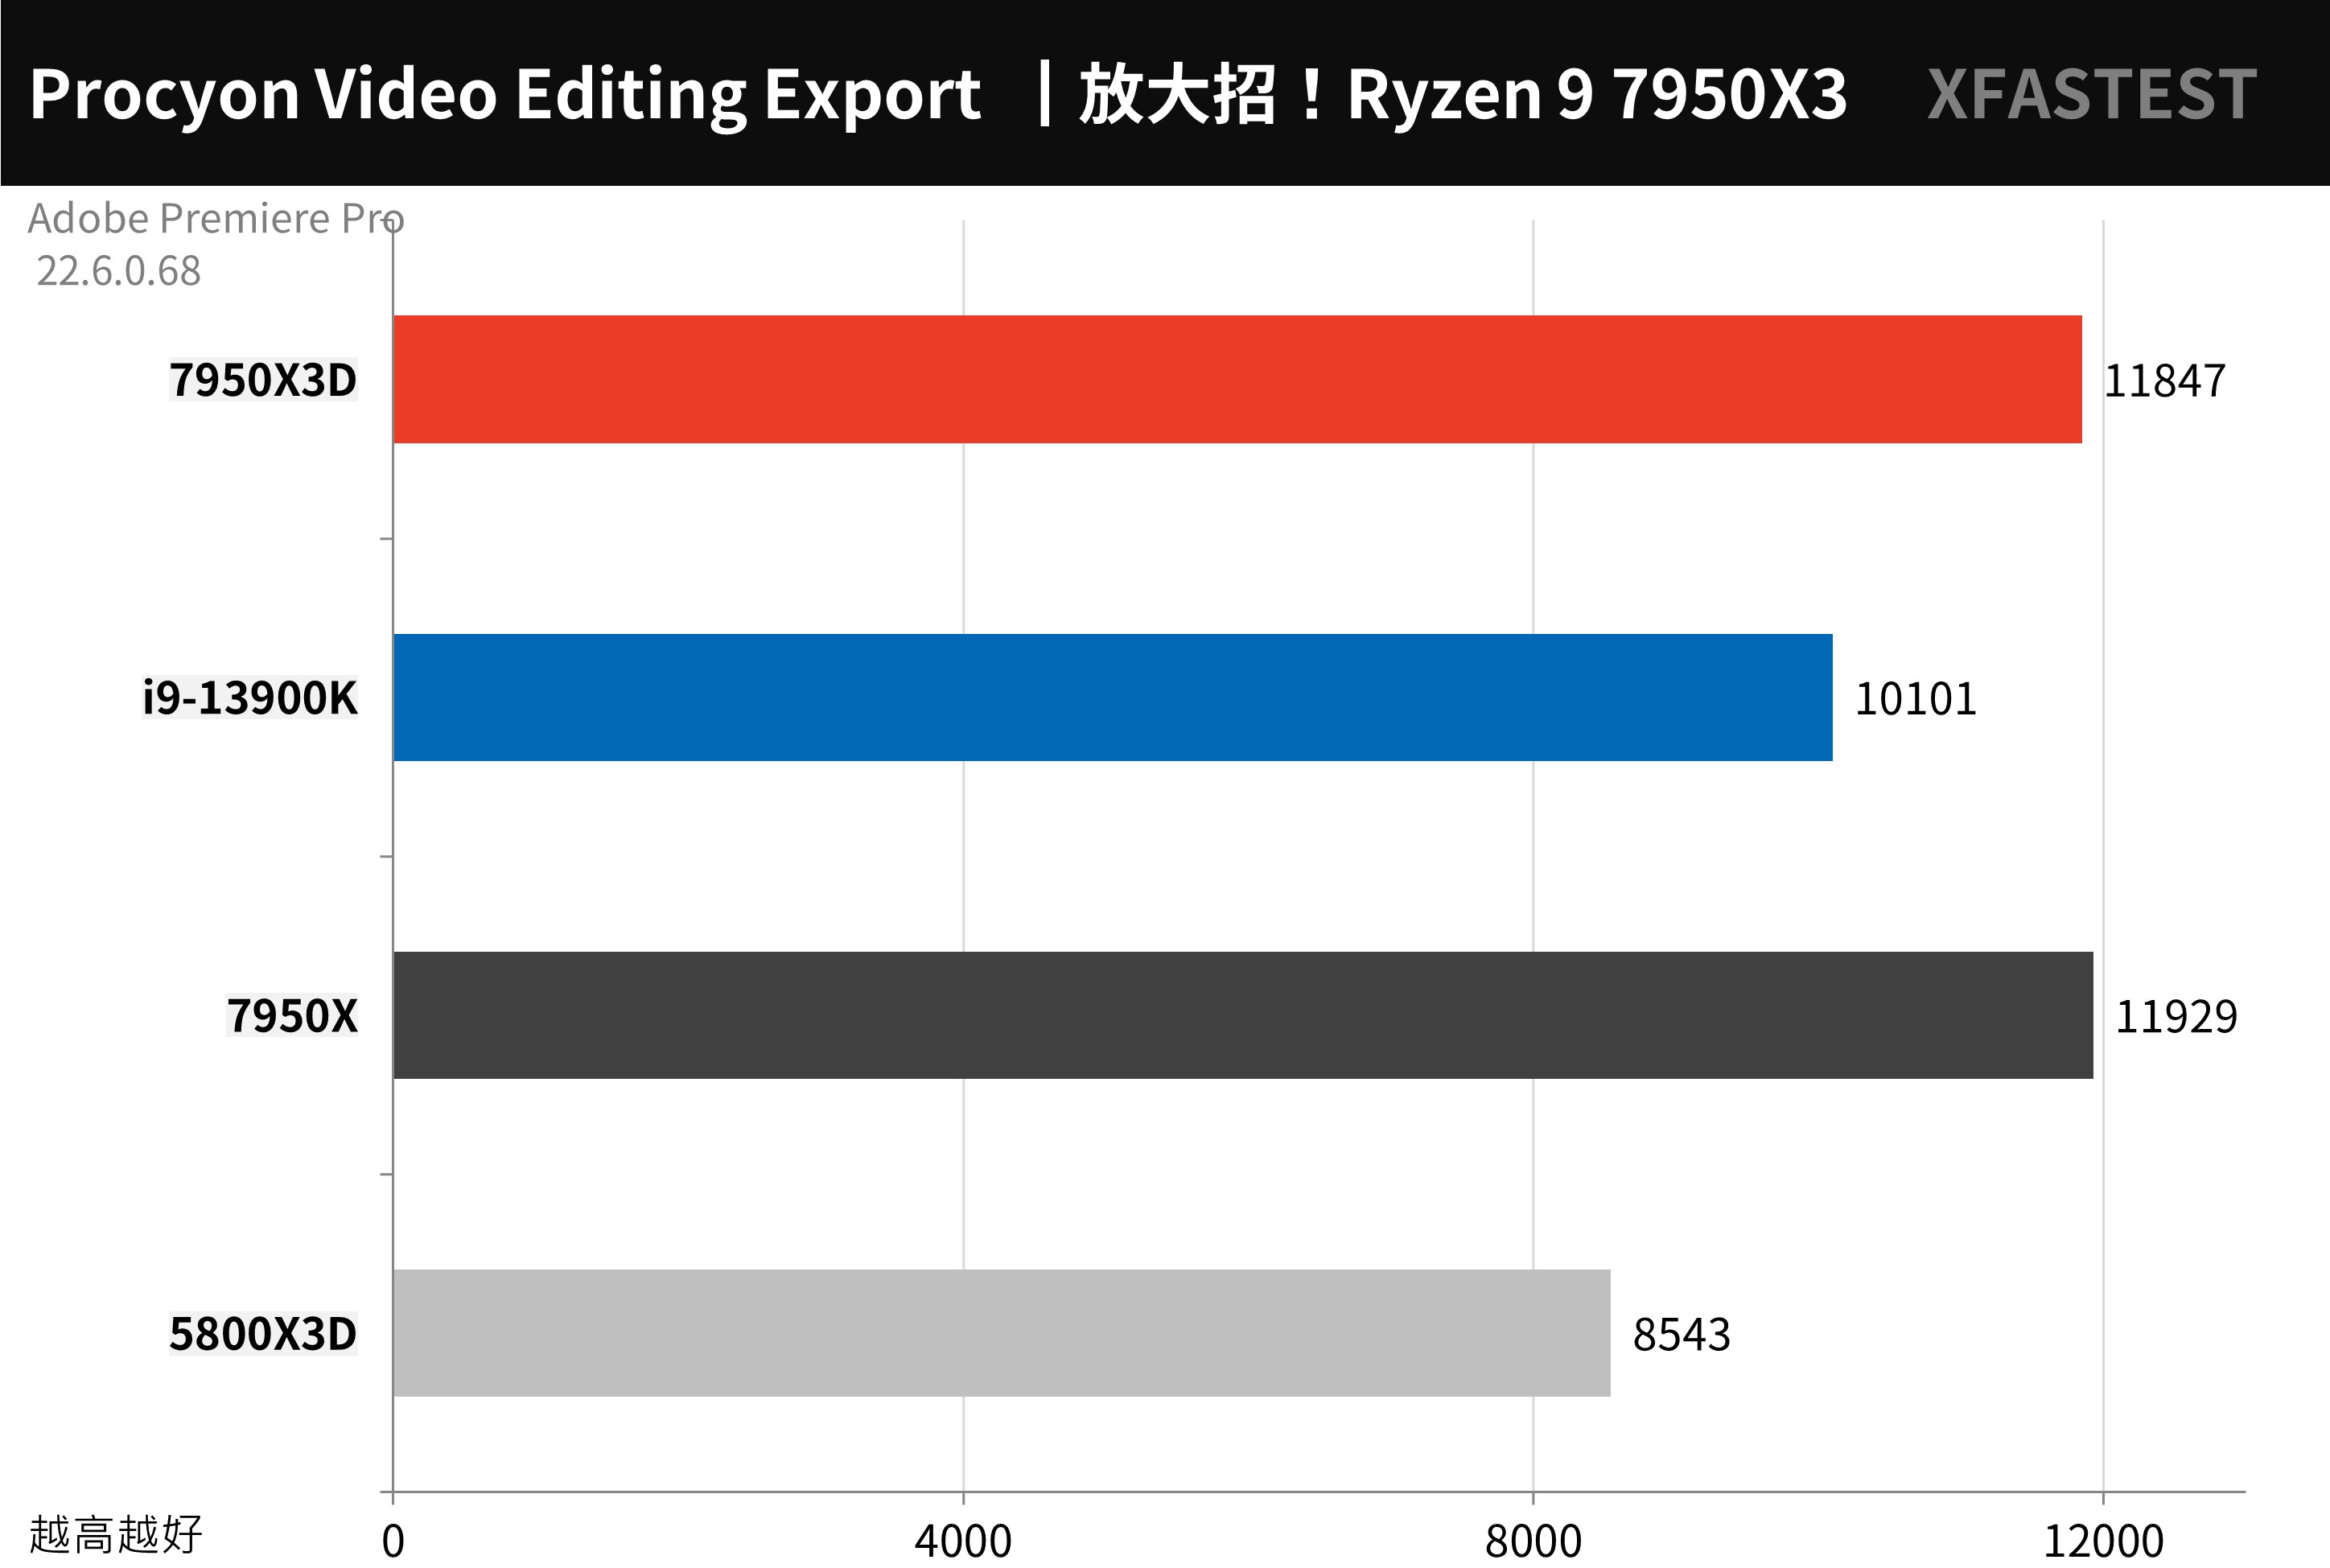
↑ UL Procyon Video Editing Benchmark, the higher the better.
Adobe Photoshop and Lightroom Classic through UL Procyon Photo Editing Benchmark Test tool; the two working conditions of the test, Image Retouching test is to use Photoshop to retouch photos, and record the time of each step, while Batch Processing test is to use Lightroom to adjust and output a large number of photos in batches.
The total score of 12607 points for 7950X3D is about 1.6% higher than that of i9-13900K. For image editing or batch processing of PS and LR, AMD processors have more advantages in performance.
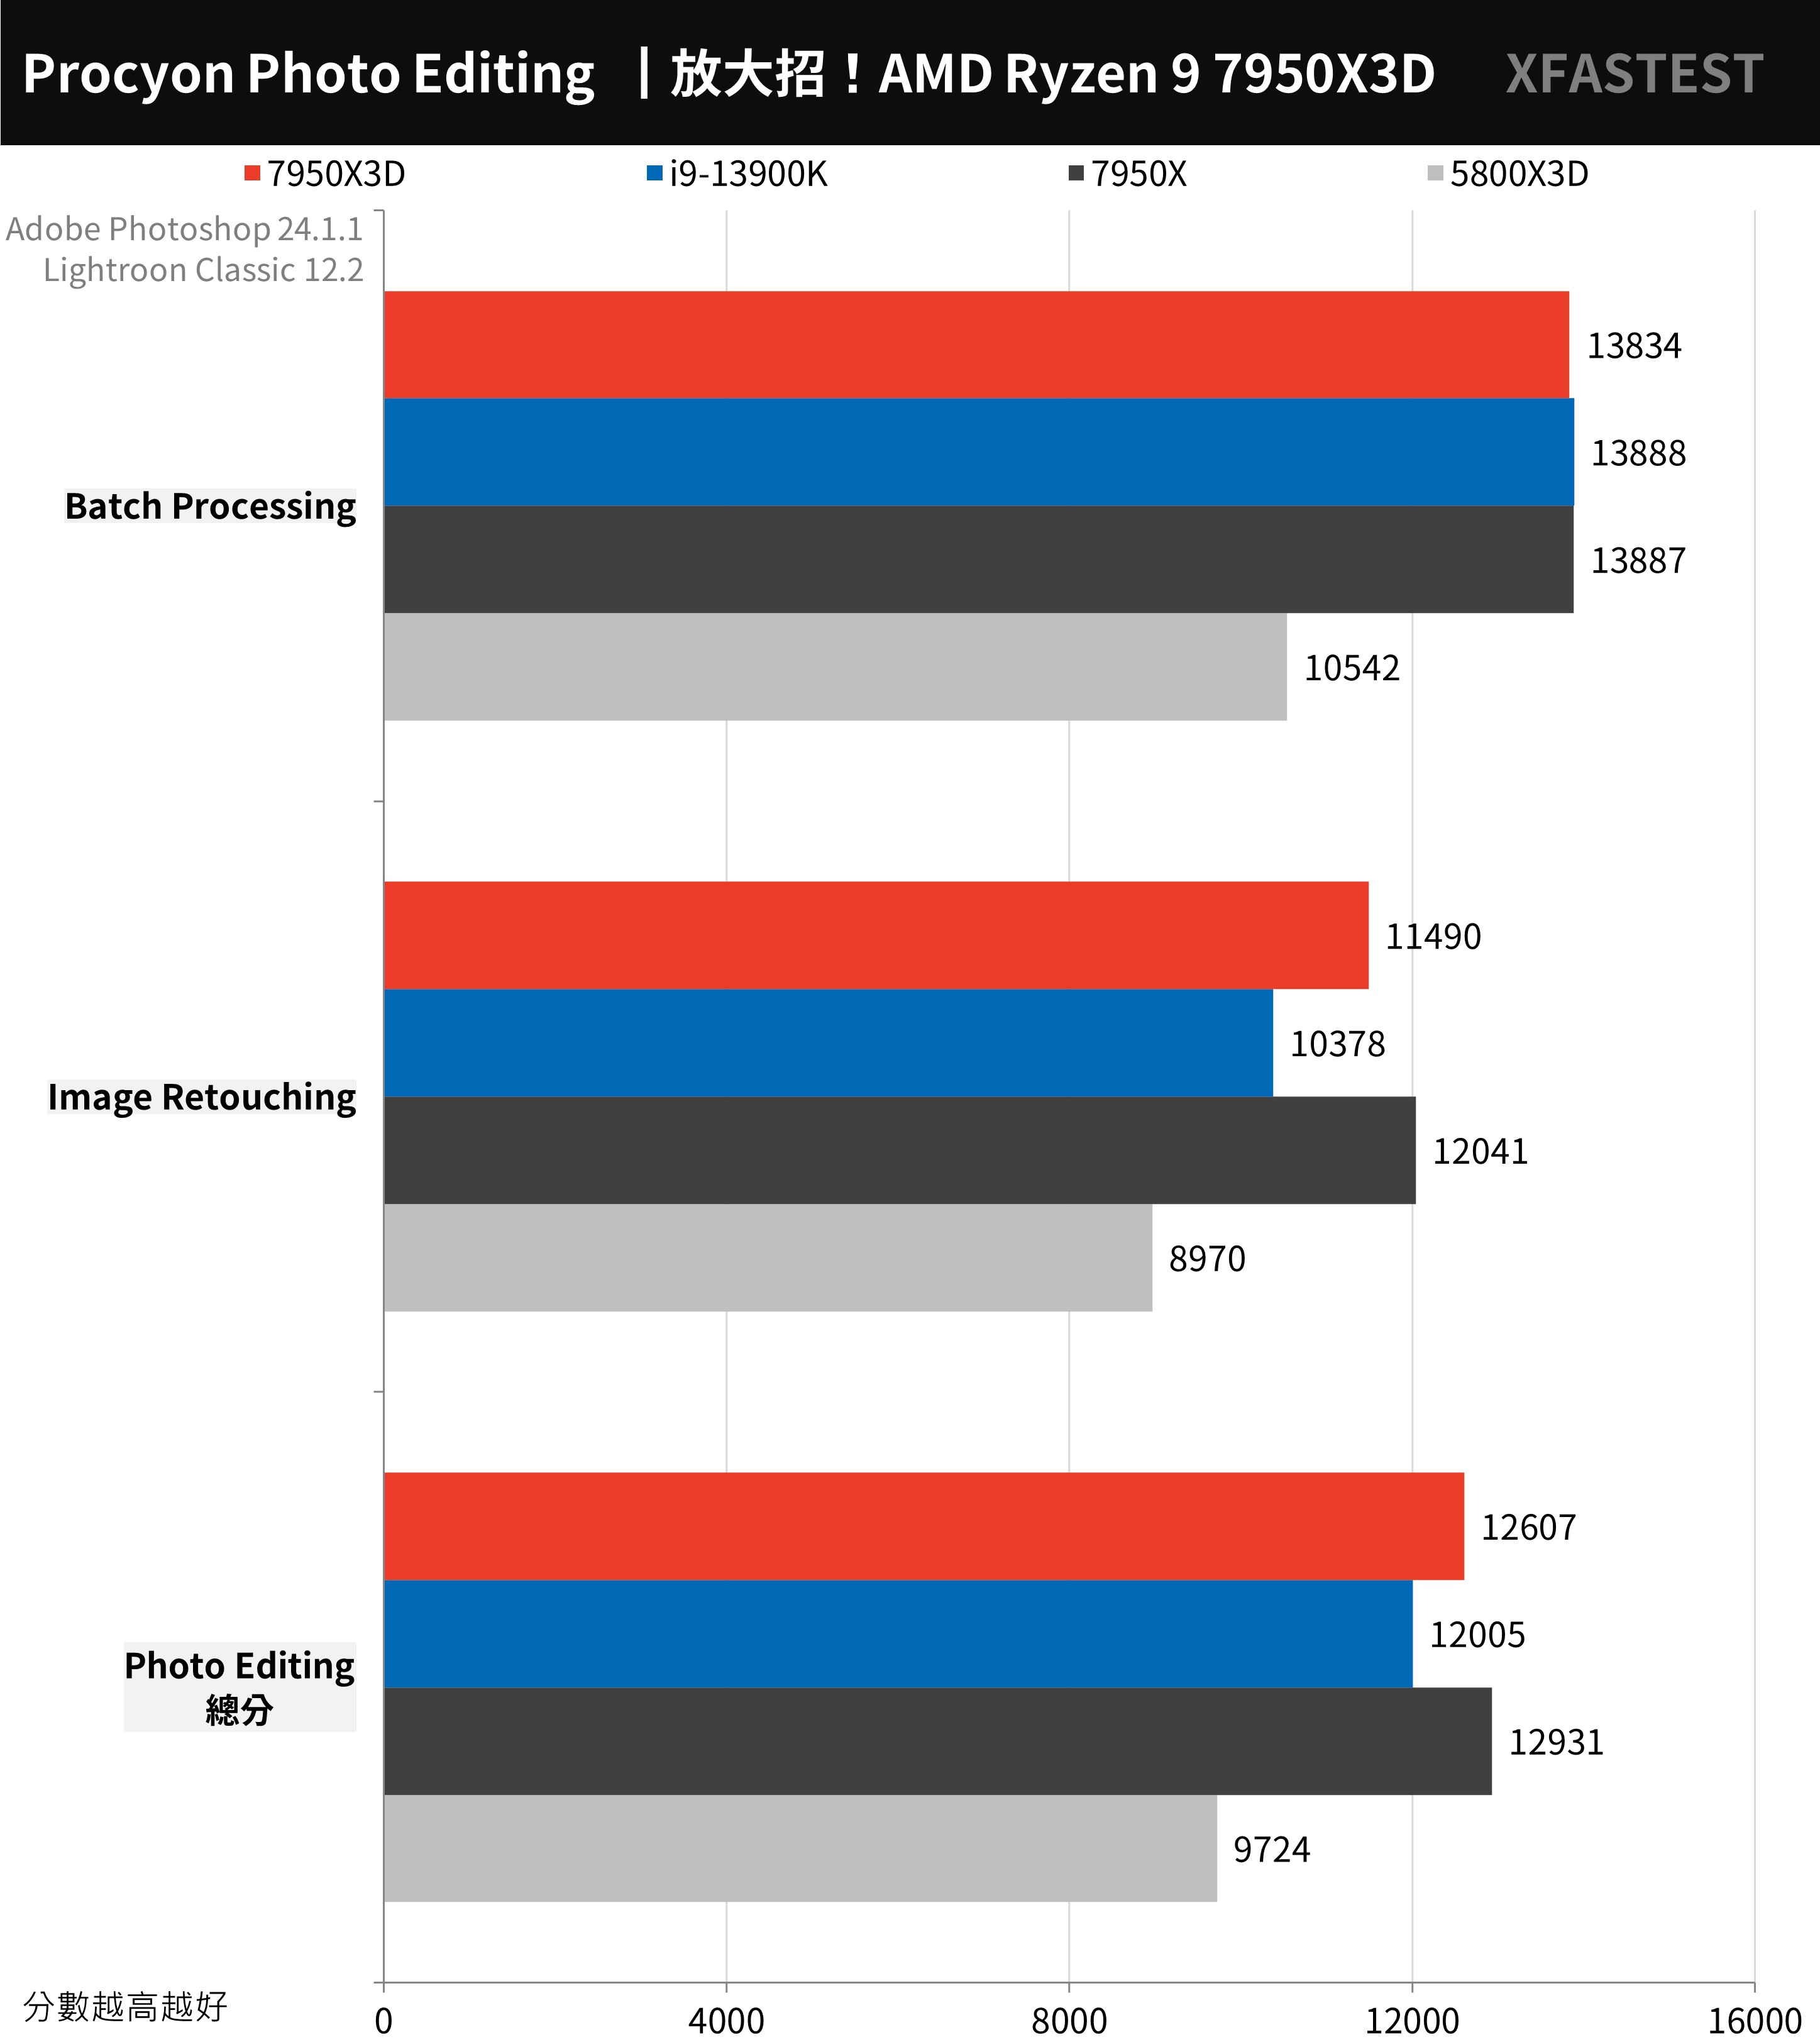
↑ UL Procyon Photo Editing Benchmark, the higher the better.
AIDA64 processor memory, 7-Zip compression test
Memory tests use AIDA64 To carry out, use G.SKILL TRIDENT Z5 NEO DDR5-6000 16GBx2 memory.
The memory performance of 7950X3D and 7950X is equivalent, reading 78496 MB/s, writing 79130 MB/s, the Intel platform has a higher bandwidth performance under the same memory configuration; in terms of latency, 7950X3D 68.5ns, 7950X 64.5ns.
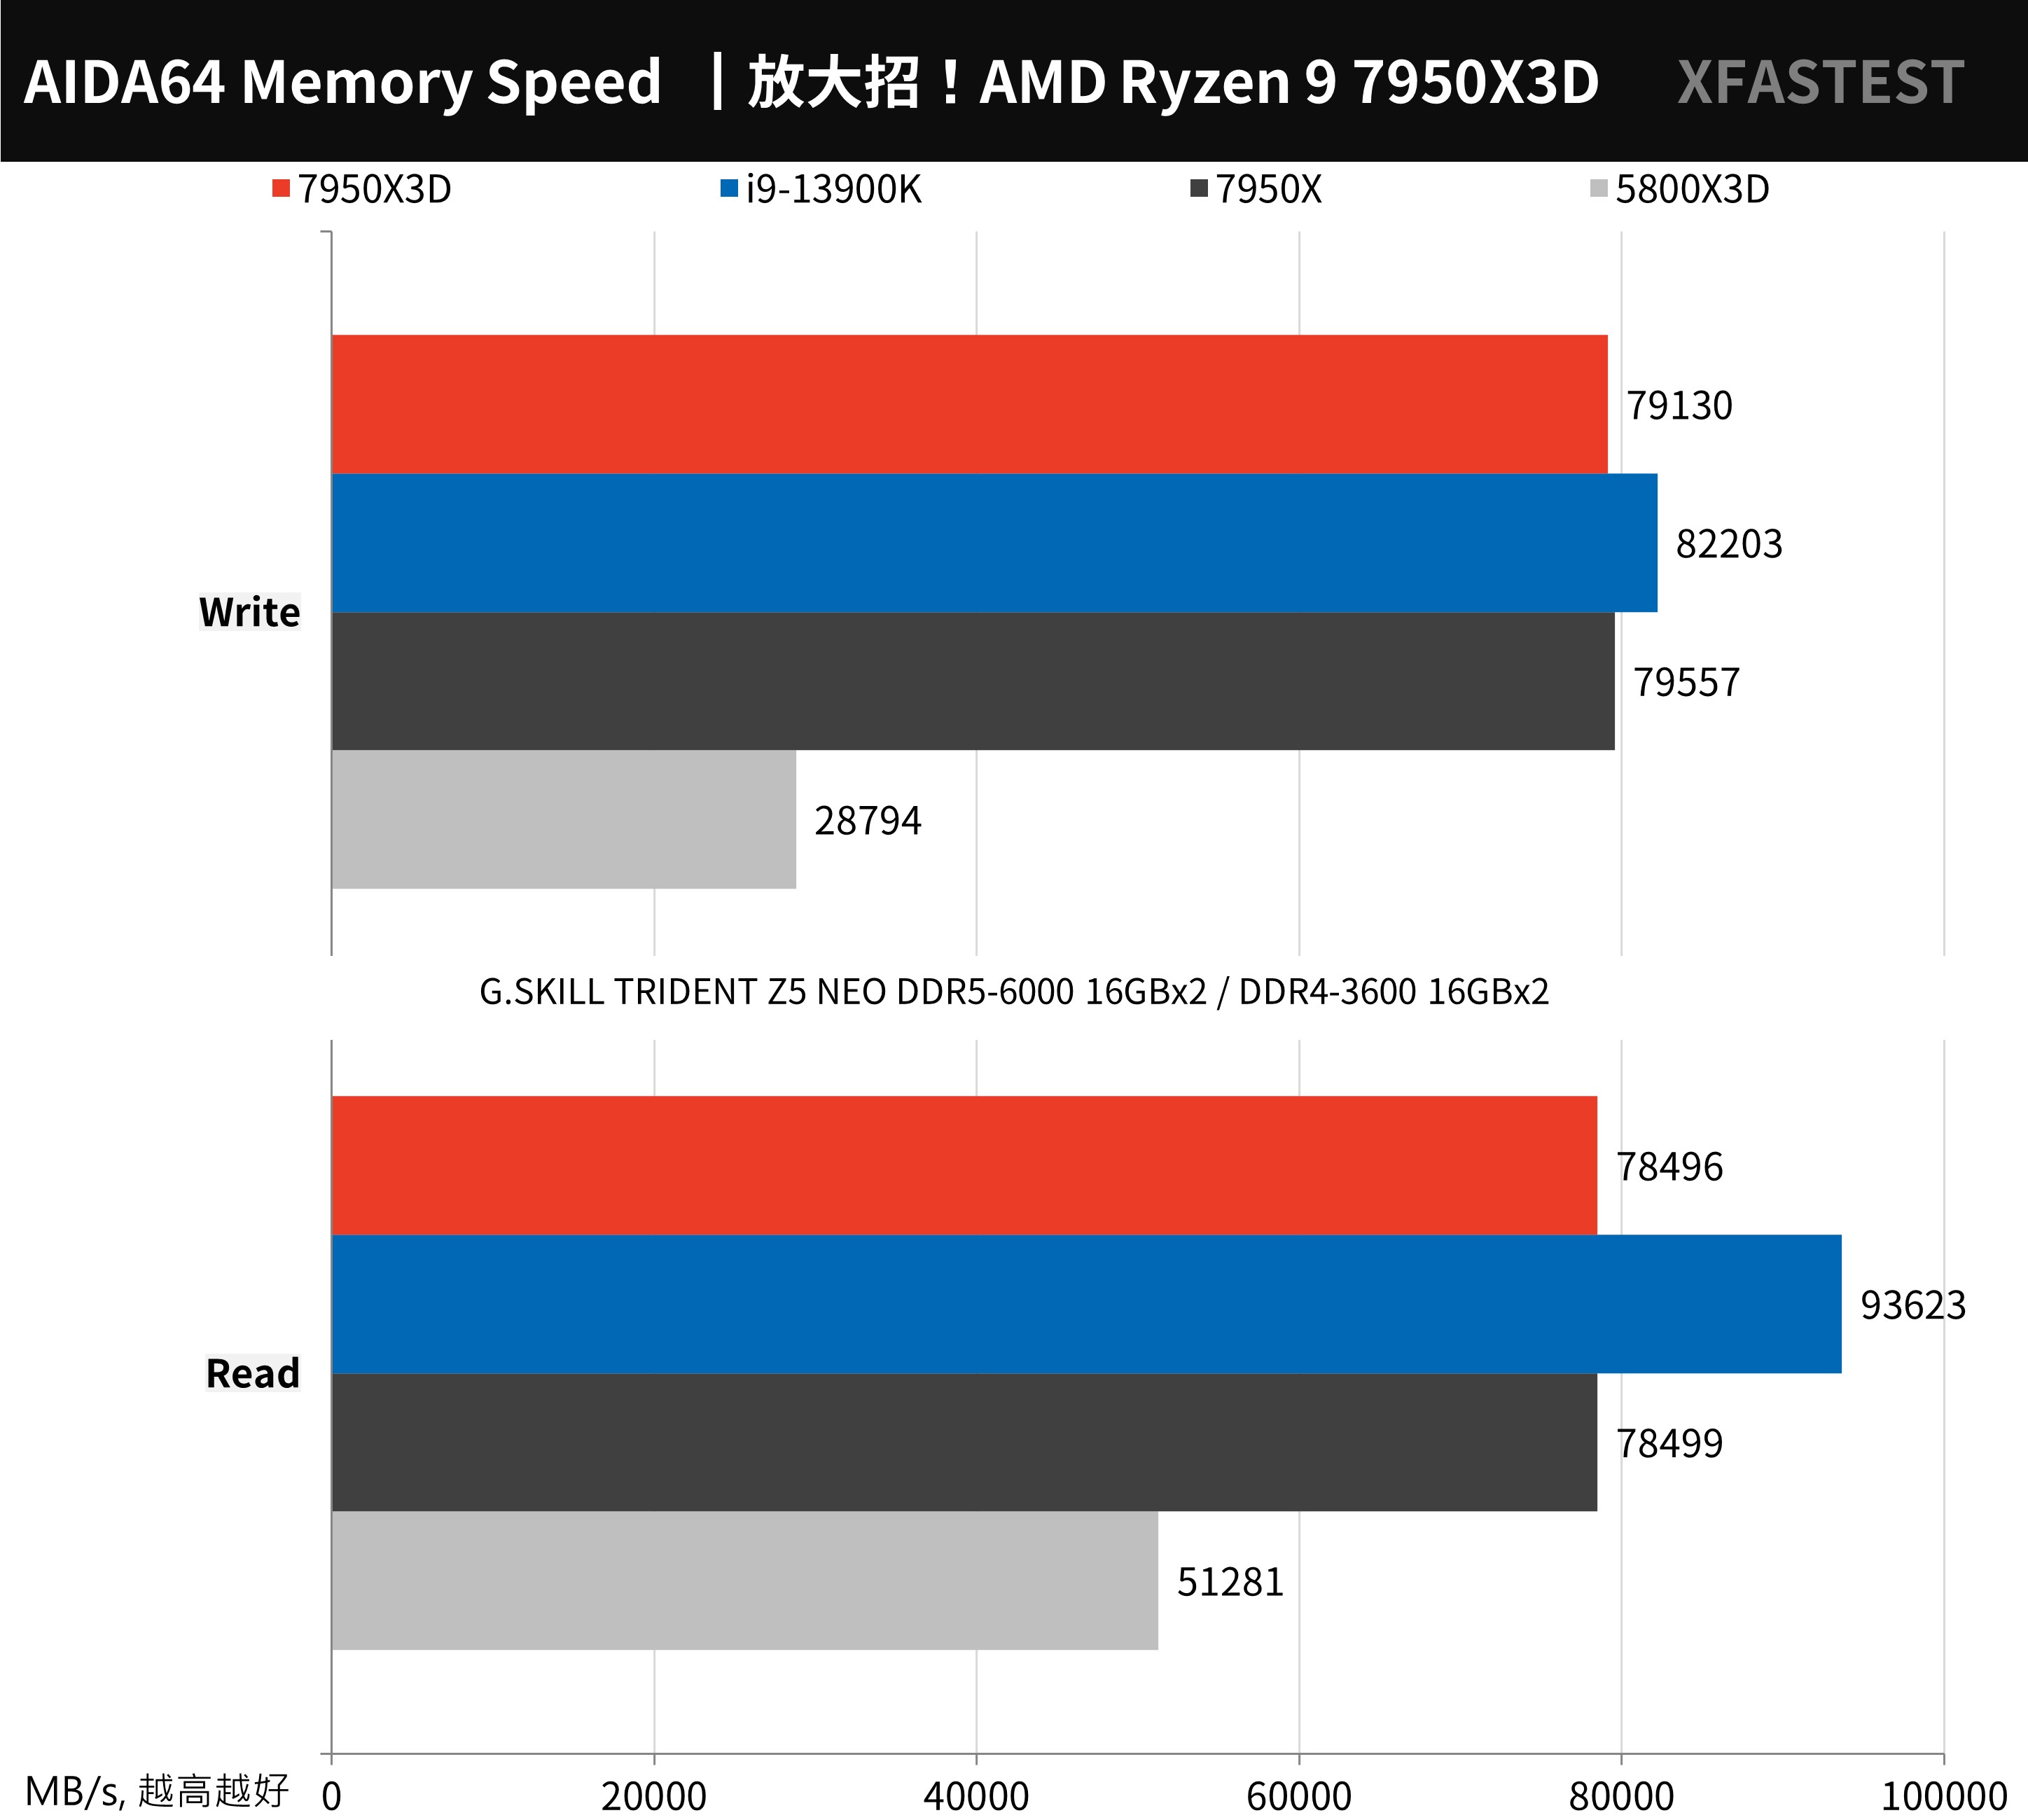
↑ AIDA64 memory.
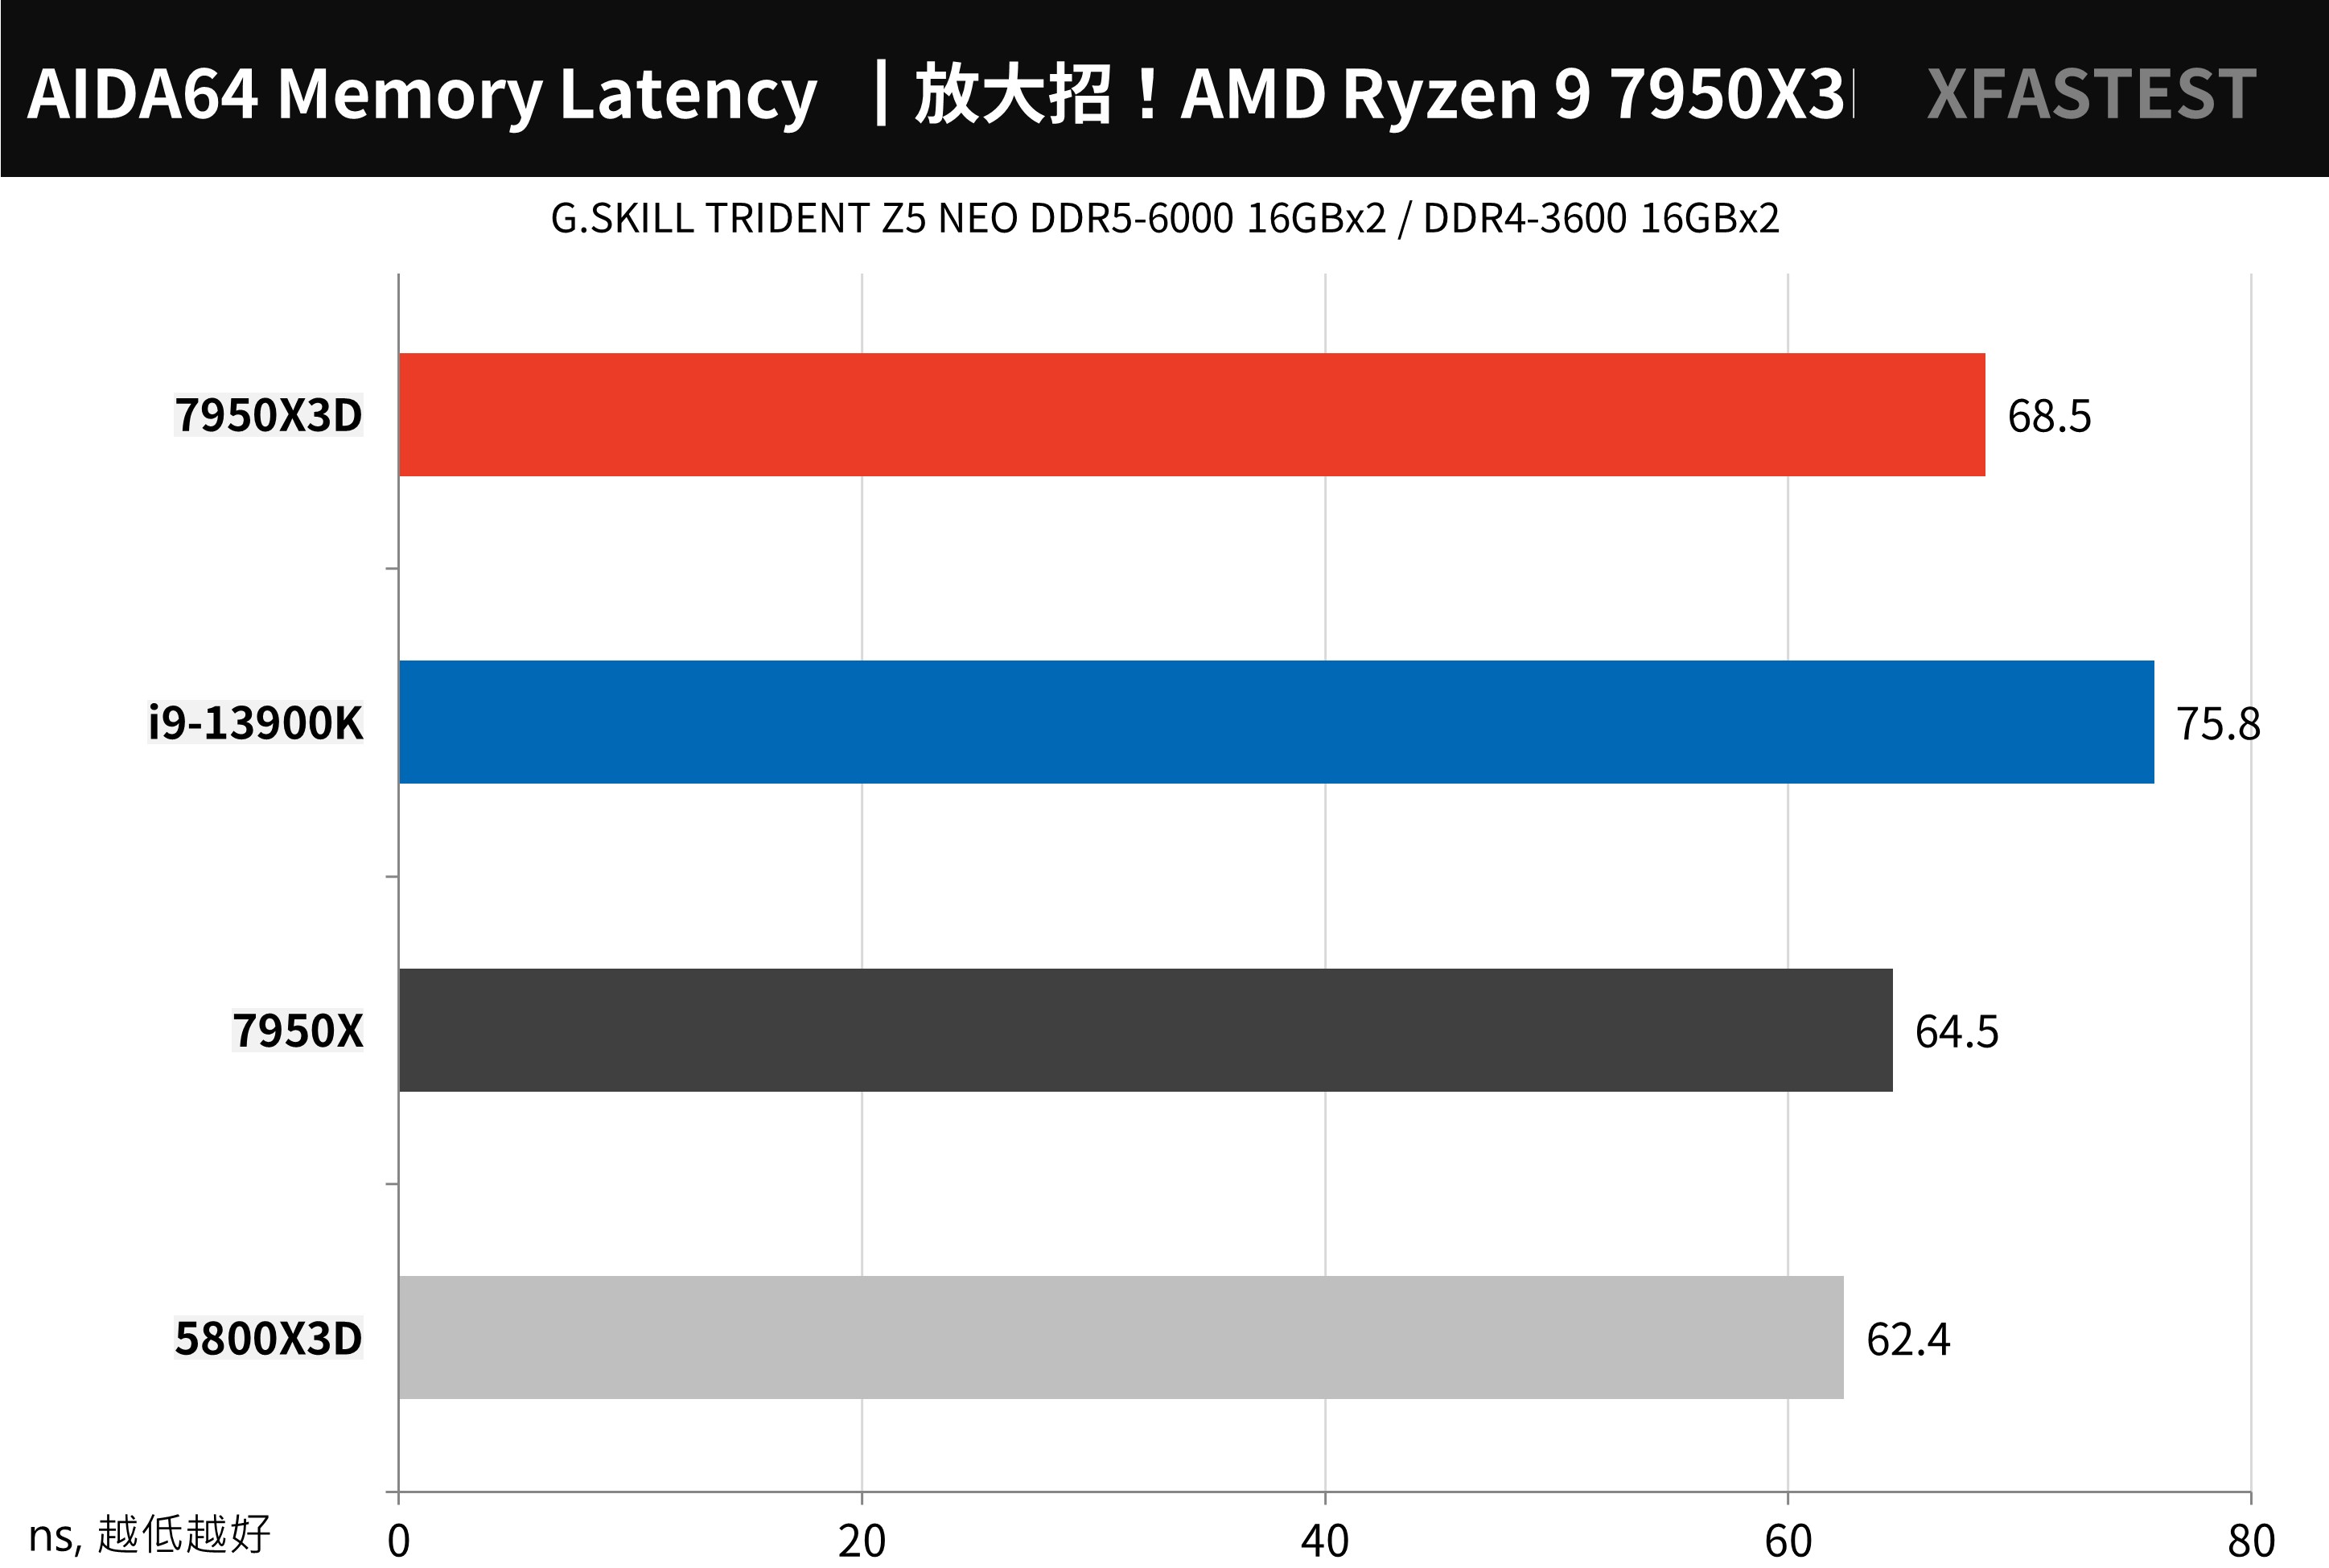
↑ AIDA64 memory latency.
WinRAR The most commonly used compression tool should be one of the few programs that rely on L3 cache to accelerate performance. The performance of 7950X3D reaches 62023 KB/s, which is 4.6% faster than the 59279 KB/s of 7950X, and 15.7 times faster than i9-13900K %.
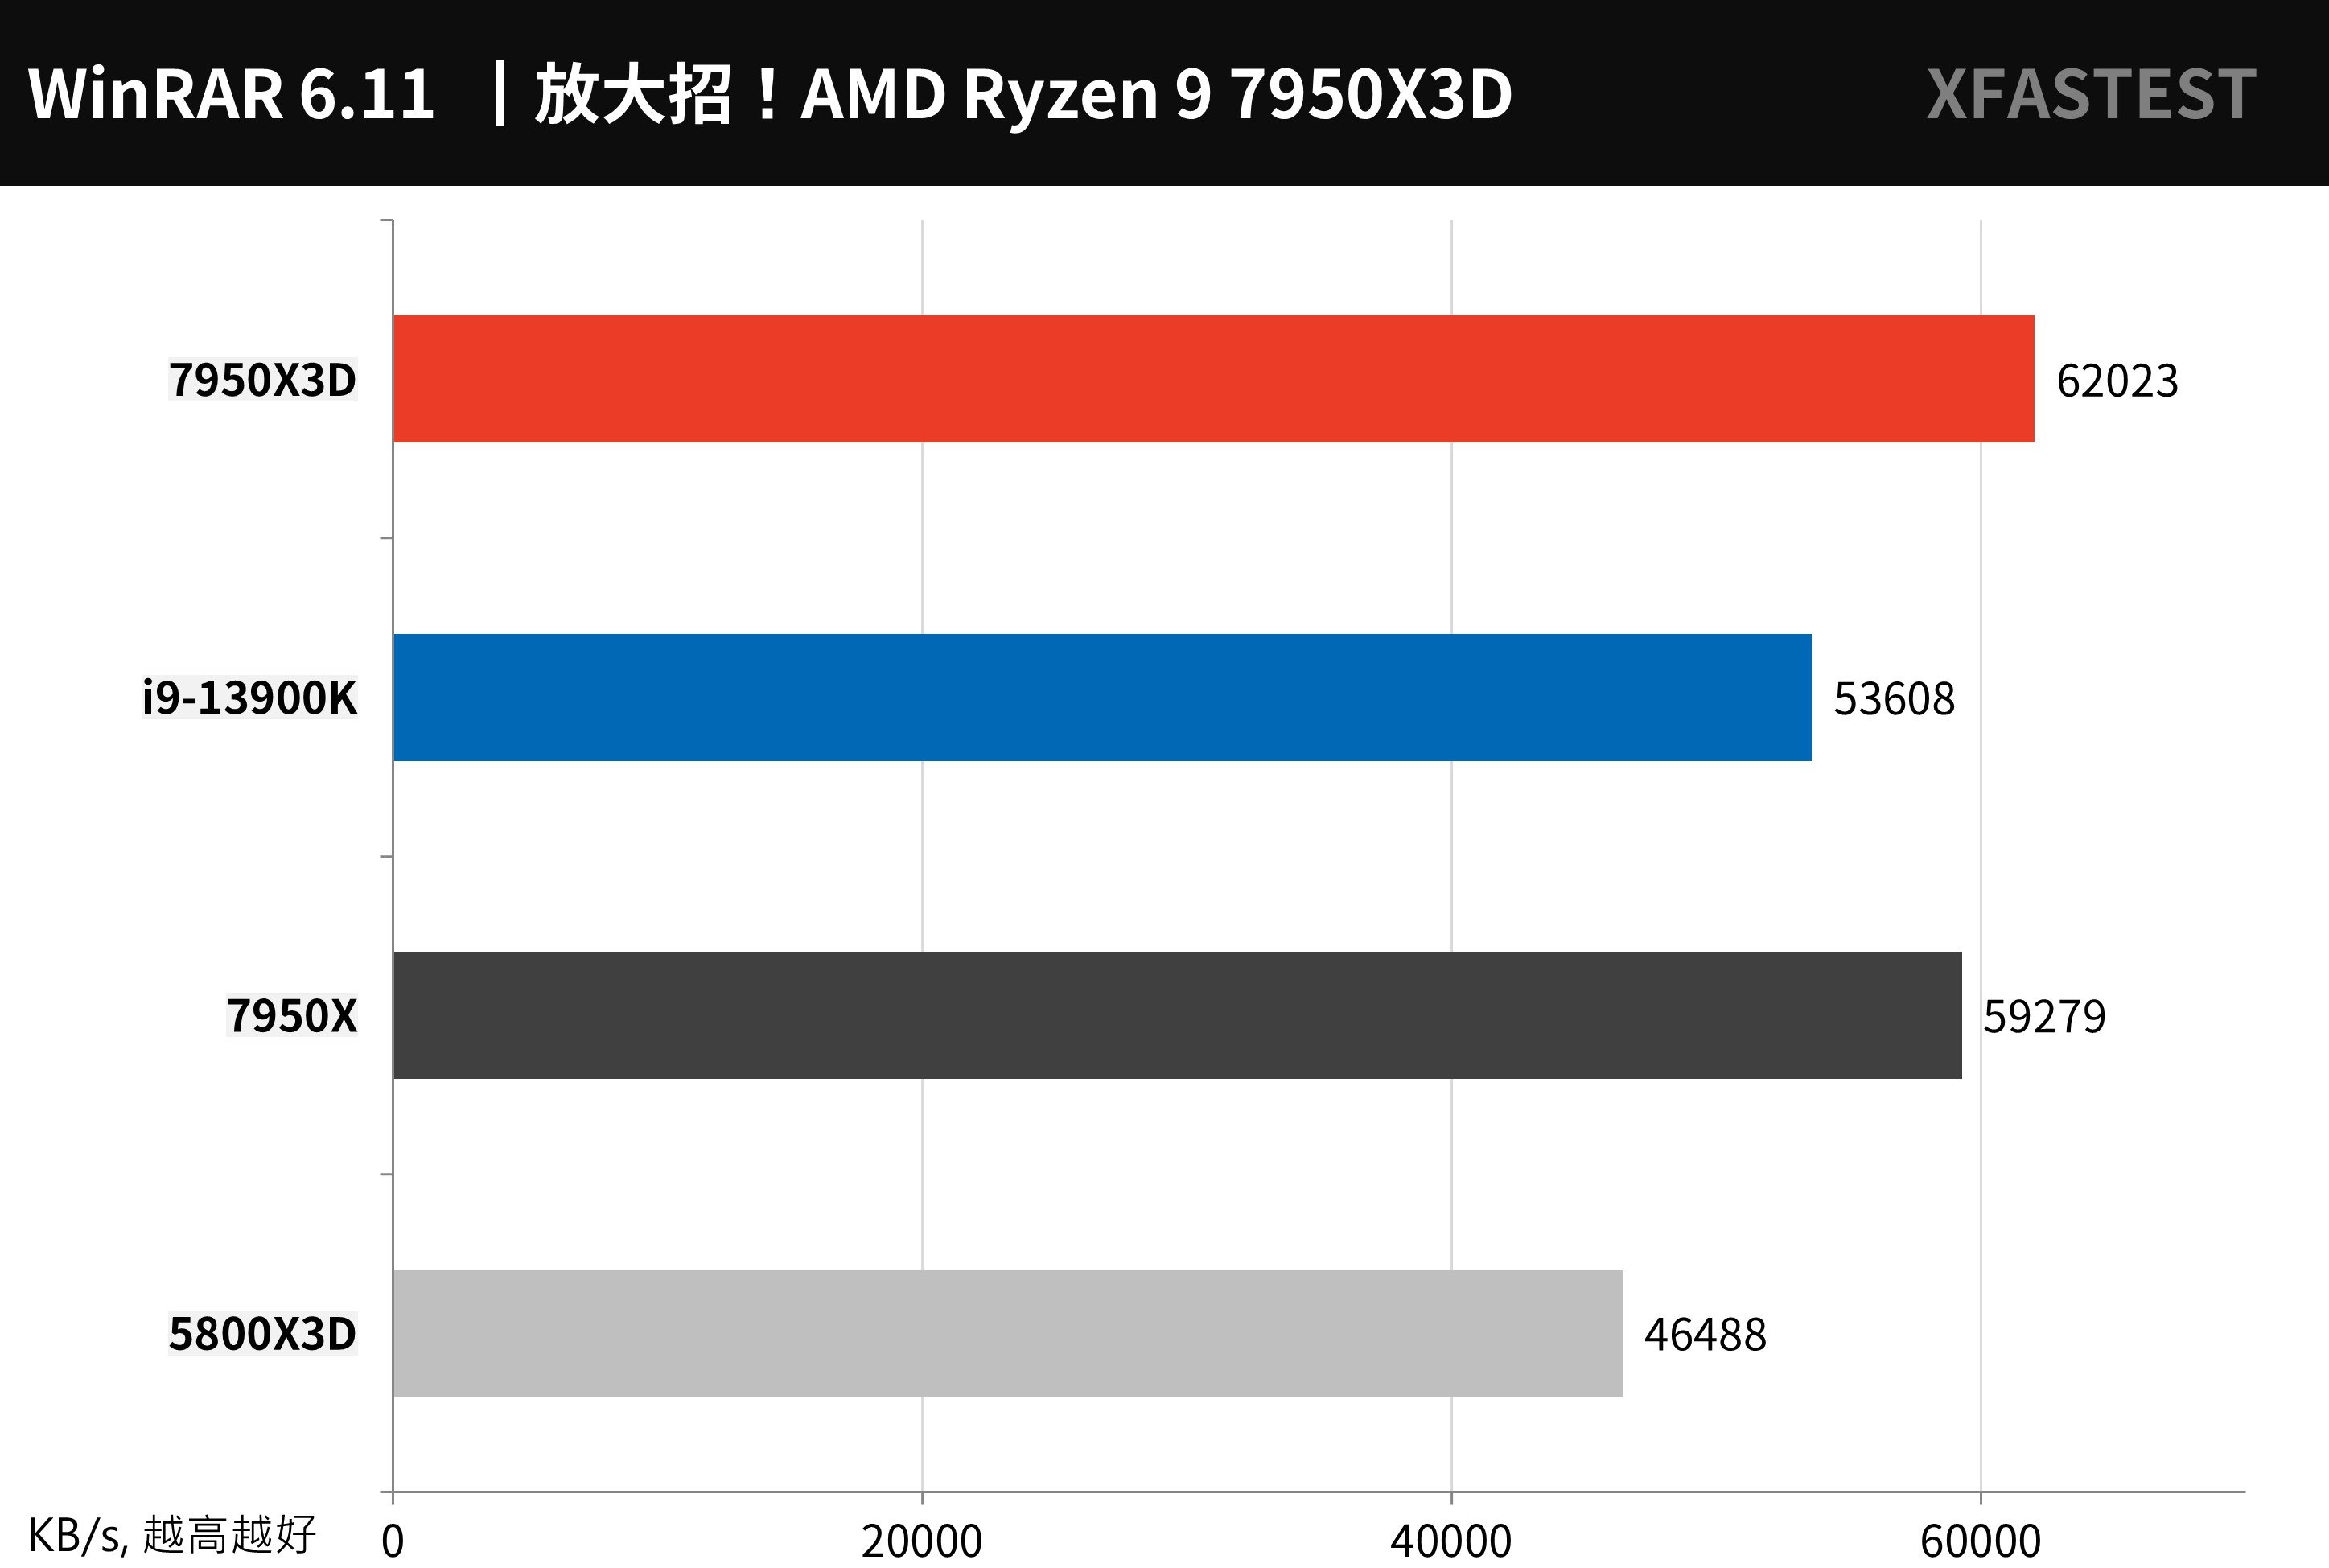
↑ WinRAR, the higher the better.
7-Zip Another well-known and free compression tool can effectively use multi-core performance. 7950X3D compresses 189.3 GIPS and decompresses 263.3 GIPS. The performance is slightly inferior to 7950X but still better than i9-13900K.
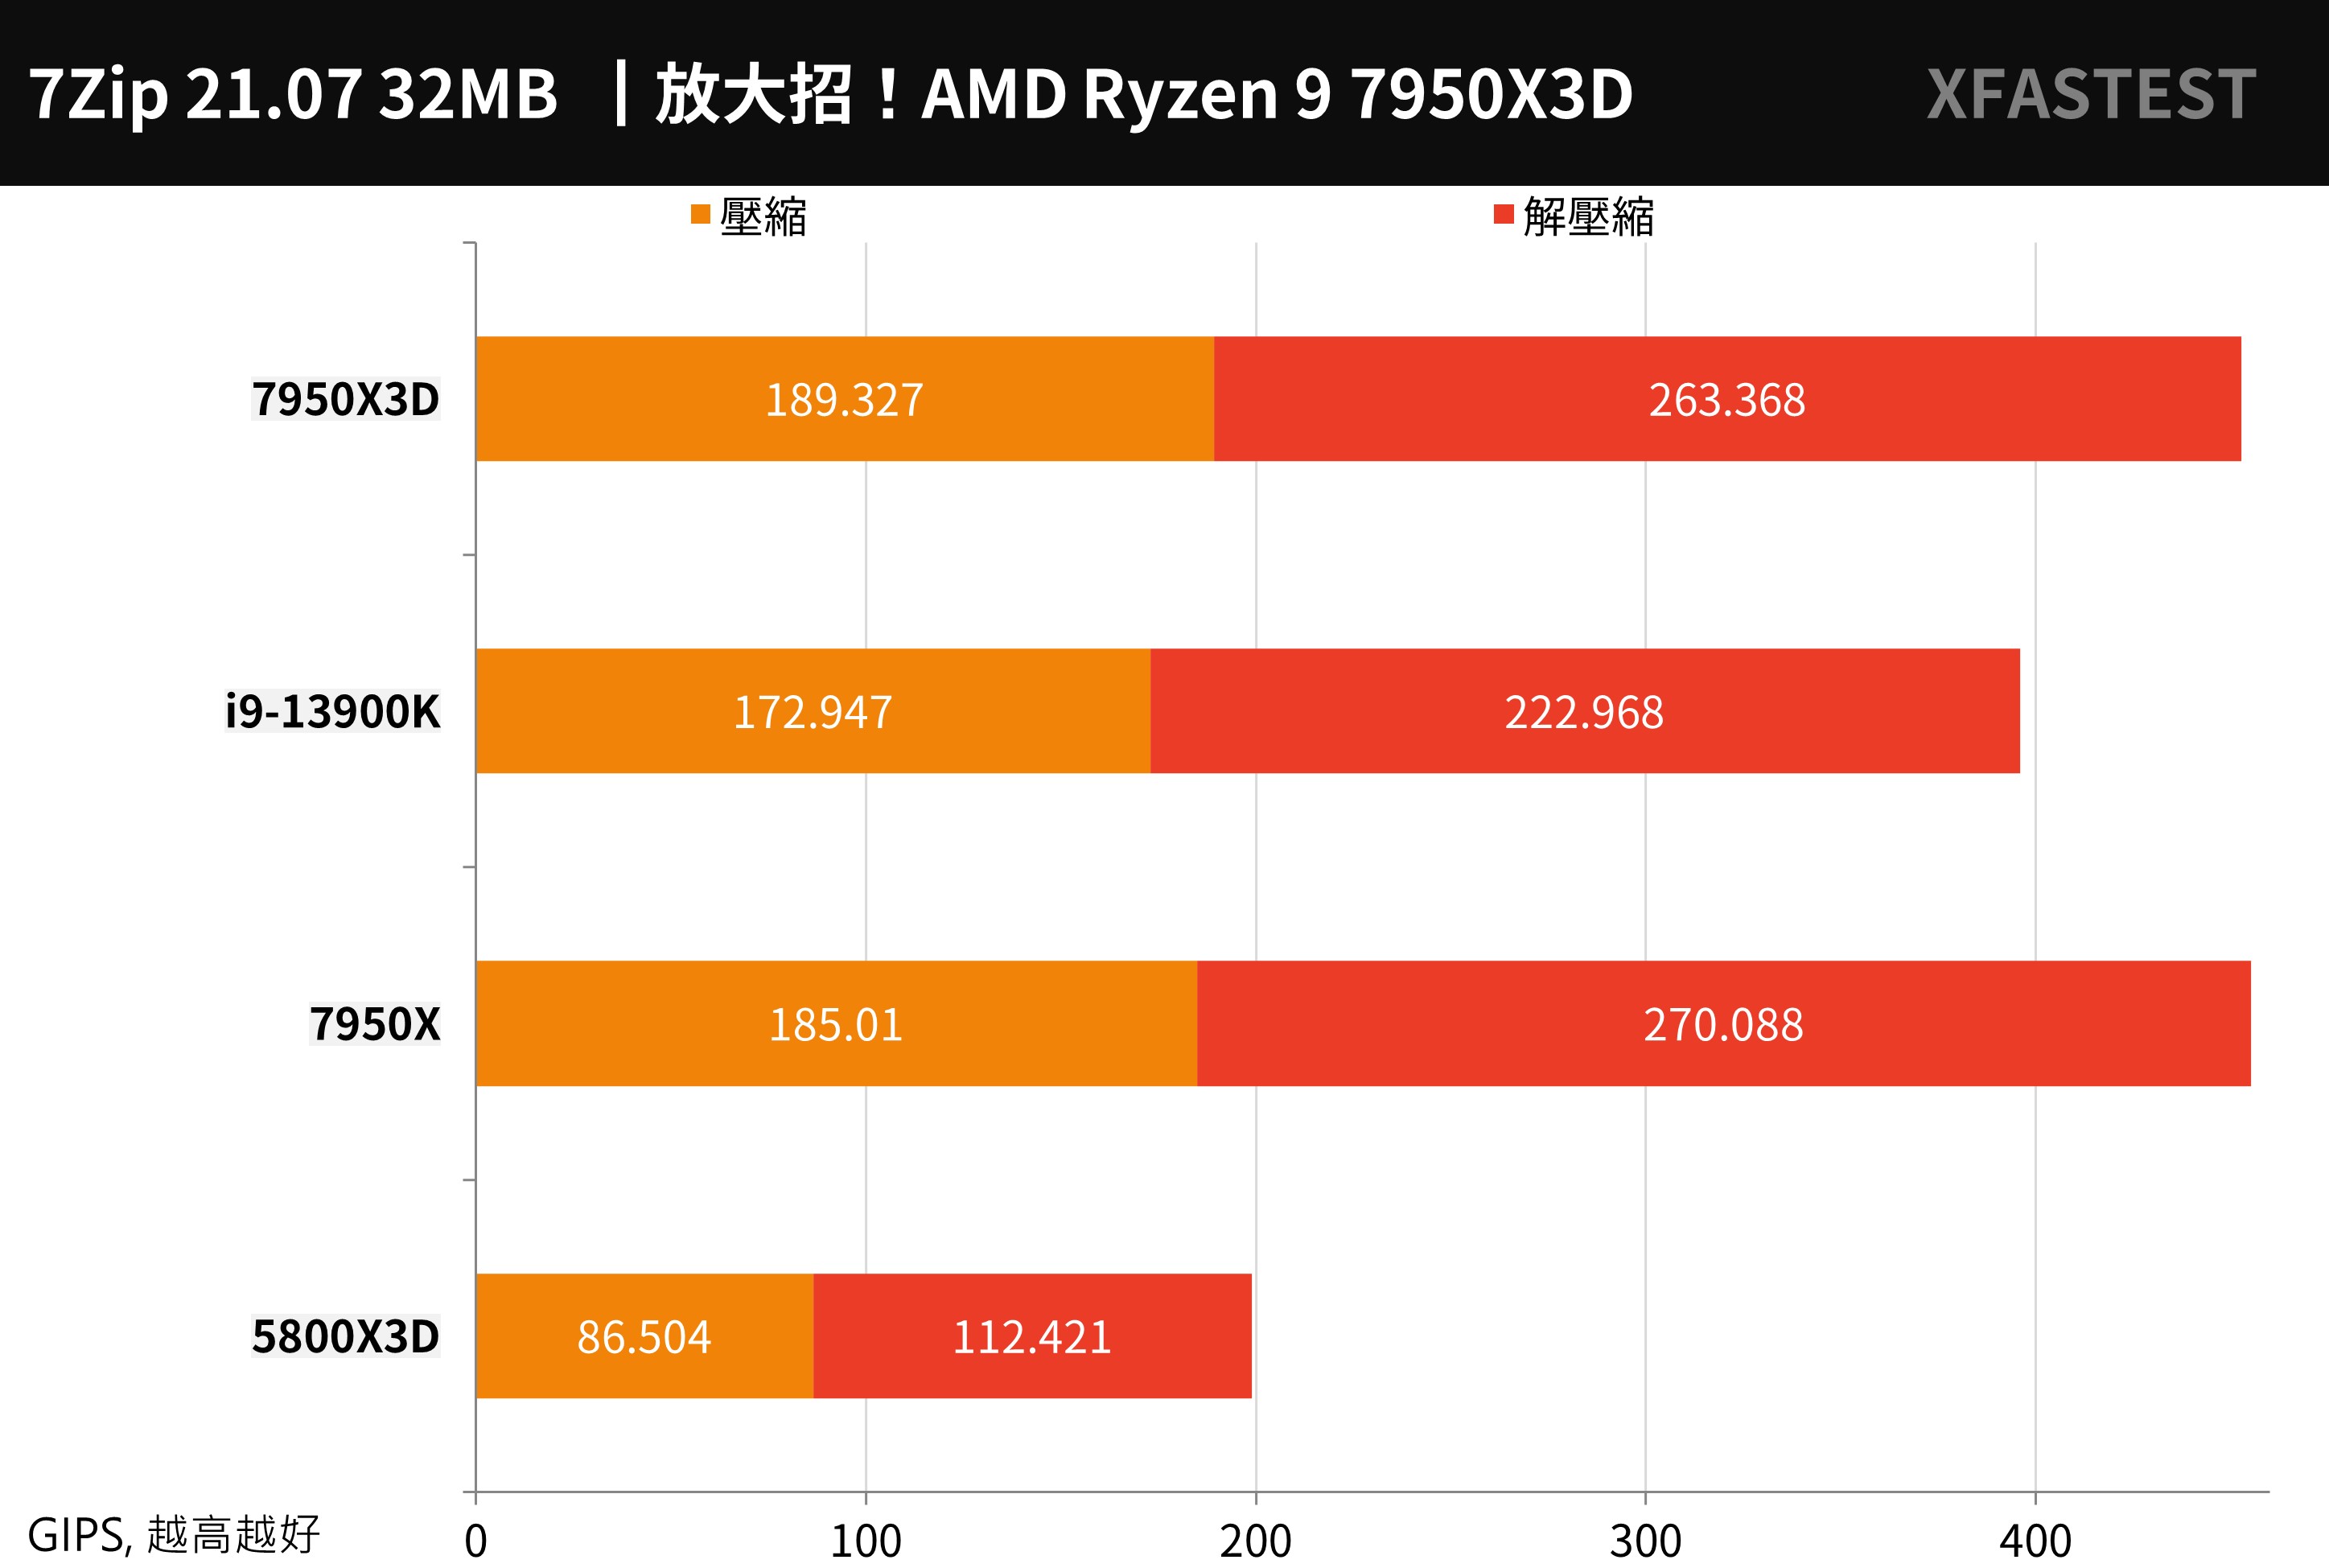
↑ 7-Zip, the higher the better.
PCMark 10, CrossMark and Office PC Benchmarks
The overall performance of the computer is first PCMark 10 For the test, you can score the basic computer work of Essentials, such as App startup speed, video conferencing, and web browsing performance. The Productivity productivity test uses spreadsheets and paperwork as test items. Digital Content Creation video content creation, then Tested on photo/video editing, rendering and visualization.
The 7950X3D achieved a total score of 10235 points. The overall performance of the computer was slightly lost to the 7950X by about -3.6%, but it was better than the i9-13900K by about 2.6%.
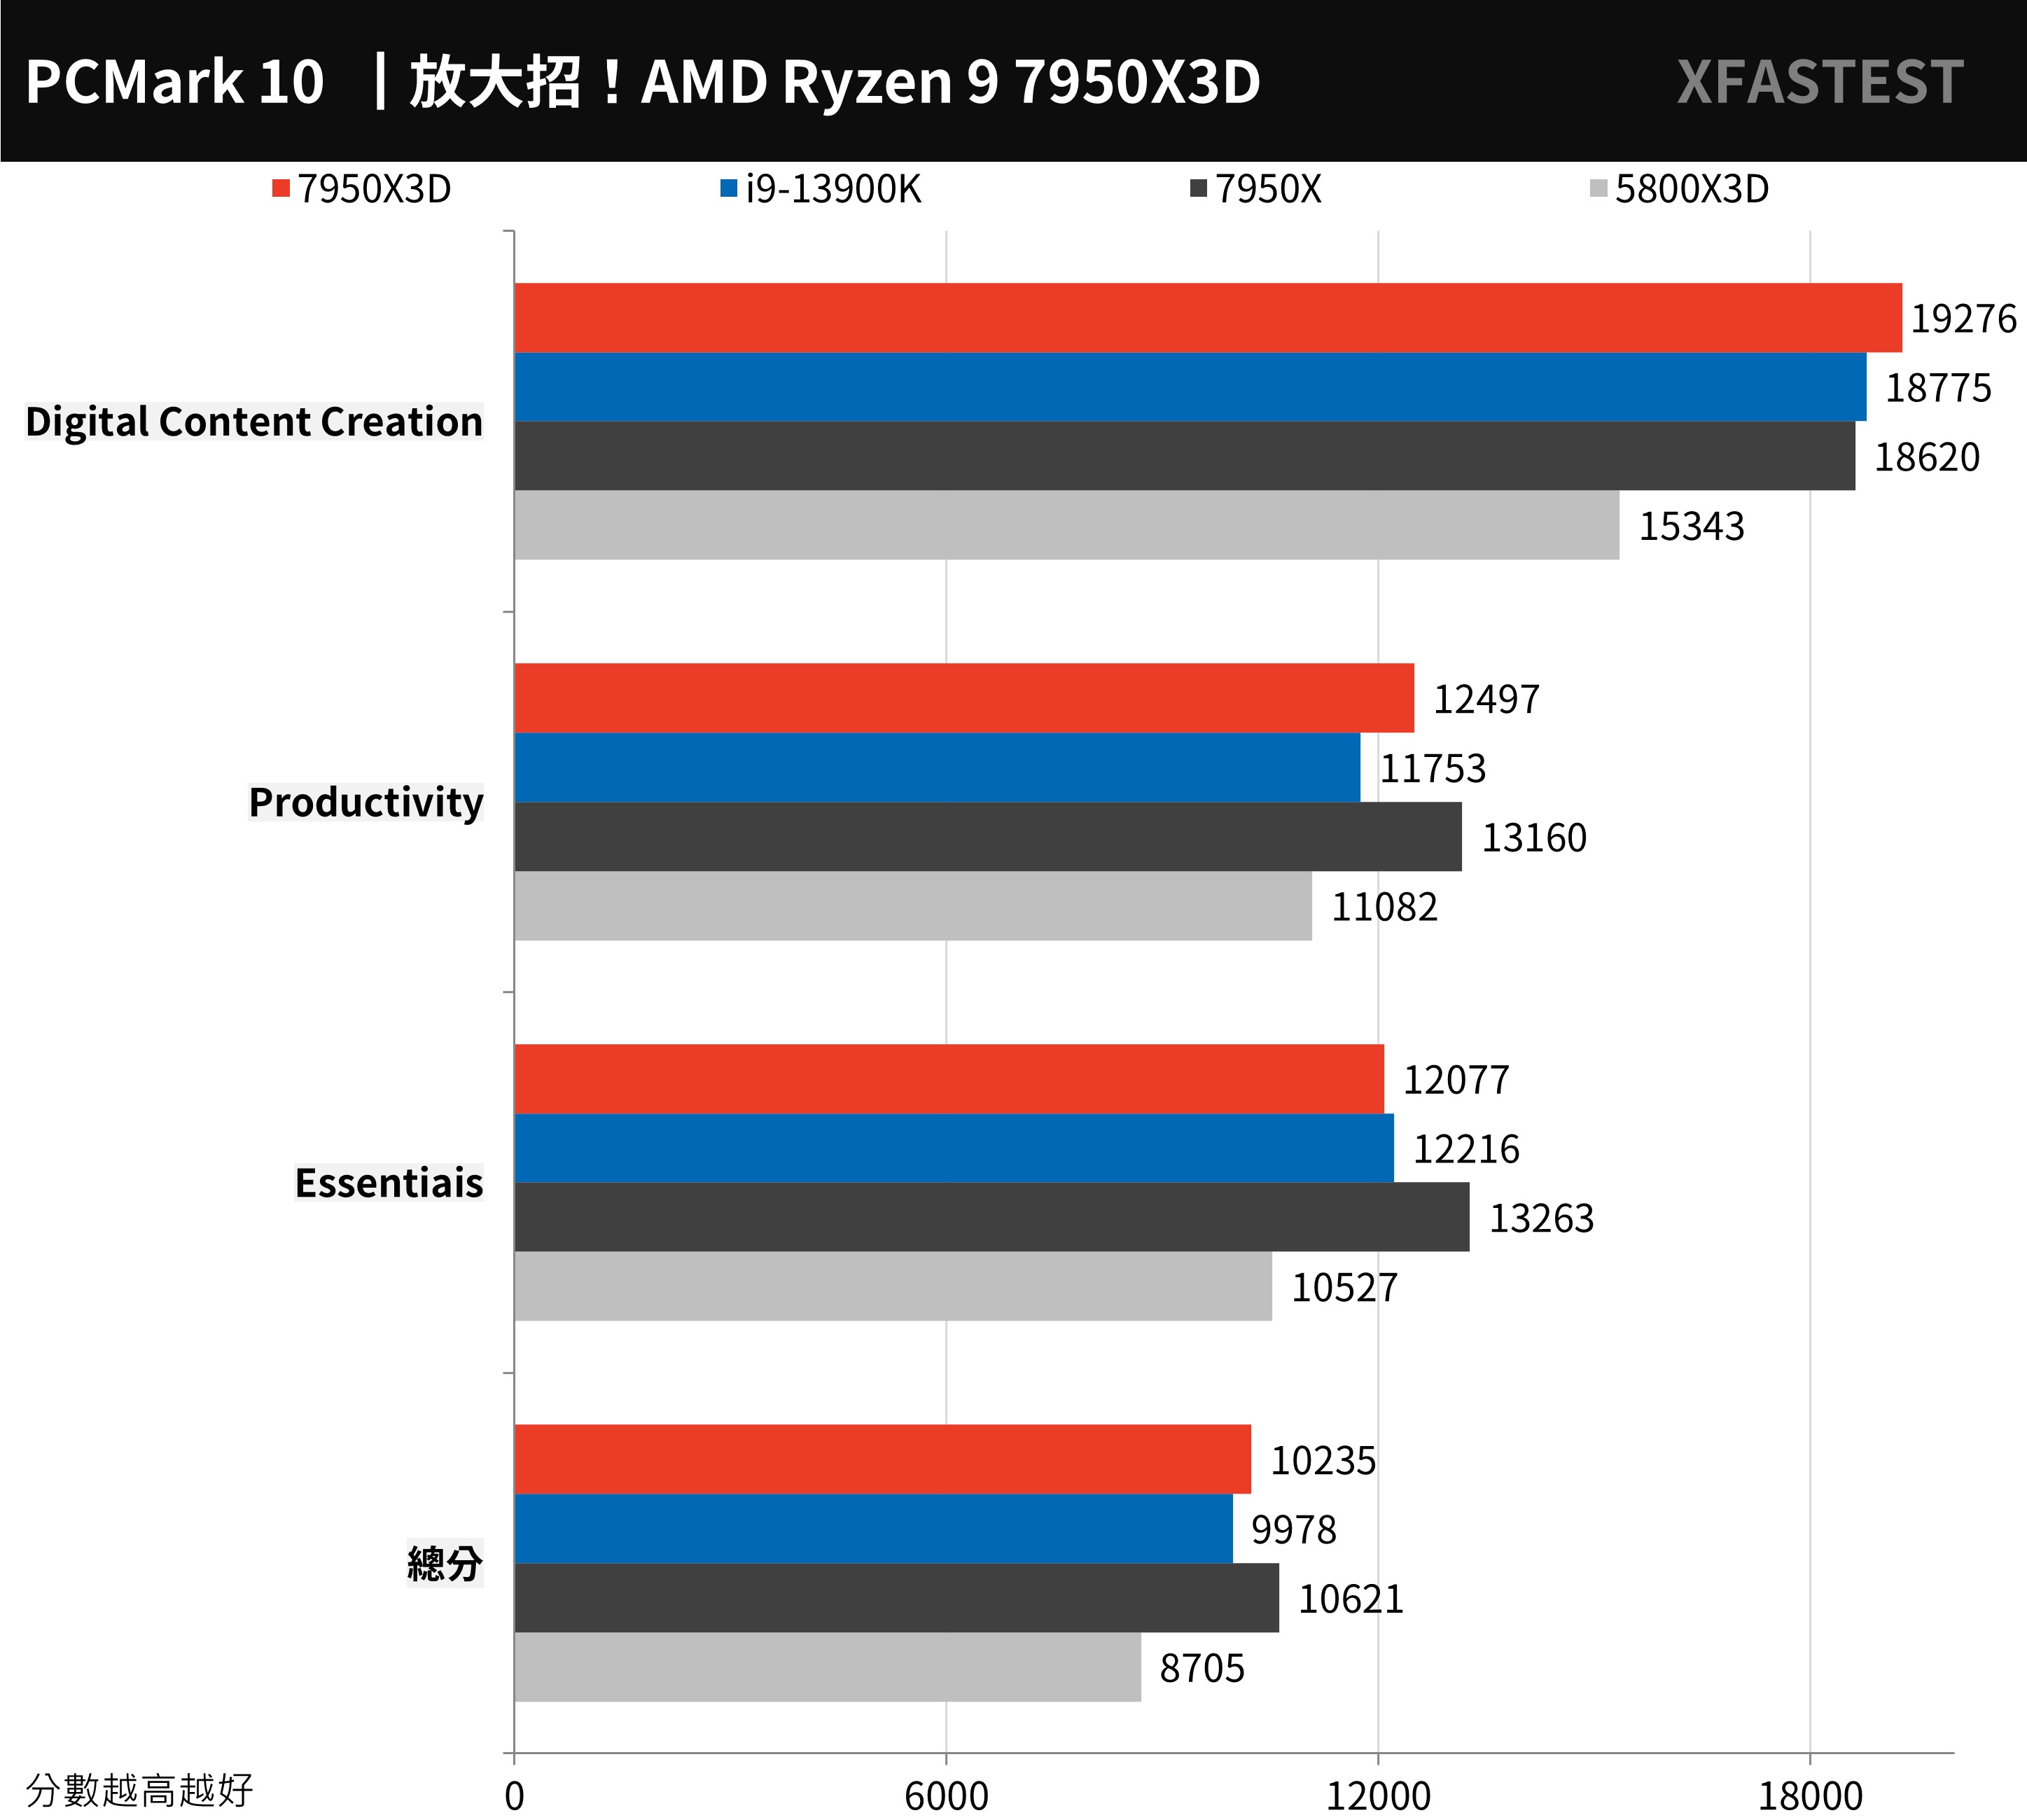
↑ PCMark 10, the higher the better.
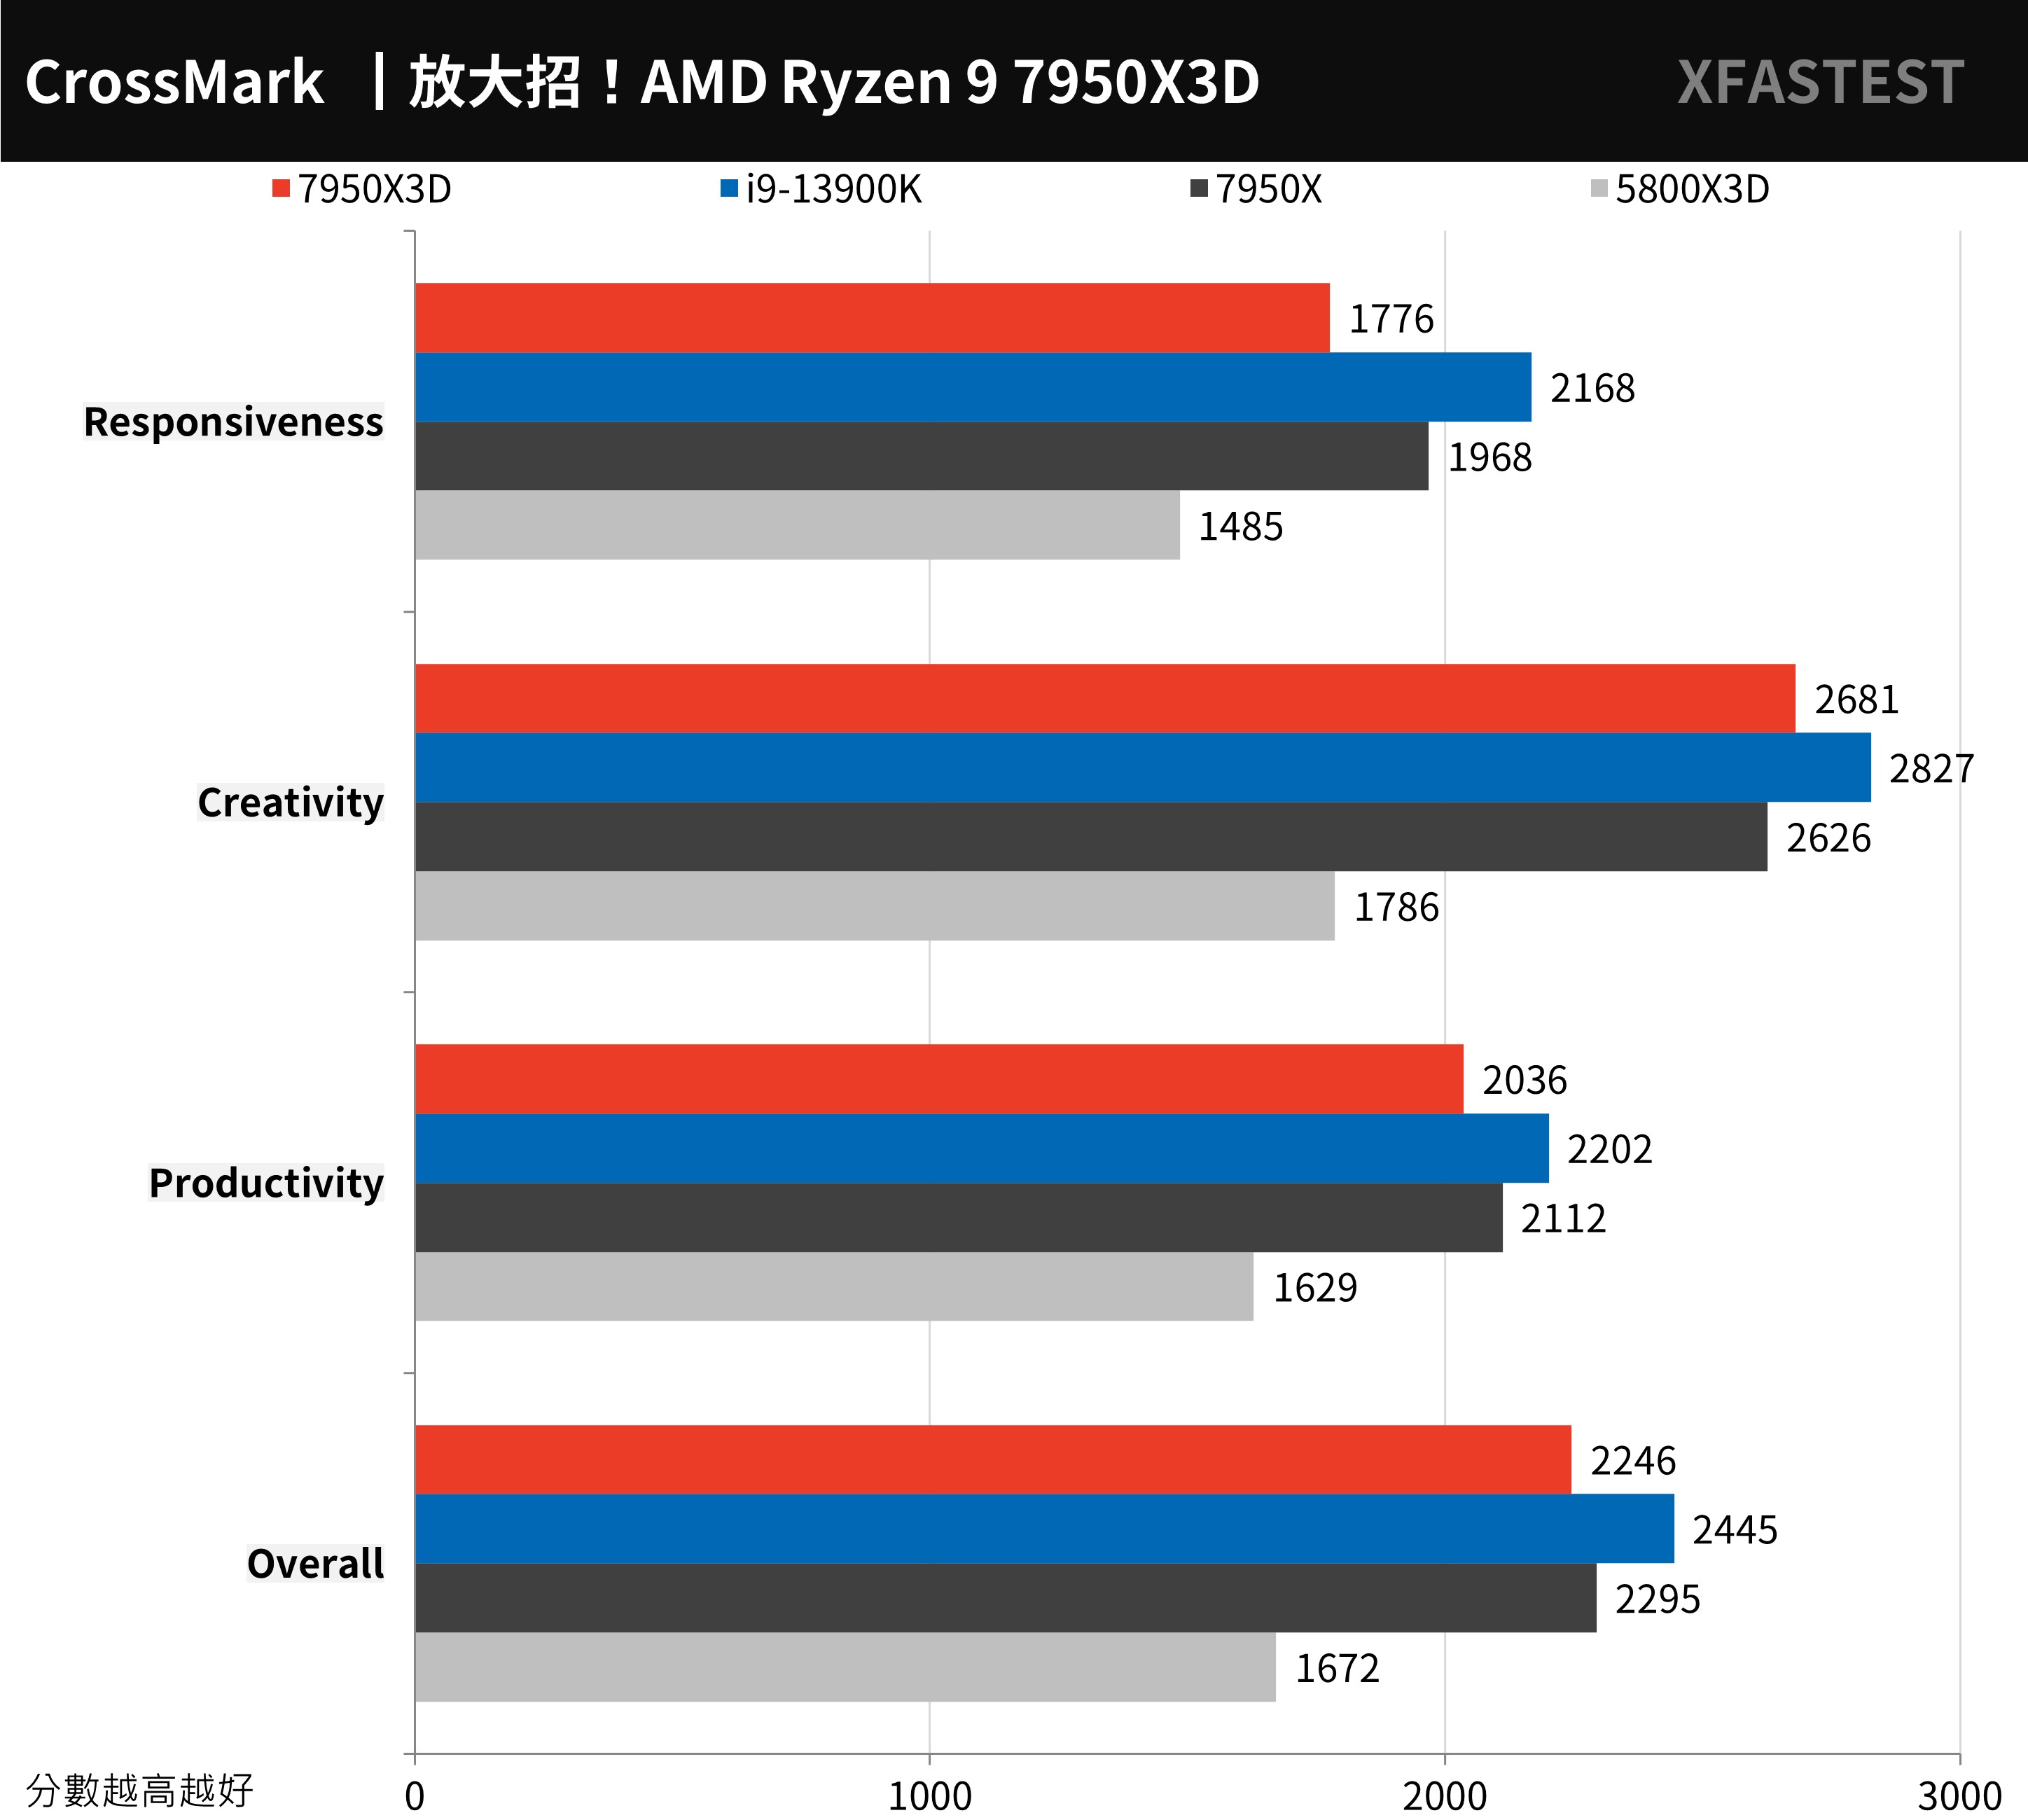
Cross-platform computer performance testing tool CrossMarkis a free test tool developed by BAPCo that supports platforms such as Windows, iOS/iPadOS, macOS, and Android, and is aimed at computer productivity, such as text editing, spreadsheets, web browsing, and creative photo editing, organizing, and Video editing and other work, plus computer response speed for testing.
7950X3D achieves 2246 points, which is about -2.1% lower than 7950X, but the Intel processor has a greater advantage in this project.
↑ CrossMark, the higher the better.
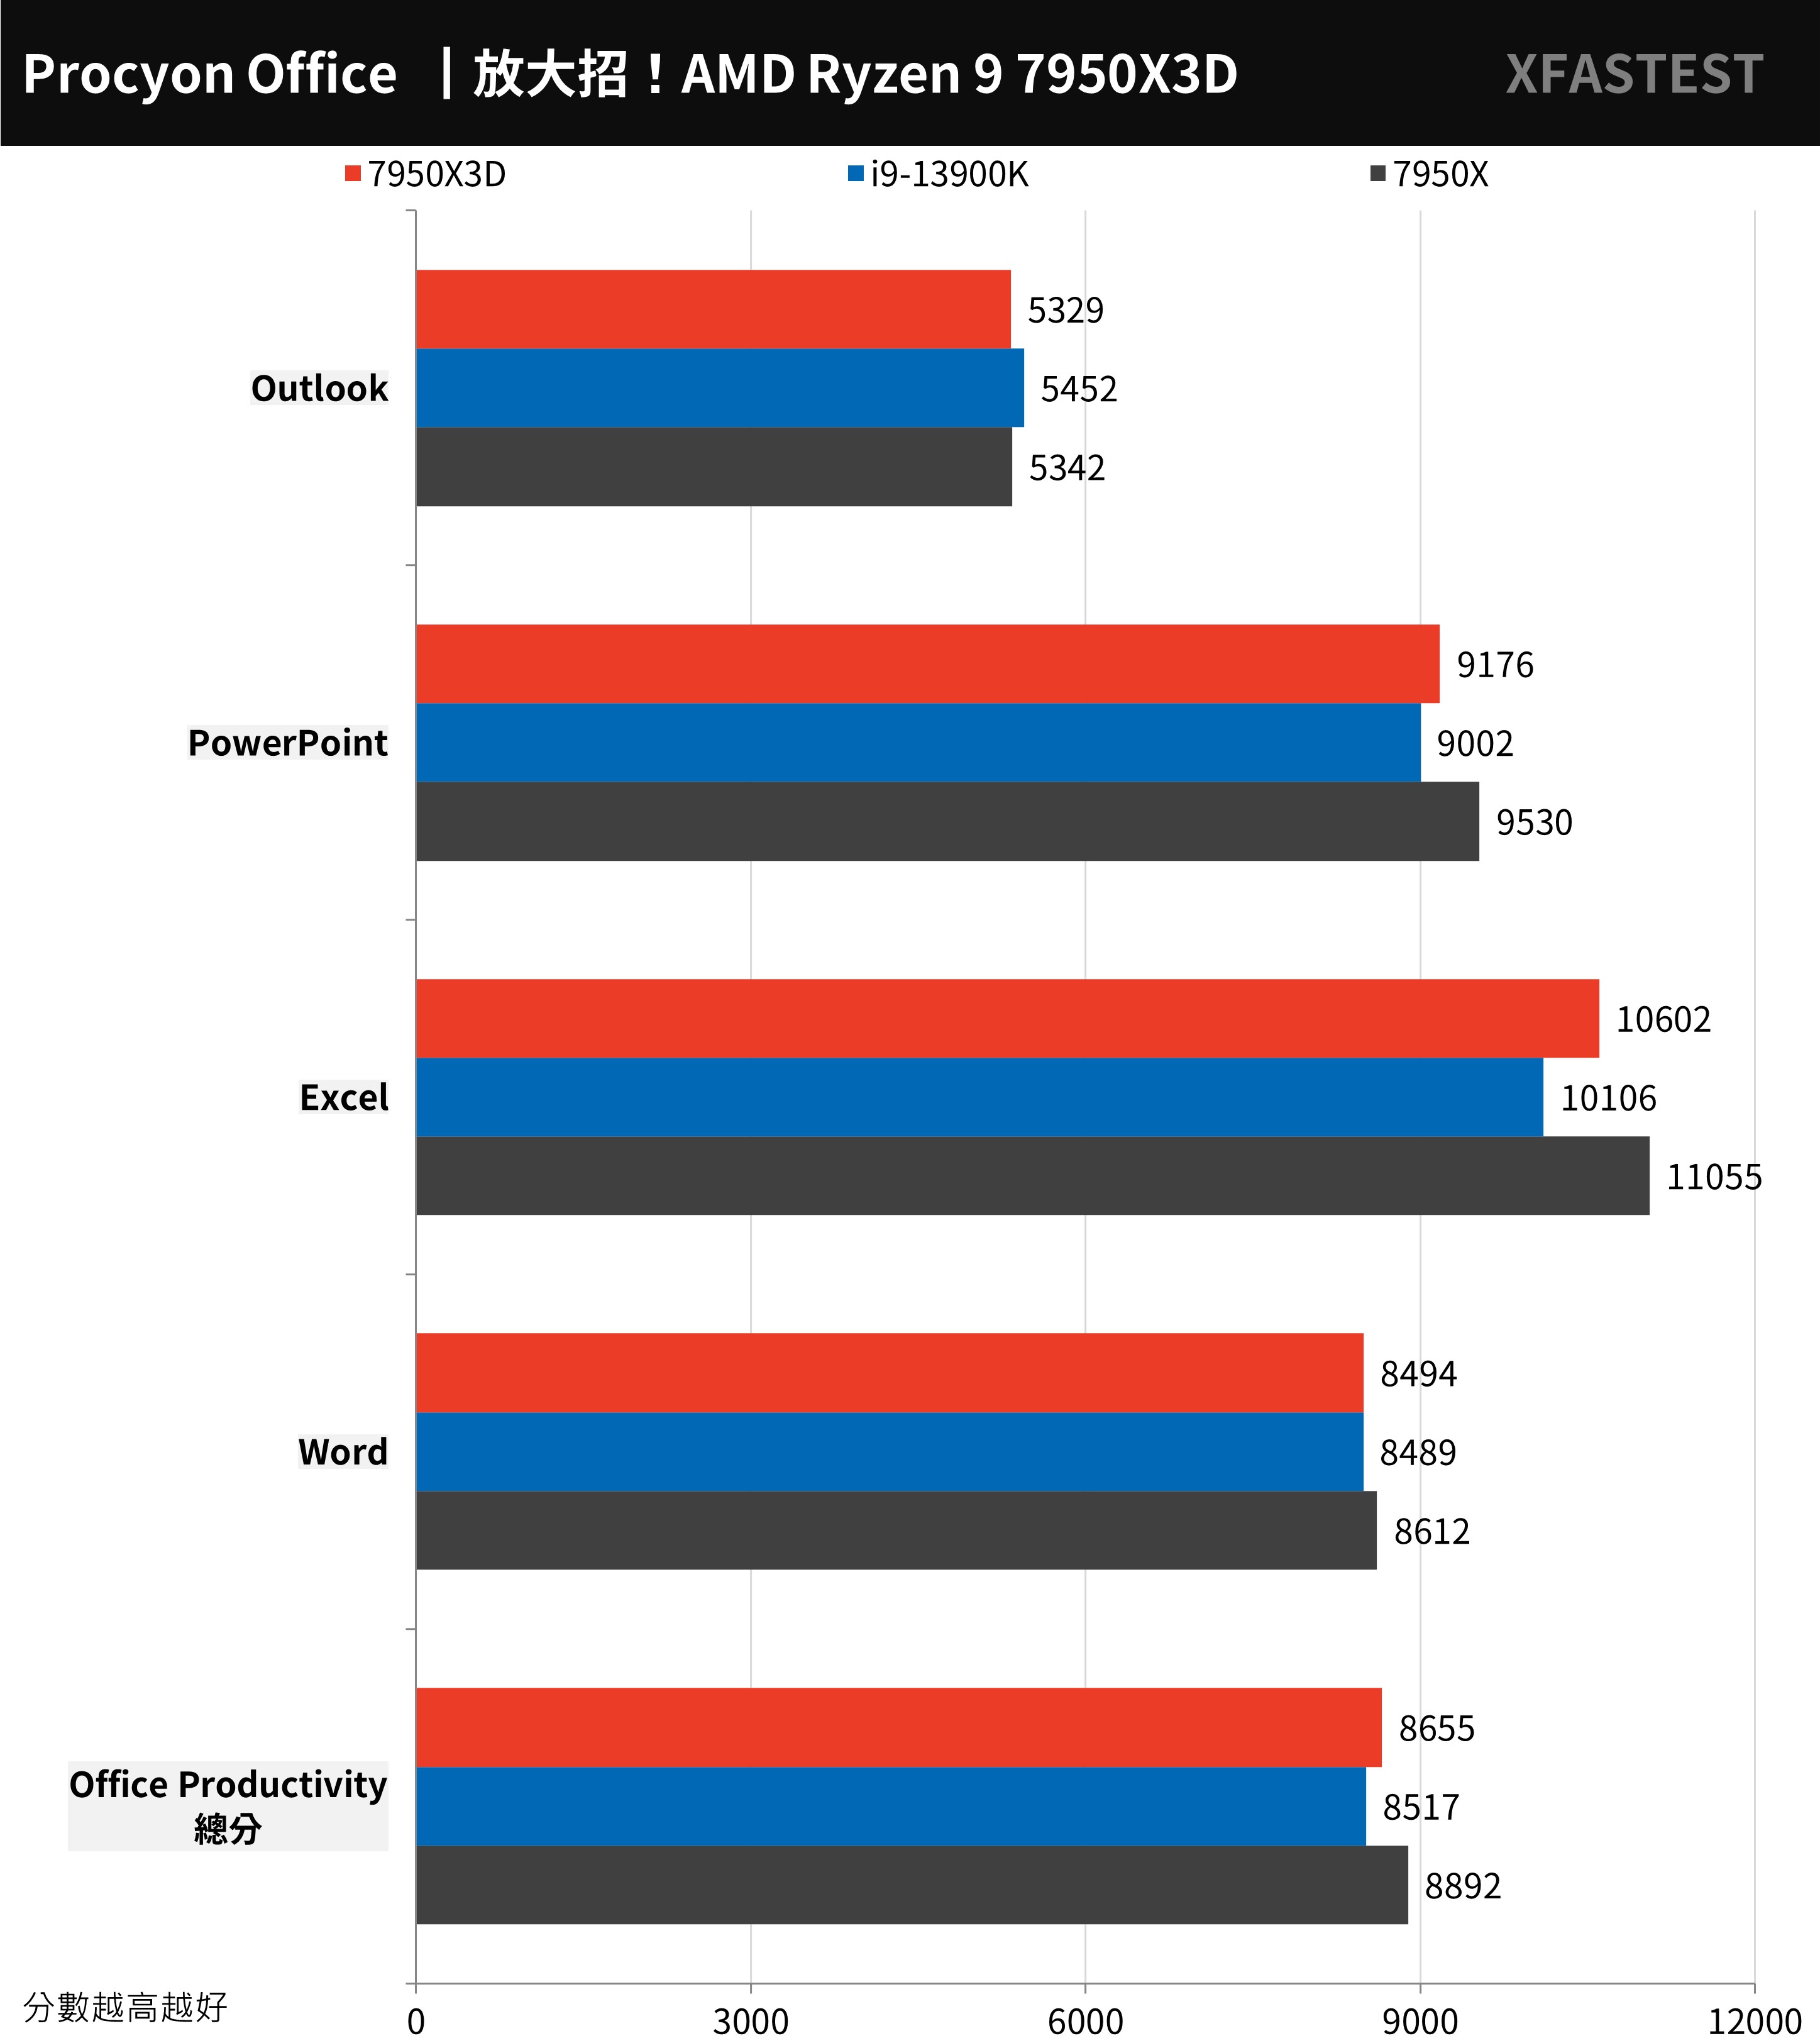
UL Procyon The office productivity benchmark test uses Microsoft Word, Excel, PowerPoint and Outlook to test the practical and real performance of Windows computers in daily work, and uses common paperwork to design test situations, from document opening, copying, input, and spreadsheet Calculation, sorting, exporting, adding files, image files, videos, and sending and receiving emails to presentations.
The 7950X3D achieved a score of 8655, which means that the three processors are quite close in terms of word processing performance.
↑ UL Procyon, the taller the better.
3DMark CPU Performance and Fire Strike, Time Spy Benchmark Test
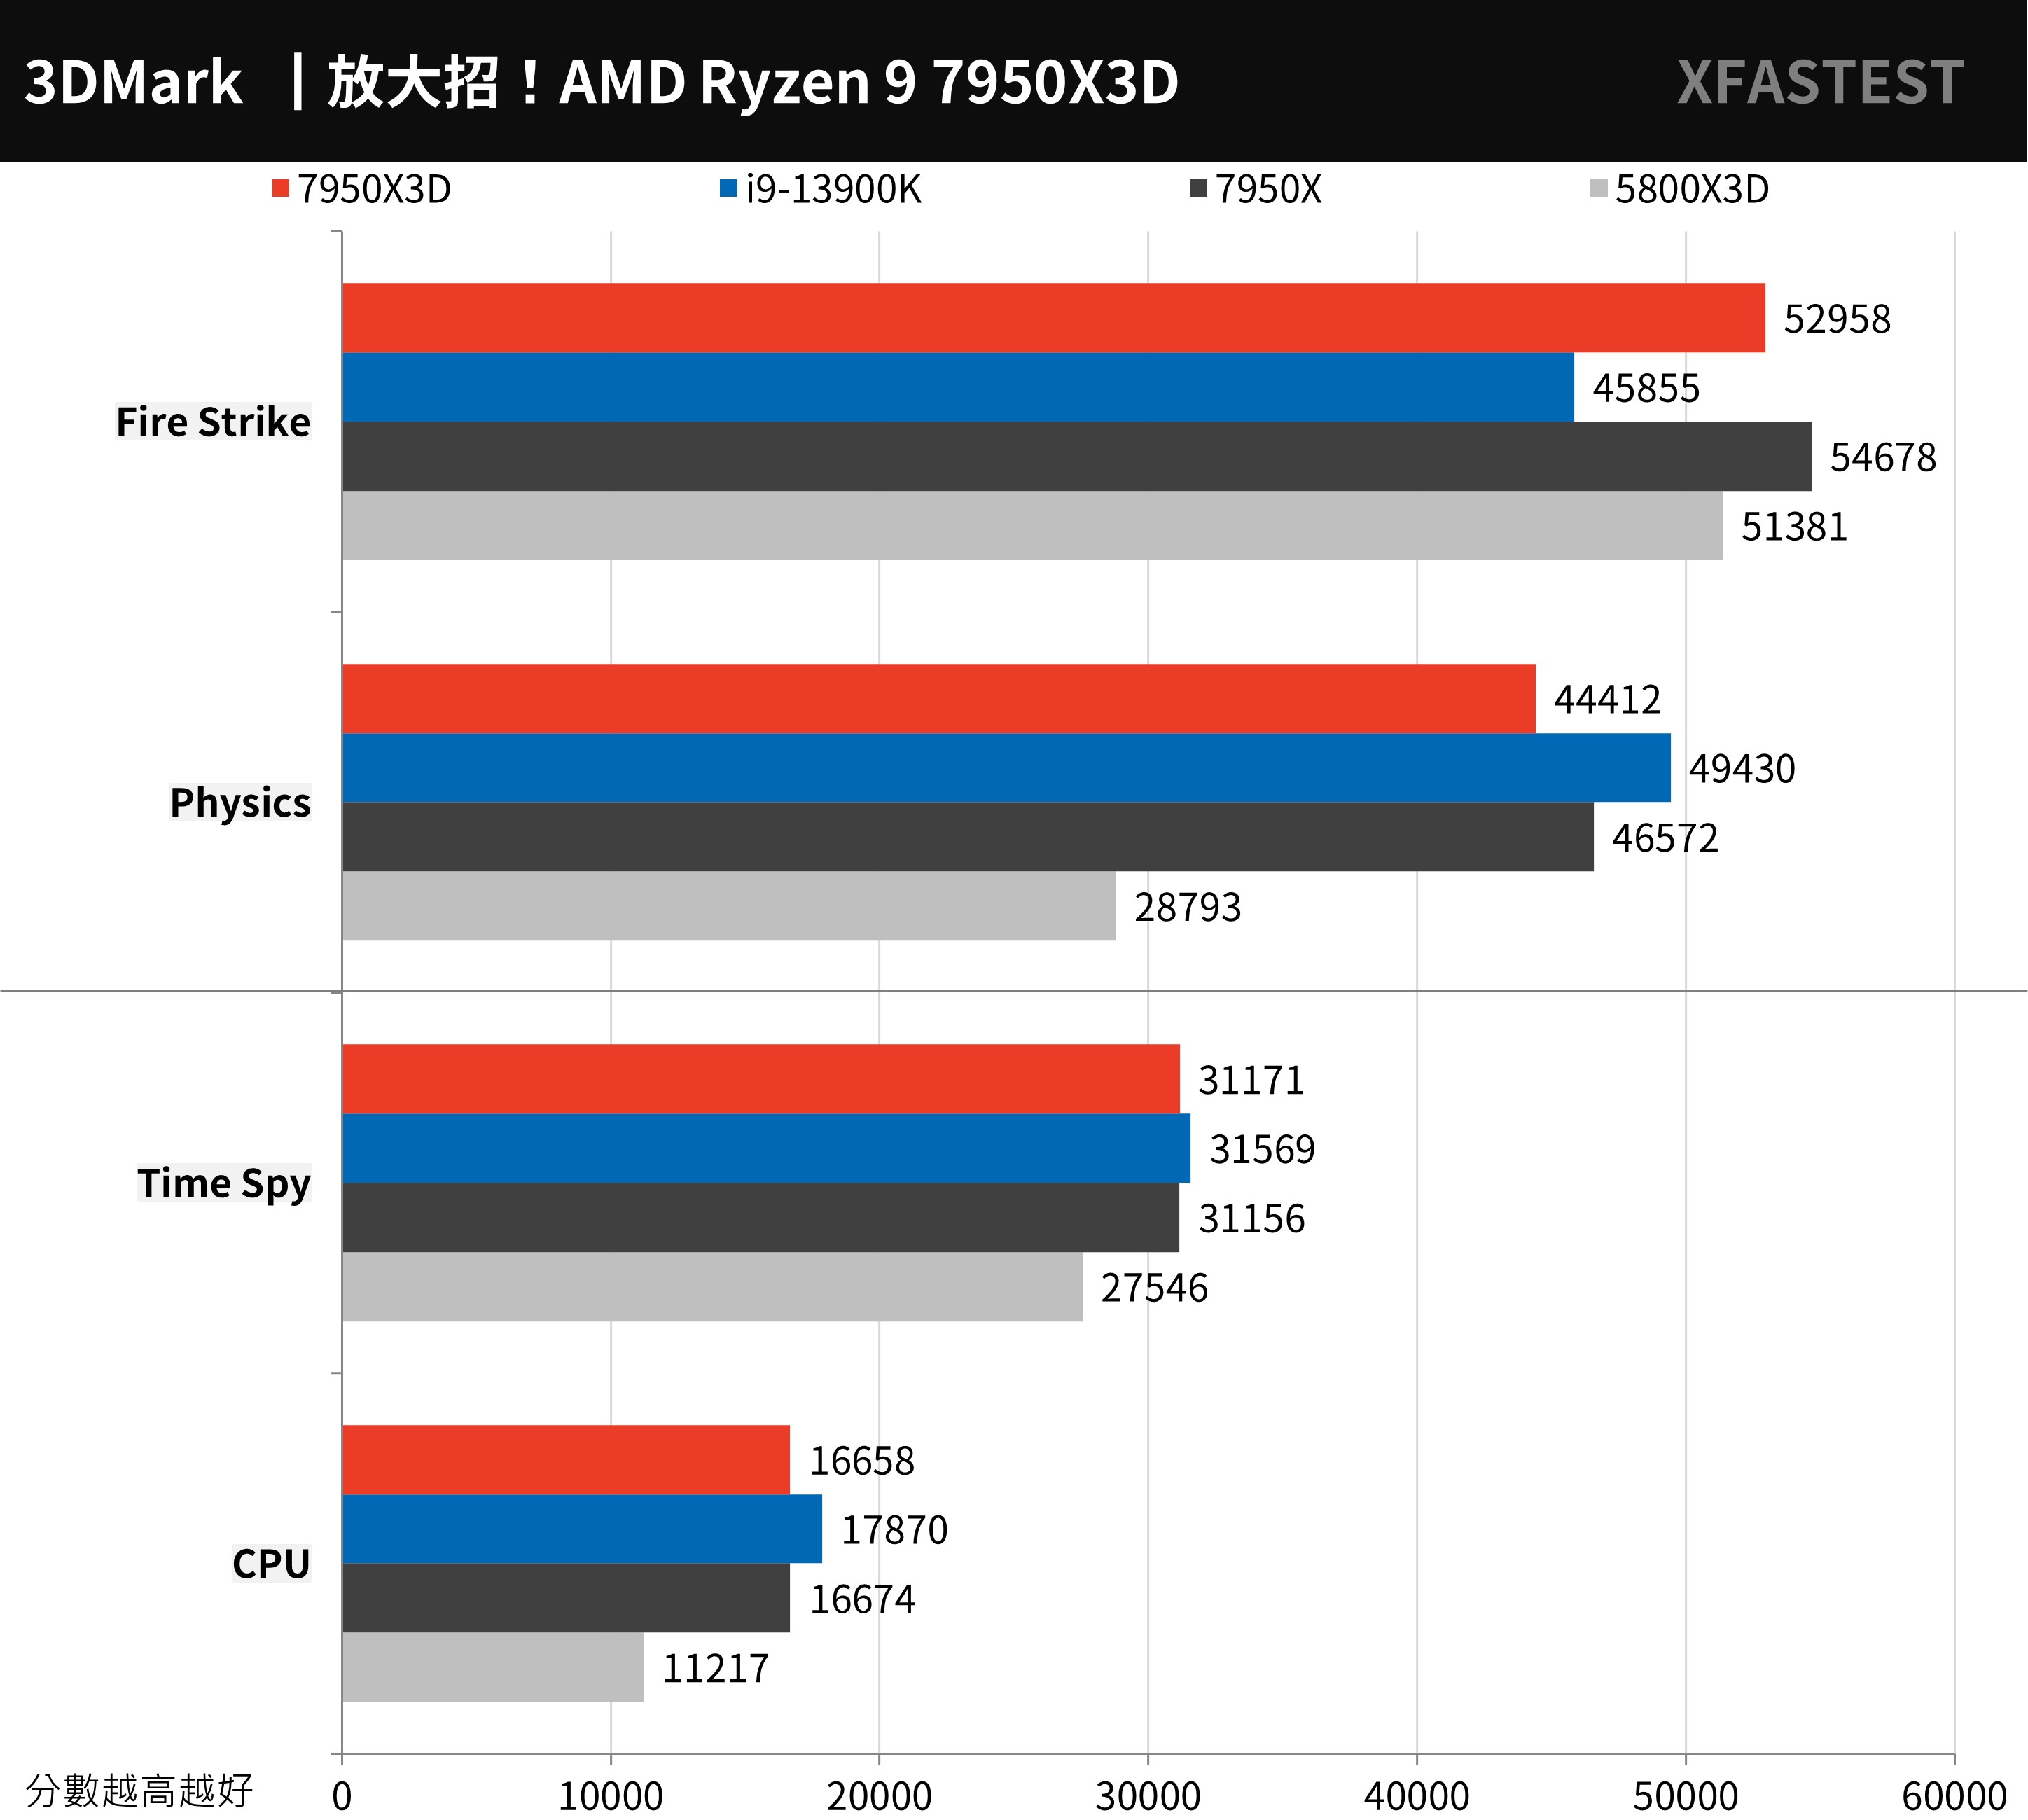
Computer graphics game performance testing tool 3DMarkthe mainstream Direct X11 test Fire Strike and Direct X12 Time Spy test.
The Fire Strike Physics physical score is 7950X3D with a score of 44412 points, a small loss of -4.6% compared to the 7950X, and a small loss of -10.2% compared to the i9-13900K.
However, the total score of Time Spy is the same among the three, but the CPU score is 7950X3D and 7950X are quite small and lost to i9-13900K.
↑ 3DMark, the higher the better.
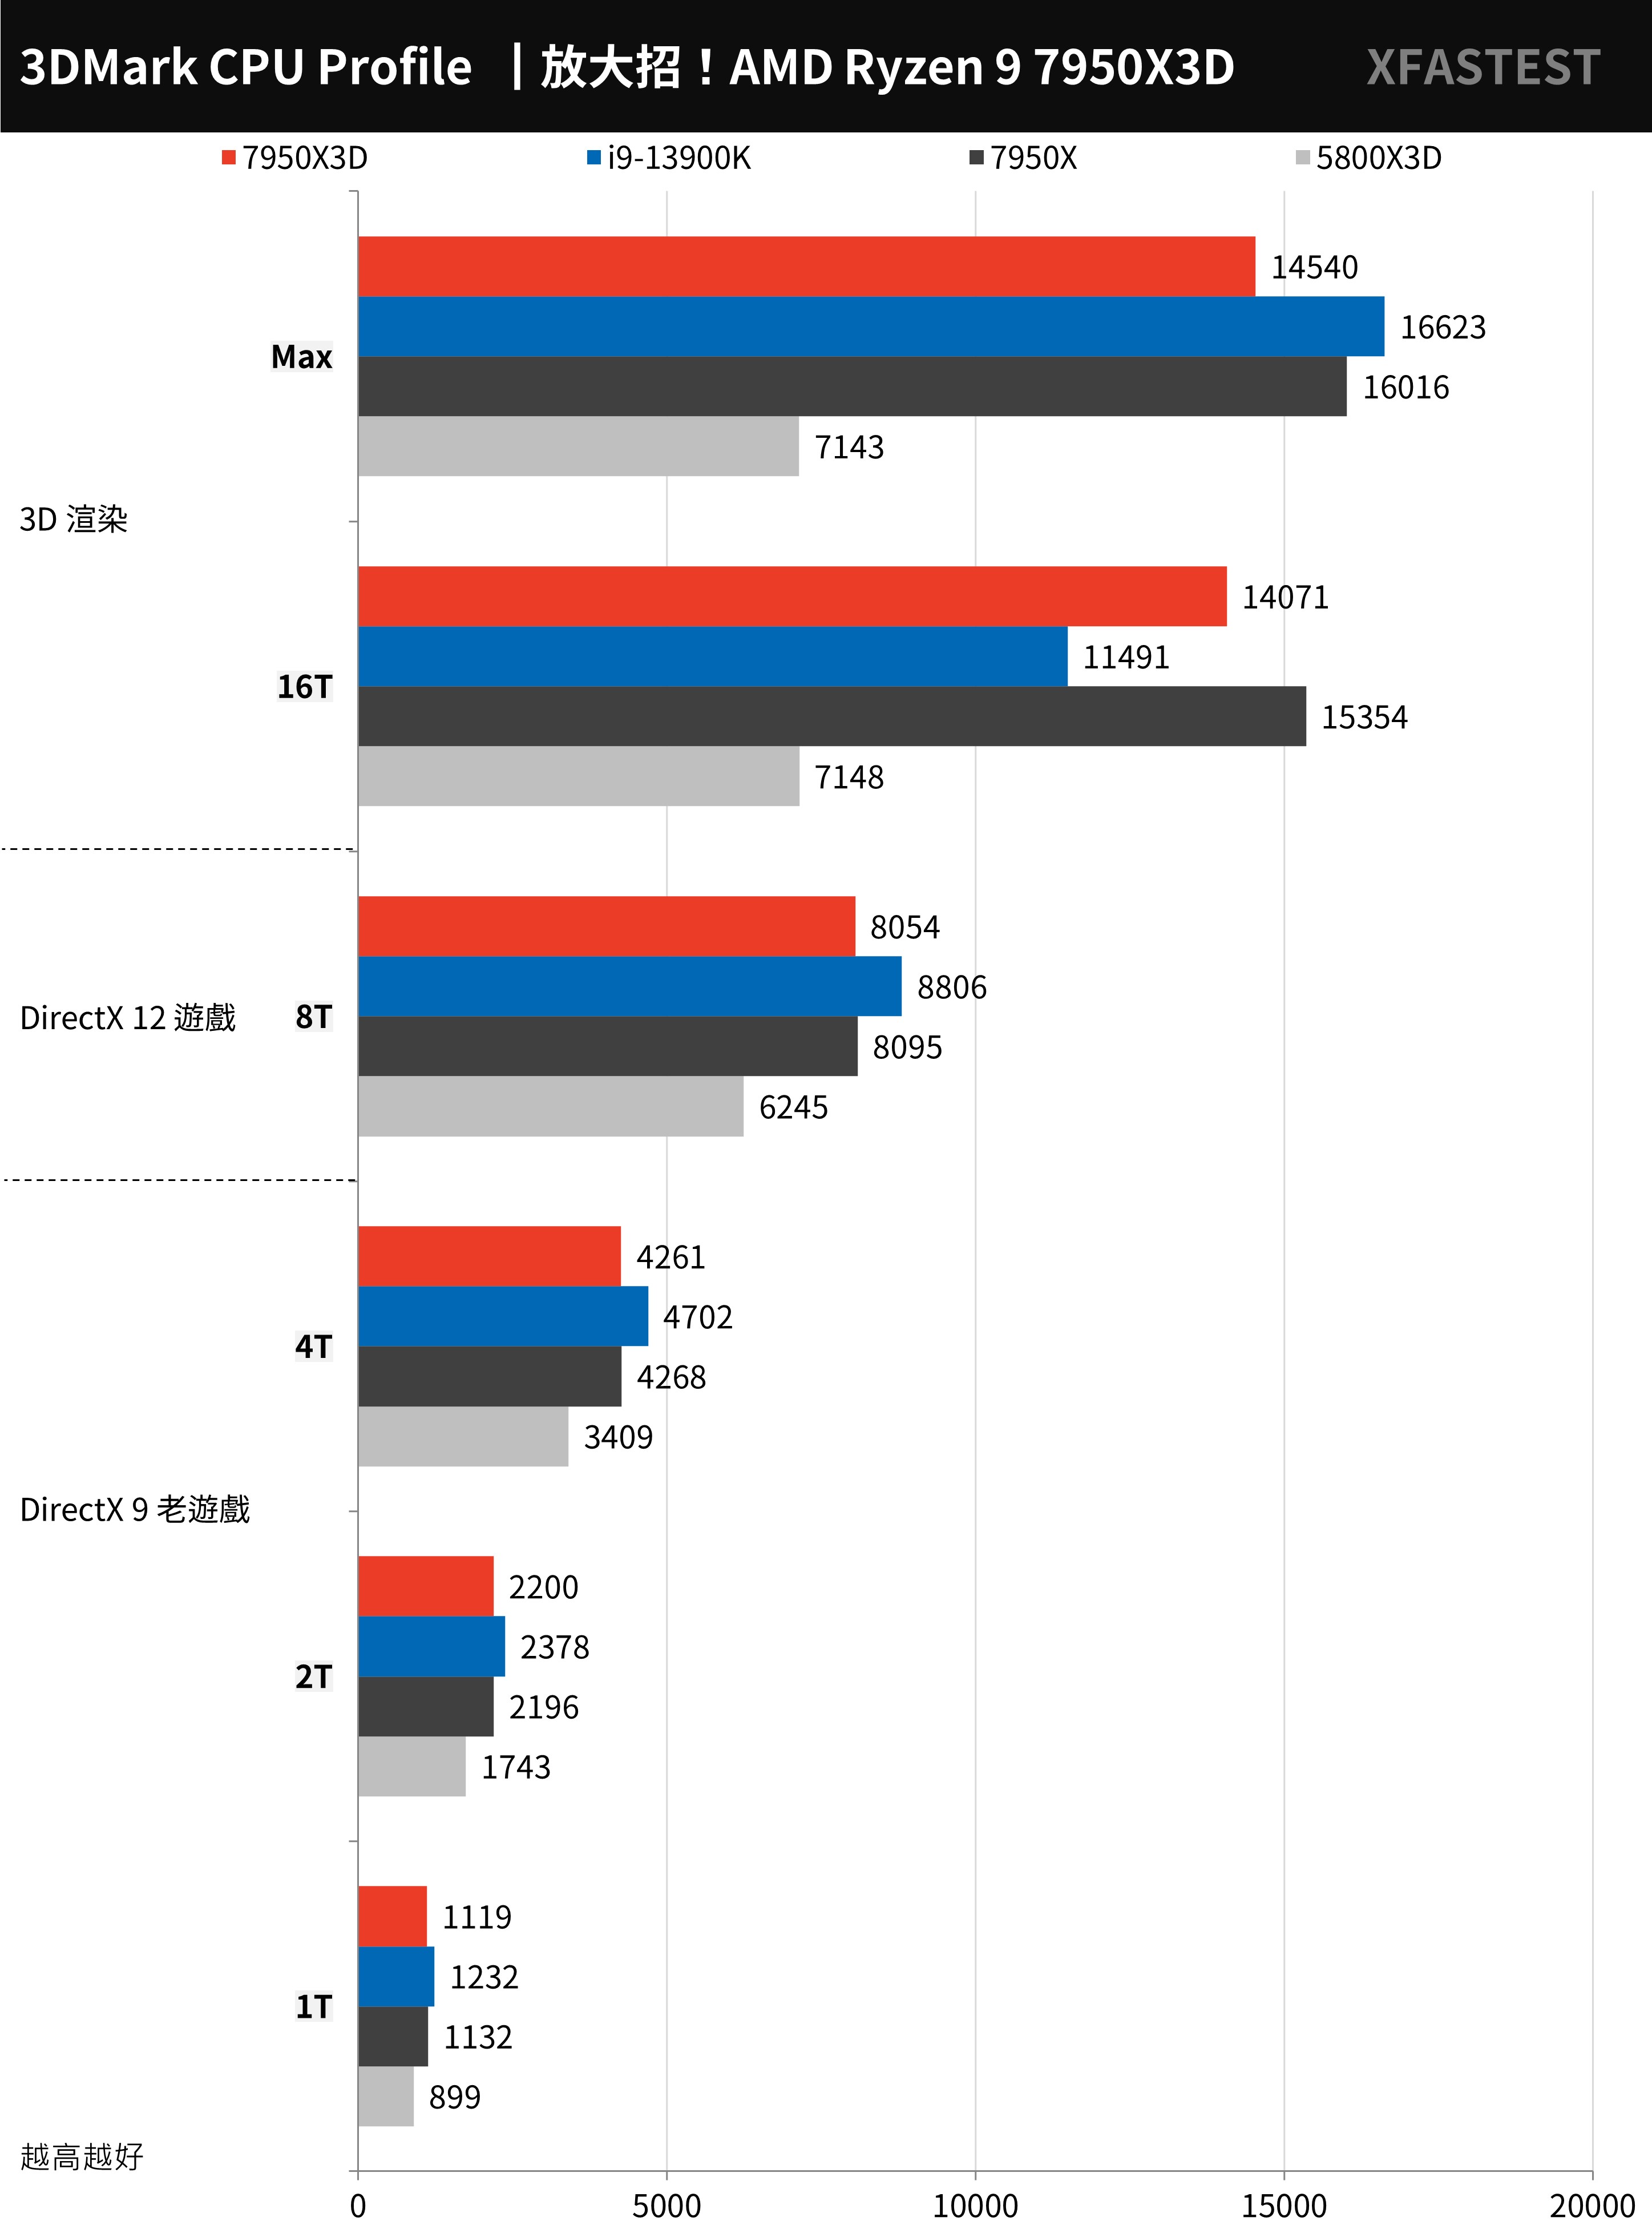
3DMark CPU The test mainly tests the physical operation and custom simulation of the CPU, and tests the performance of 1, 2, 4, 8, 16 and the maximum execution threads of the processor respectively, and the performance above 16 execution threads will belong to 3D rendering, Audio and video output will be used. Generally, Direct X12 games prefer 8T execution threads, while the following execution threads are the preferences of old games.
In the 1T-4T test, the i9-13900K has better performance, but the 7950X3D is quite close to the 7950X. As for the 8T, the i9-13900K is higher, and the 7950X3D is on par with the 7950X. However, at 16T, the i9-13900K is It ran a lower result, but it also let the 7950X pull out the clock gap with the 7950X3D.
↑ 3DMark CPU, the higher the better.
12+4 AAA e-sports games for processor performance test
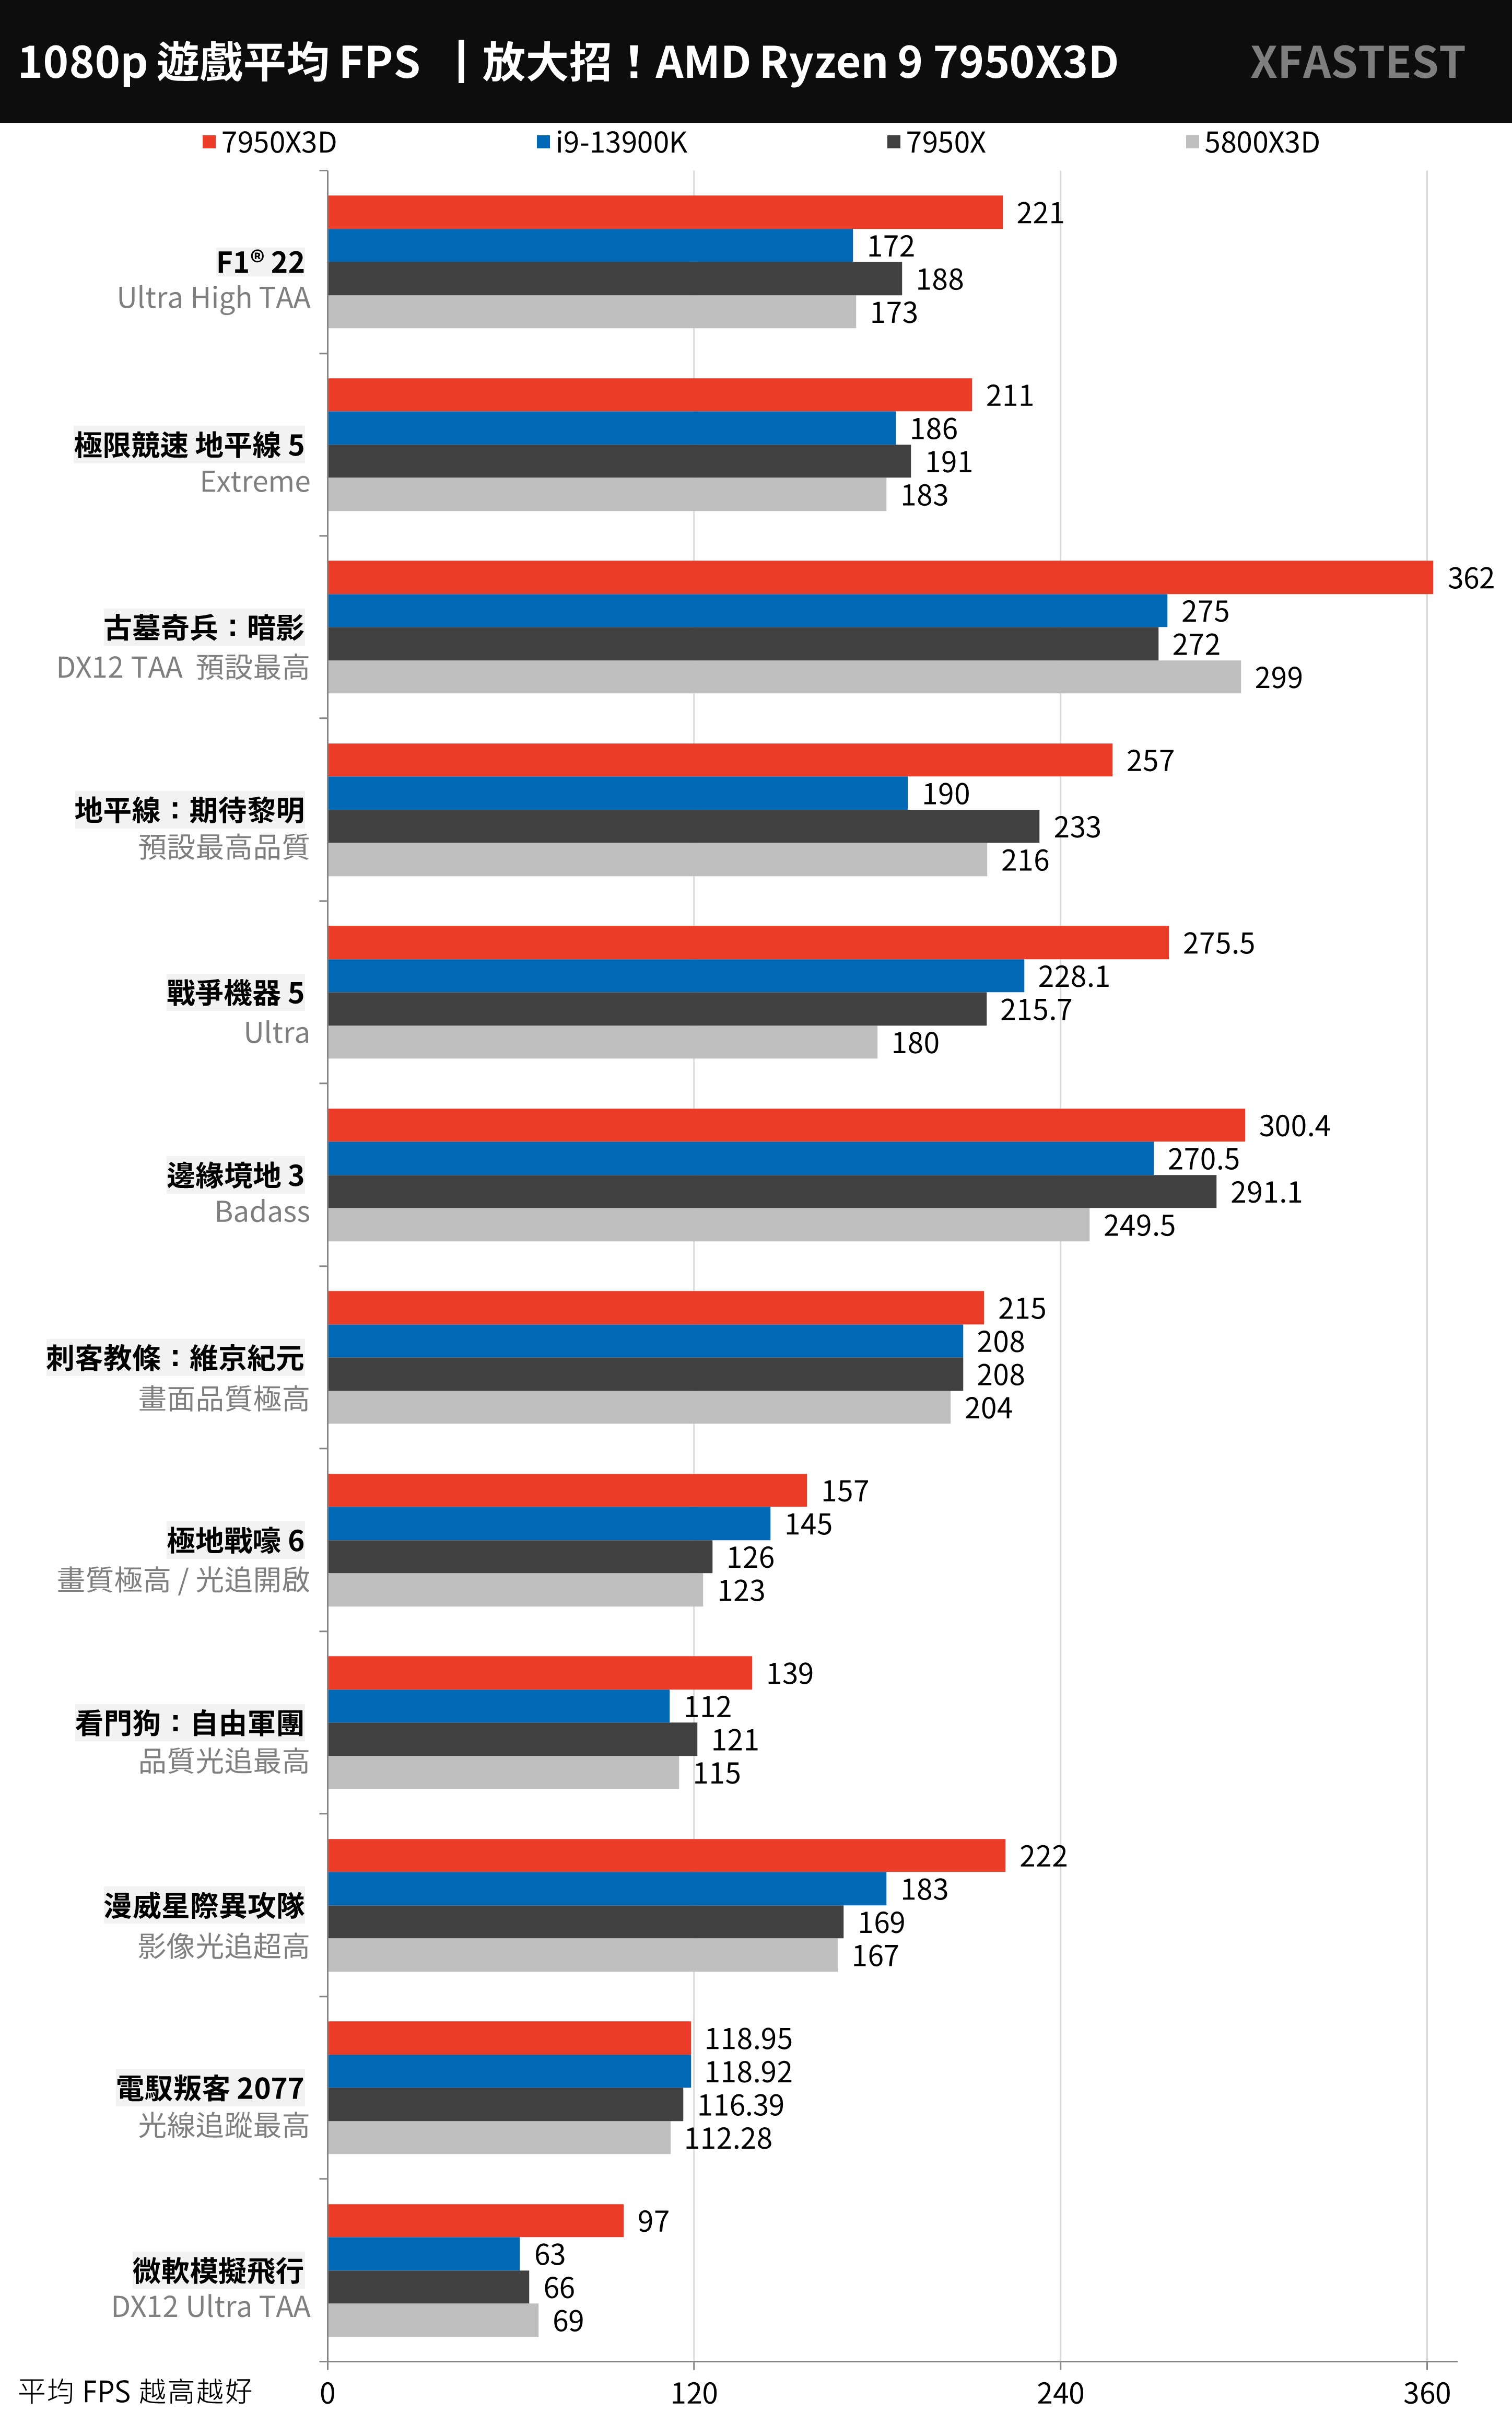
12 AAA game performanceFor the test, the entry-level “F1® 22”, “Forza Horizon 5” racing game, the shooting category “Gears of War 5”, the adventure category “Tomb Raider: Shadow”, “Horizon: Waiting for Dawn”, and heavy performance “Borderlands 3”, “Assassin’s Creed: Viking Age”, and “Polar Trenches 6”, “Marvel Interstellar Attack Team”, “Watch Dogs: Liberty Legion” and “Electric Rebels” that support light pursuit 2077″ and other games.
In addition, the “Microsoft Flight Simulator”, which is heavy on CPU performance, is specially added. The tests are all conducted at 1080p resolution and the game’s highest default settings for the In Game Benchmark test, and the DLSS and FSR acceleration functions are turned off.
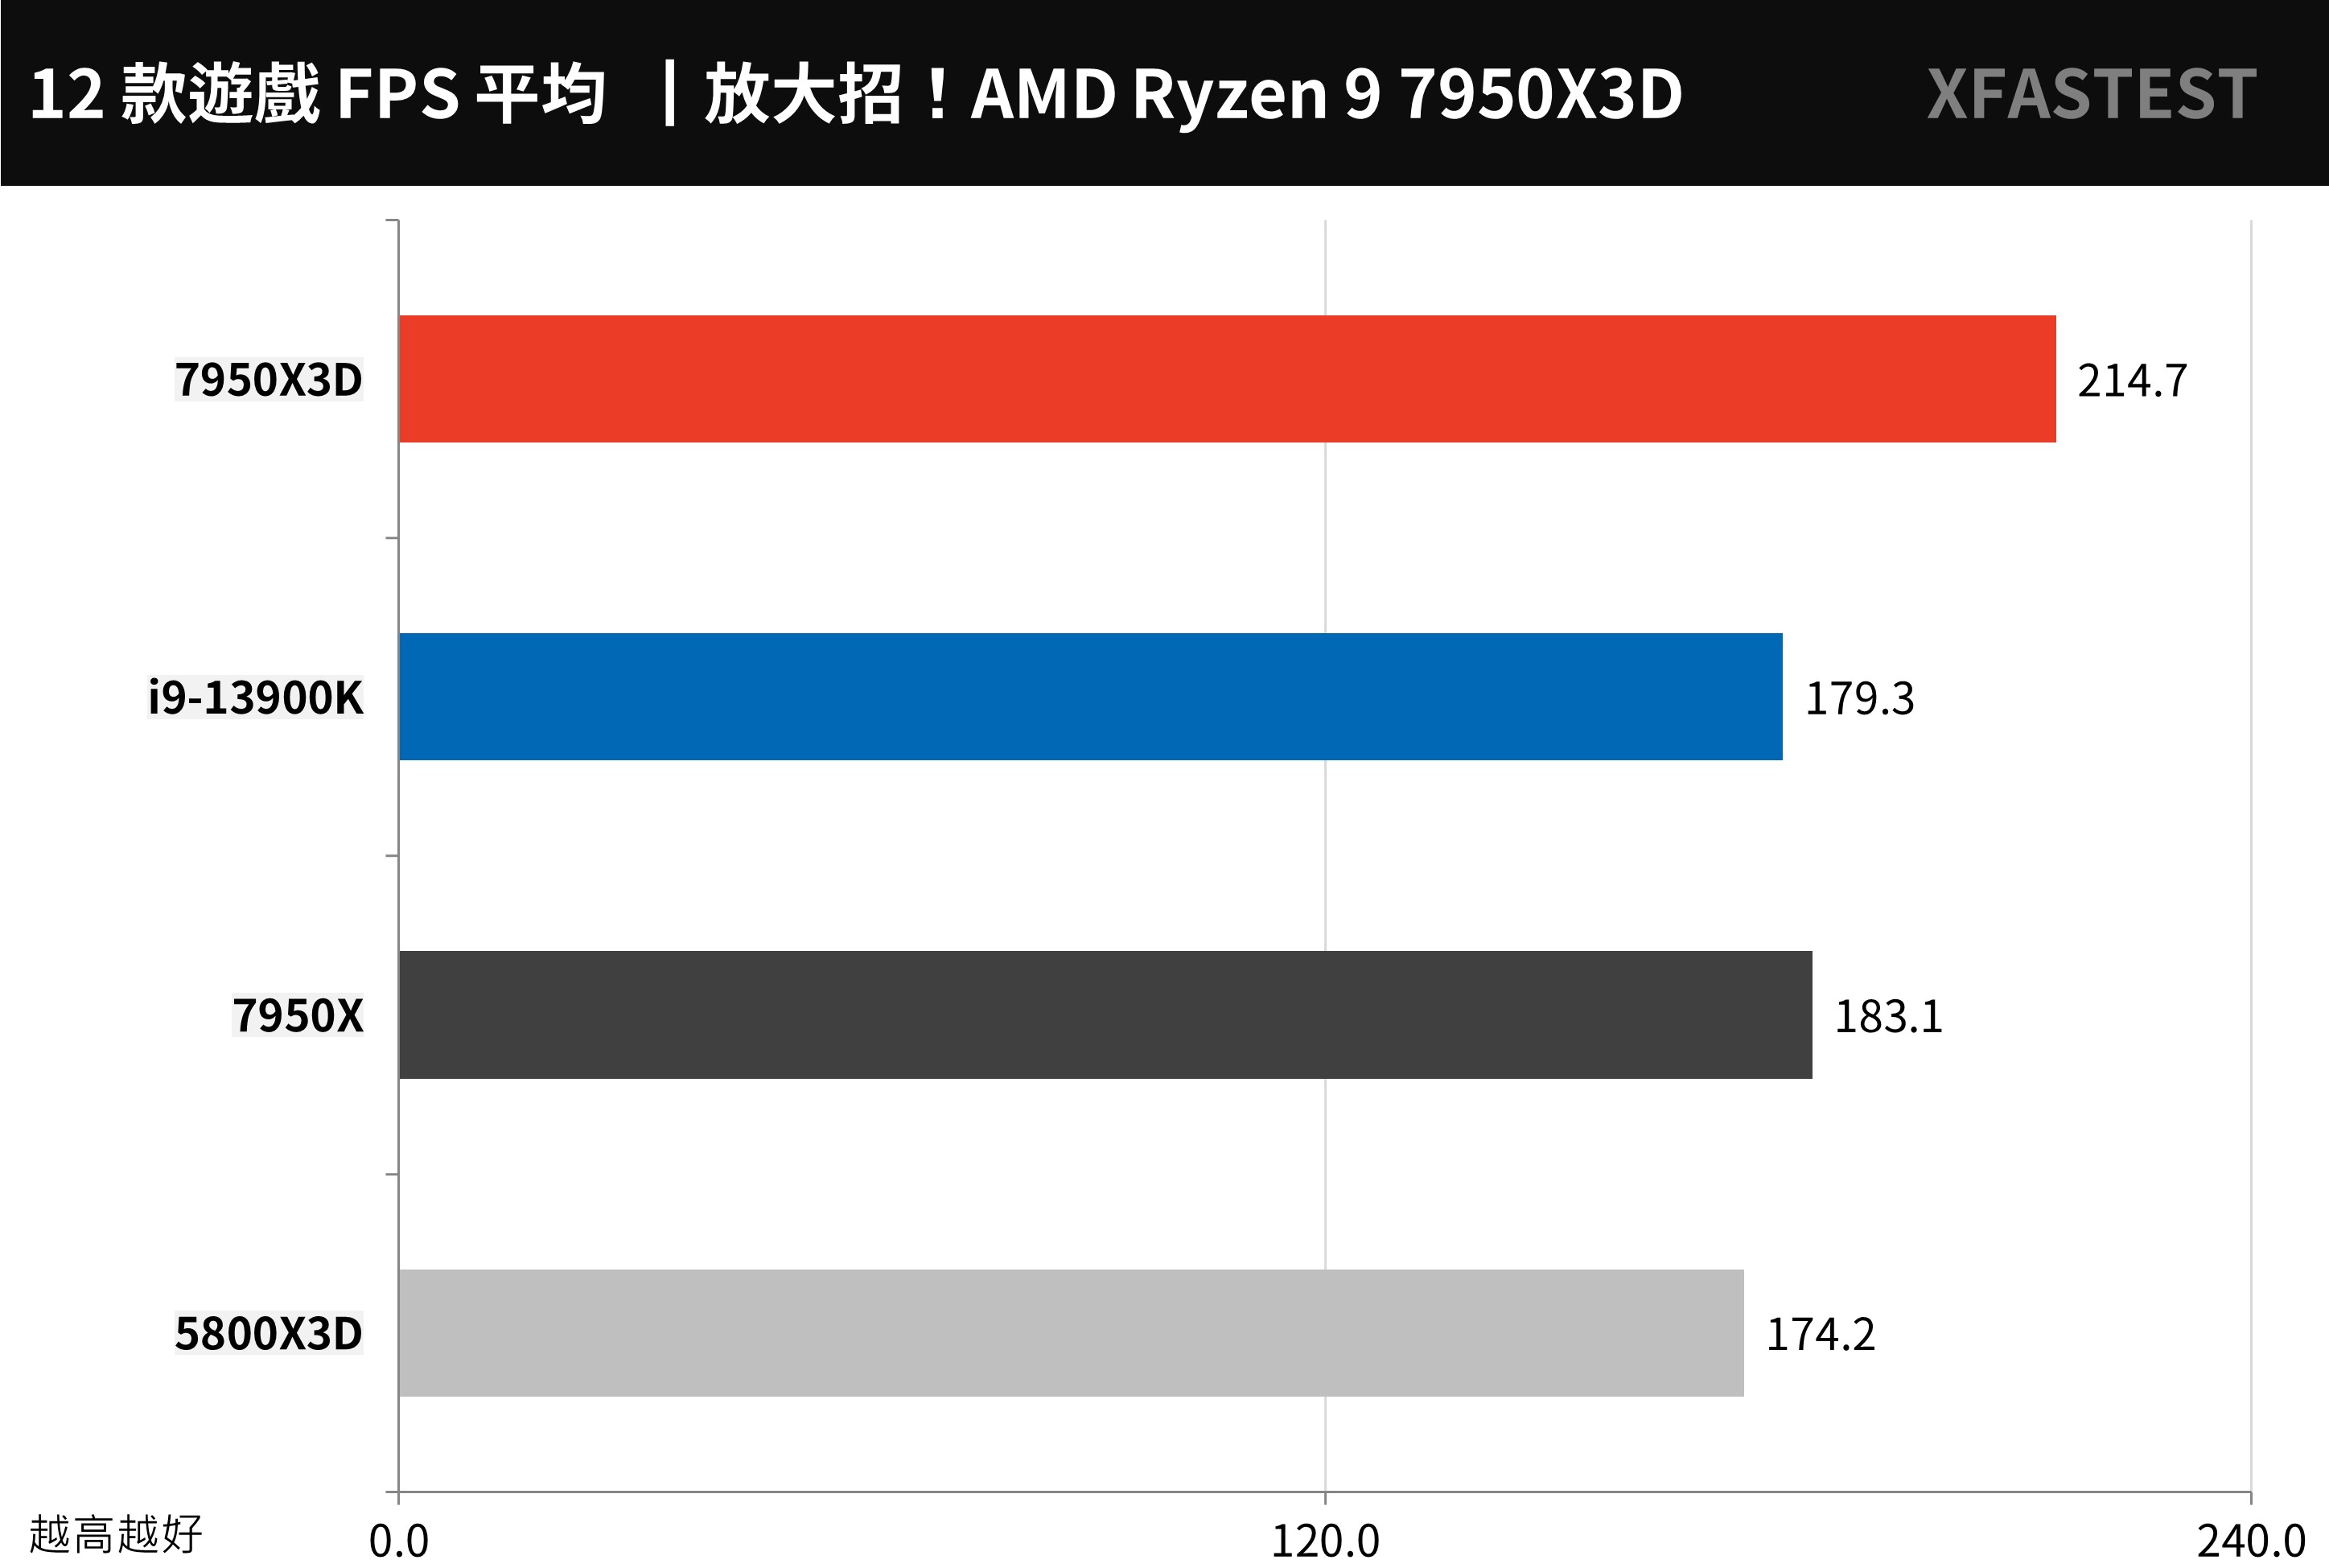
Among the 12 games, 7950X3D achieved an average of 214.7 FPS, i9-13900K averaged 179.3 FPS, and 7950X averaged 183.1 FPS. This result is really surprising. I did not expect that 3D V-Cache can bring such a high game performance improvement in 1080p resolution .
The average FPS performance of 7950X3D is 19.7% higher than that of i9-13900K, and the game performance is 17.2% higher than that of 7950X; the performance improvement brought by 3D V-Cache in many games is more than 20%, such as “Forza Motorsport” Horizon 5 increased by 33%, “Marvel Interstellar Attack Team” increased by 31.4%, and “Microsoft Flight Simulator” increased by 47%.
However, this performance improvement is only limited to 1080p. When the resolution increases, the GPU burden increases. Even if the CPU has faster performance, it cannot improve the FPS of the game.
↑ Average of 12 games, higher is better.
↑ Playtest, the higher the better.
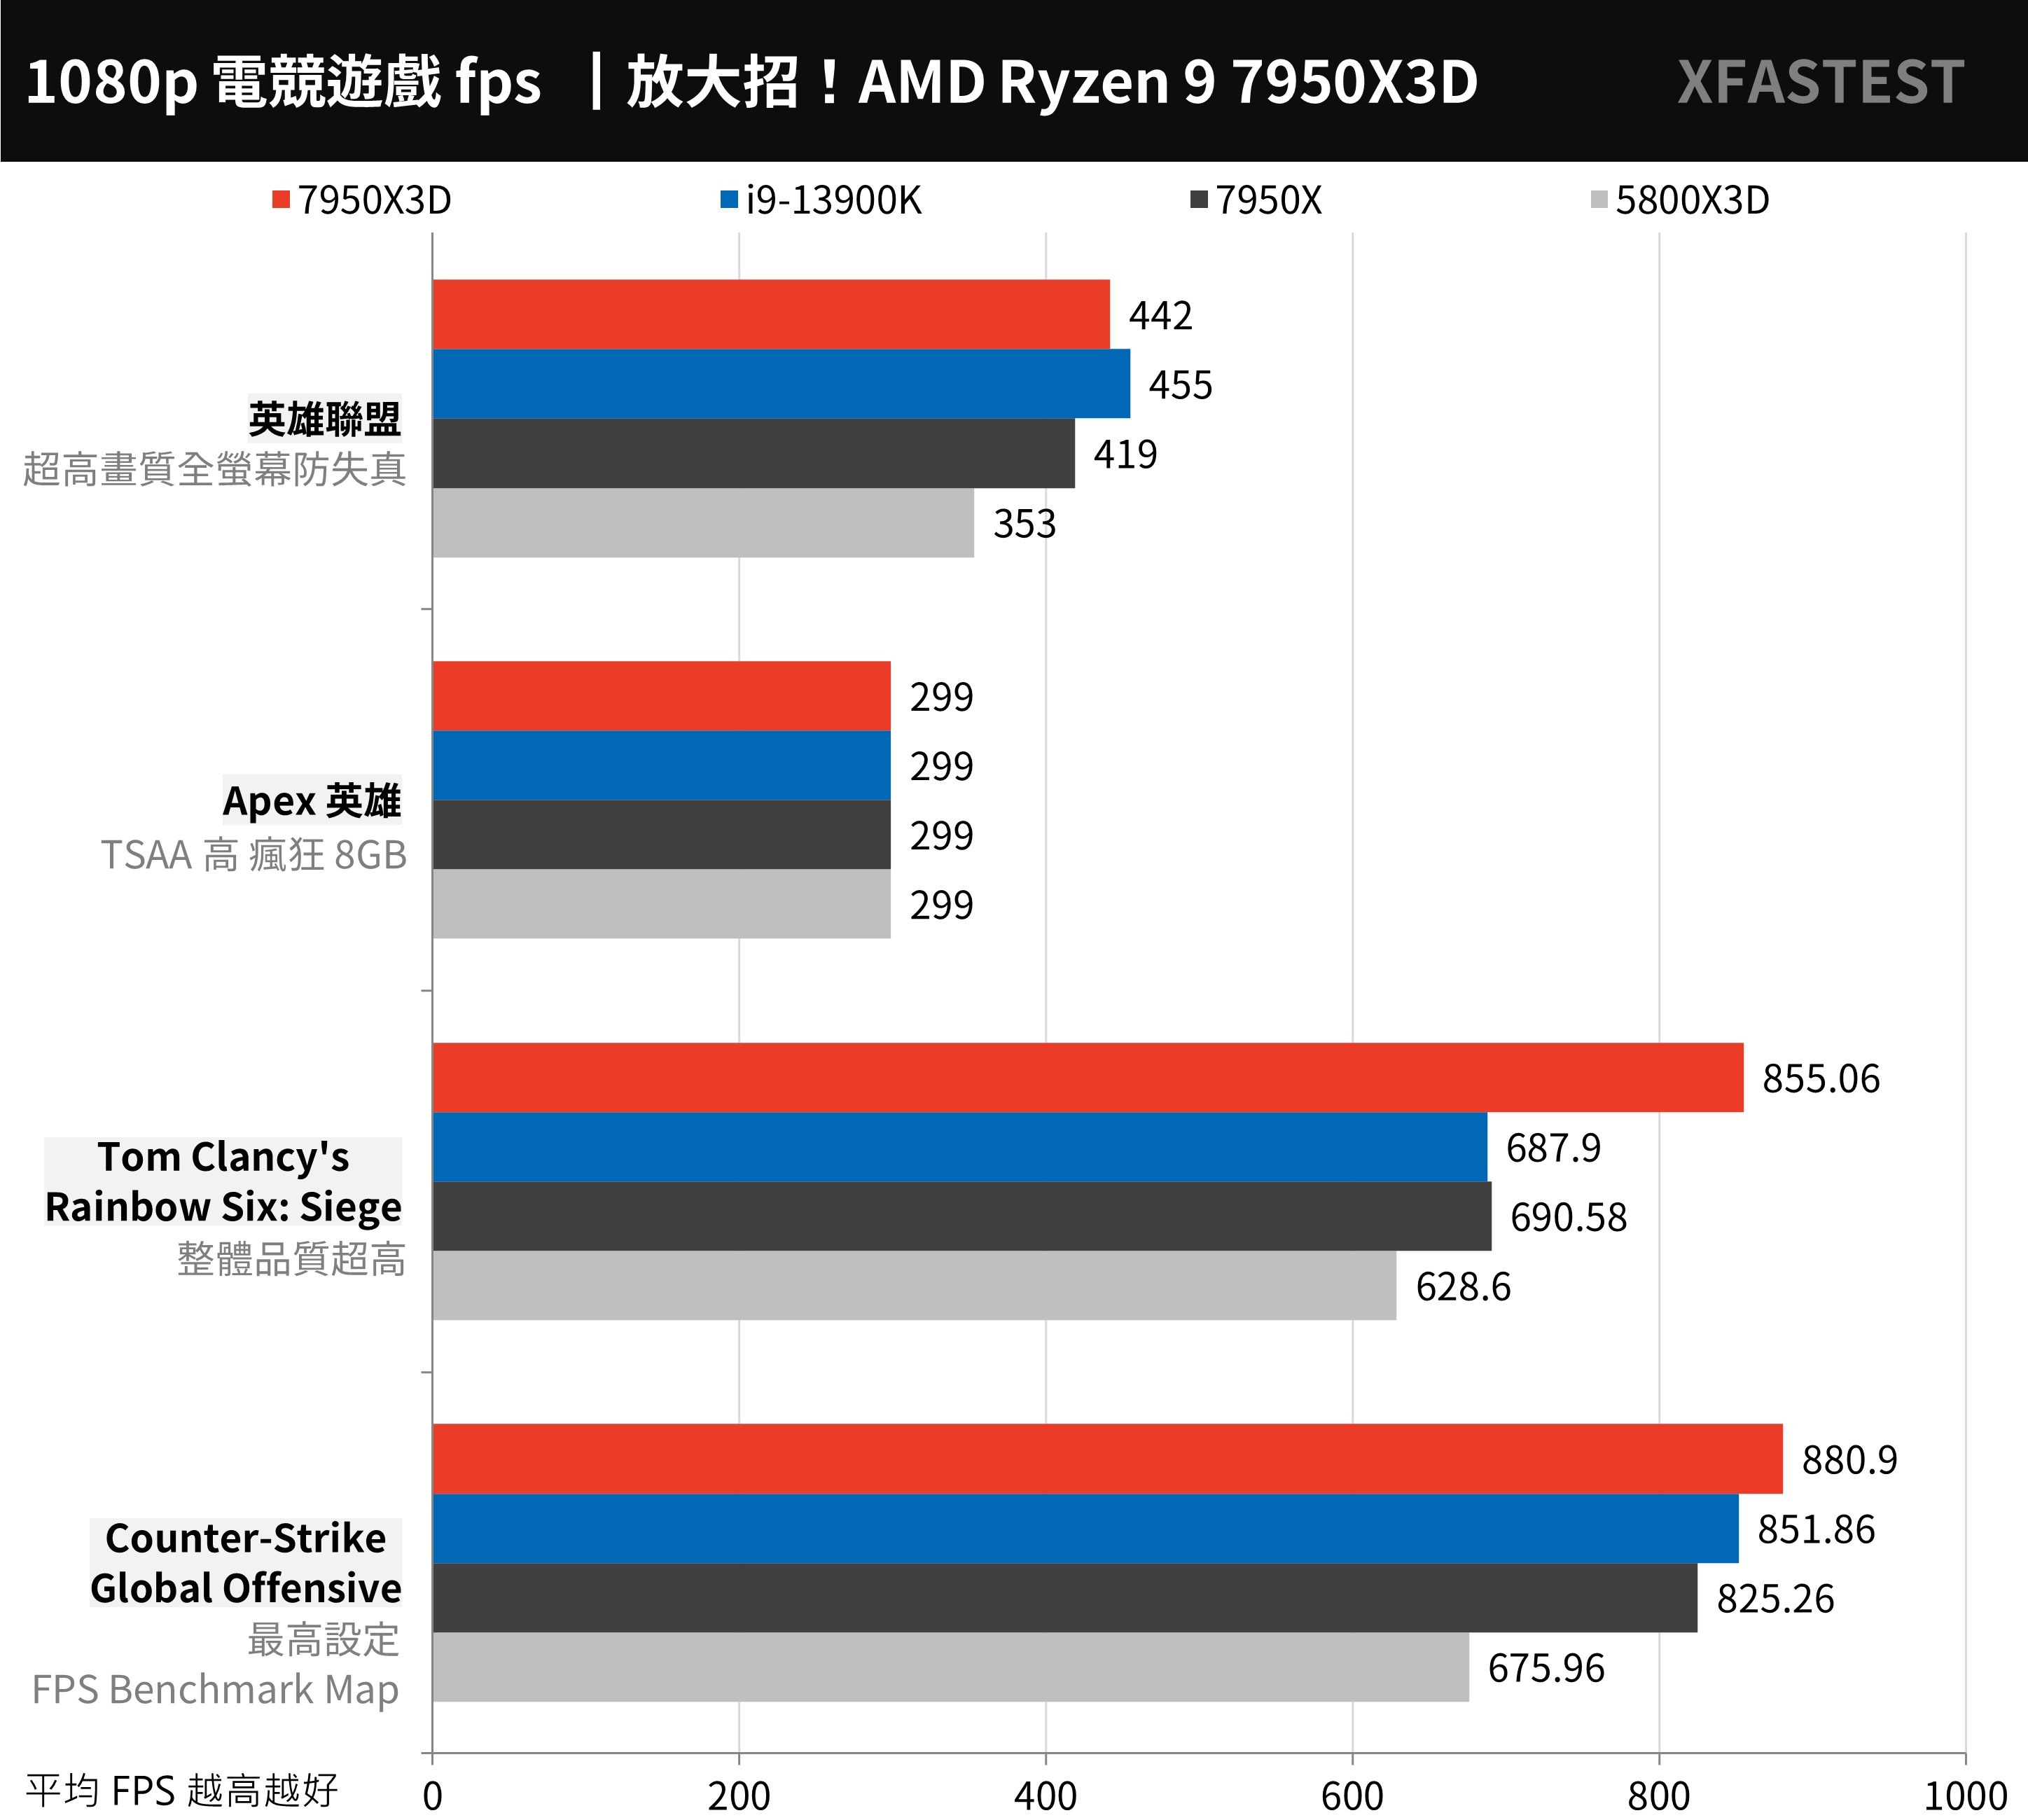
E-sports games focus on the tactical and technical competition between players and teams, so they don’t have high requirements for the image quality of the game. This also allows such games to have a fairly high average FPS performance on high-end CPUs and GPUs, especially in 1080p resolution. Under high speed, the improvement of CPU performance and clock can increase the FPS performance of the game.
The 7950X3D has 880.9 FPS in “CS:GO”, and the average 855.06 FPS in the R6 game has won the i9-13900K and 7950X. As for “League of Legends”, the i9-13900K has a higher clock speed and better performance.
↑ E-sports games, the higher the better.
AMD Ryzen 9 7950X3D processor temperature and power consumption test
AMD specifically mentions this generation of 7000X3D processors, because the addition of 3D-Vcache adjusts the clock pulse and reduces it to 120W TDP, so the V/F curve of the processor is optimized, and the temperature and power consumption of the 7950X3D are better. The test uniformly uses 360mm AIO, fan and water pump at full speed setting, and compares AIDA64 CPU, FPU and Cinebench R23 burn-in respectively.
In the AIDA64 CPU stress test, the 7950X3D full-core 5.23GHz pressure is at 72.1°C, which is a bit higher than the temperature of the 7950X, while the FPU test is 4.18GHz, 72.3°C, which is lower than the 7950X which is close to the temperature wall Many, as for the Cinebench R23 test at 4.83GHz, 85.5°C, the temperature is also lower than that of the 7950X.
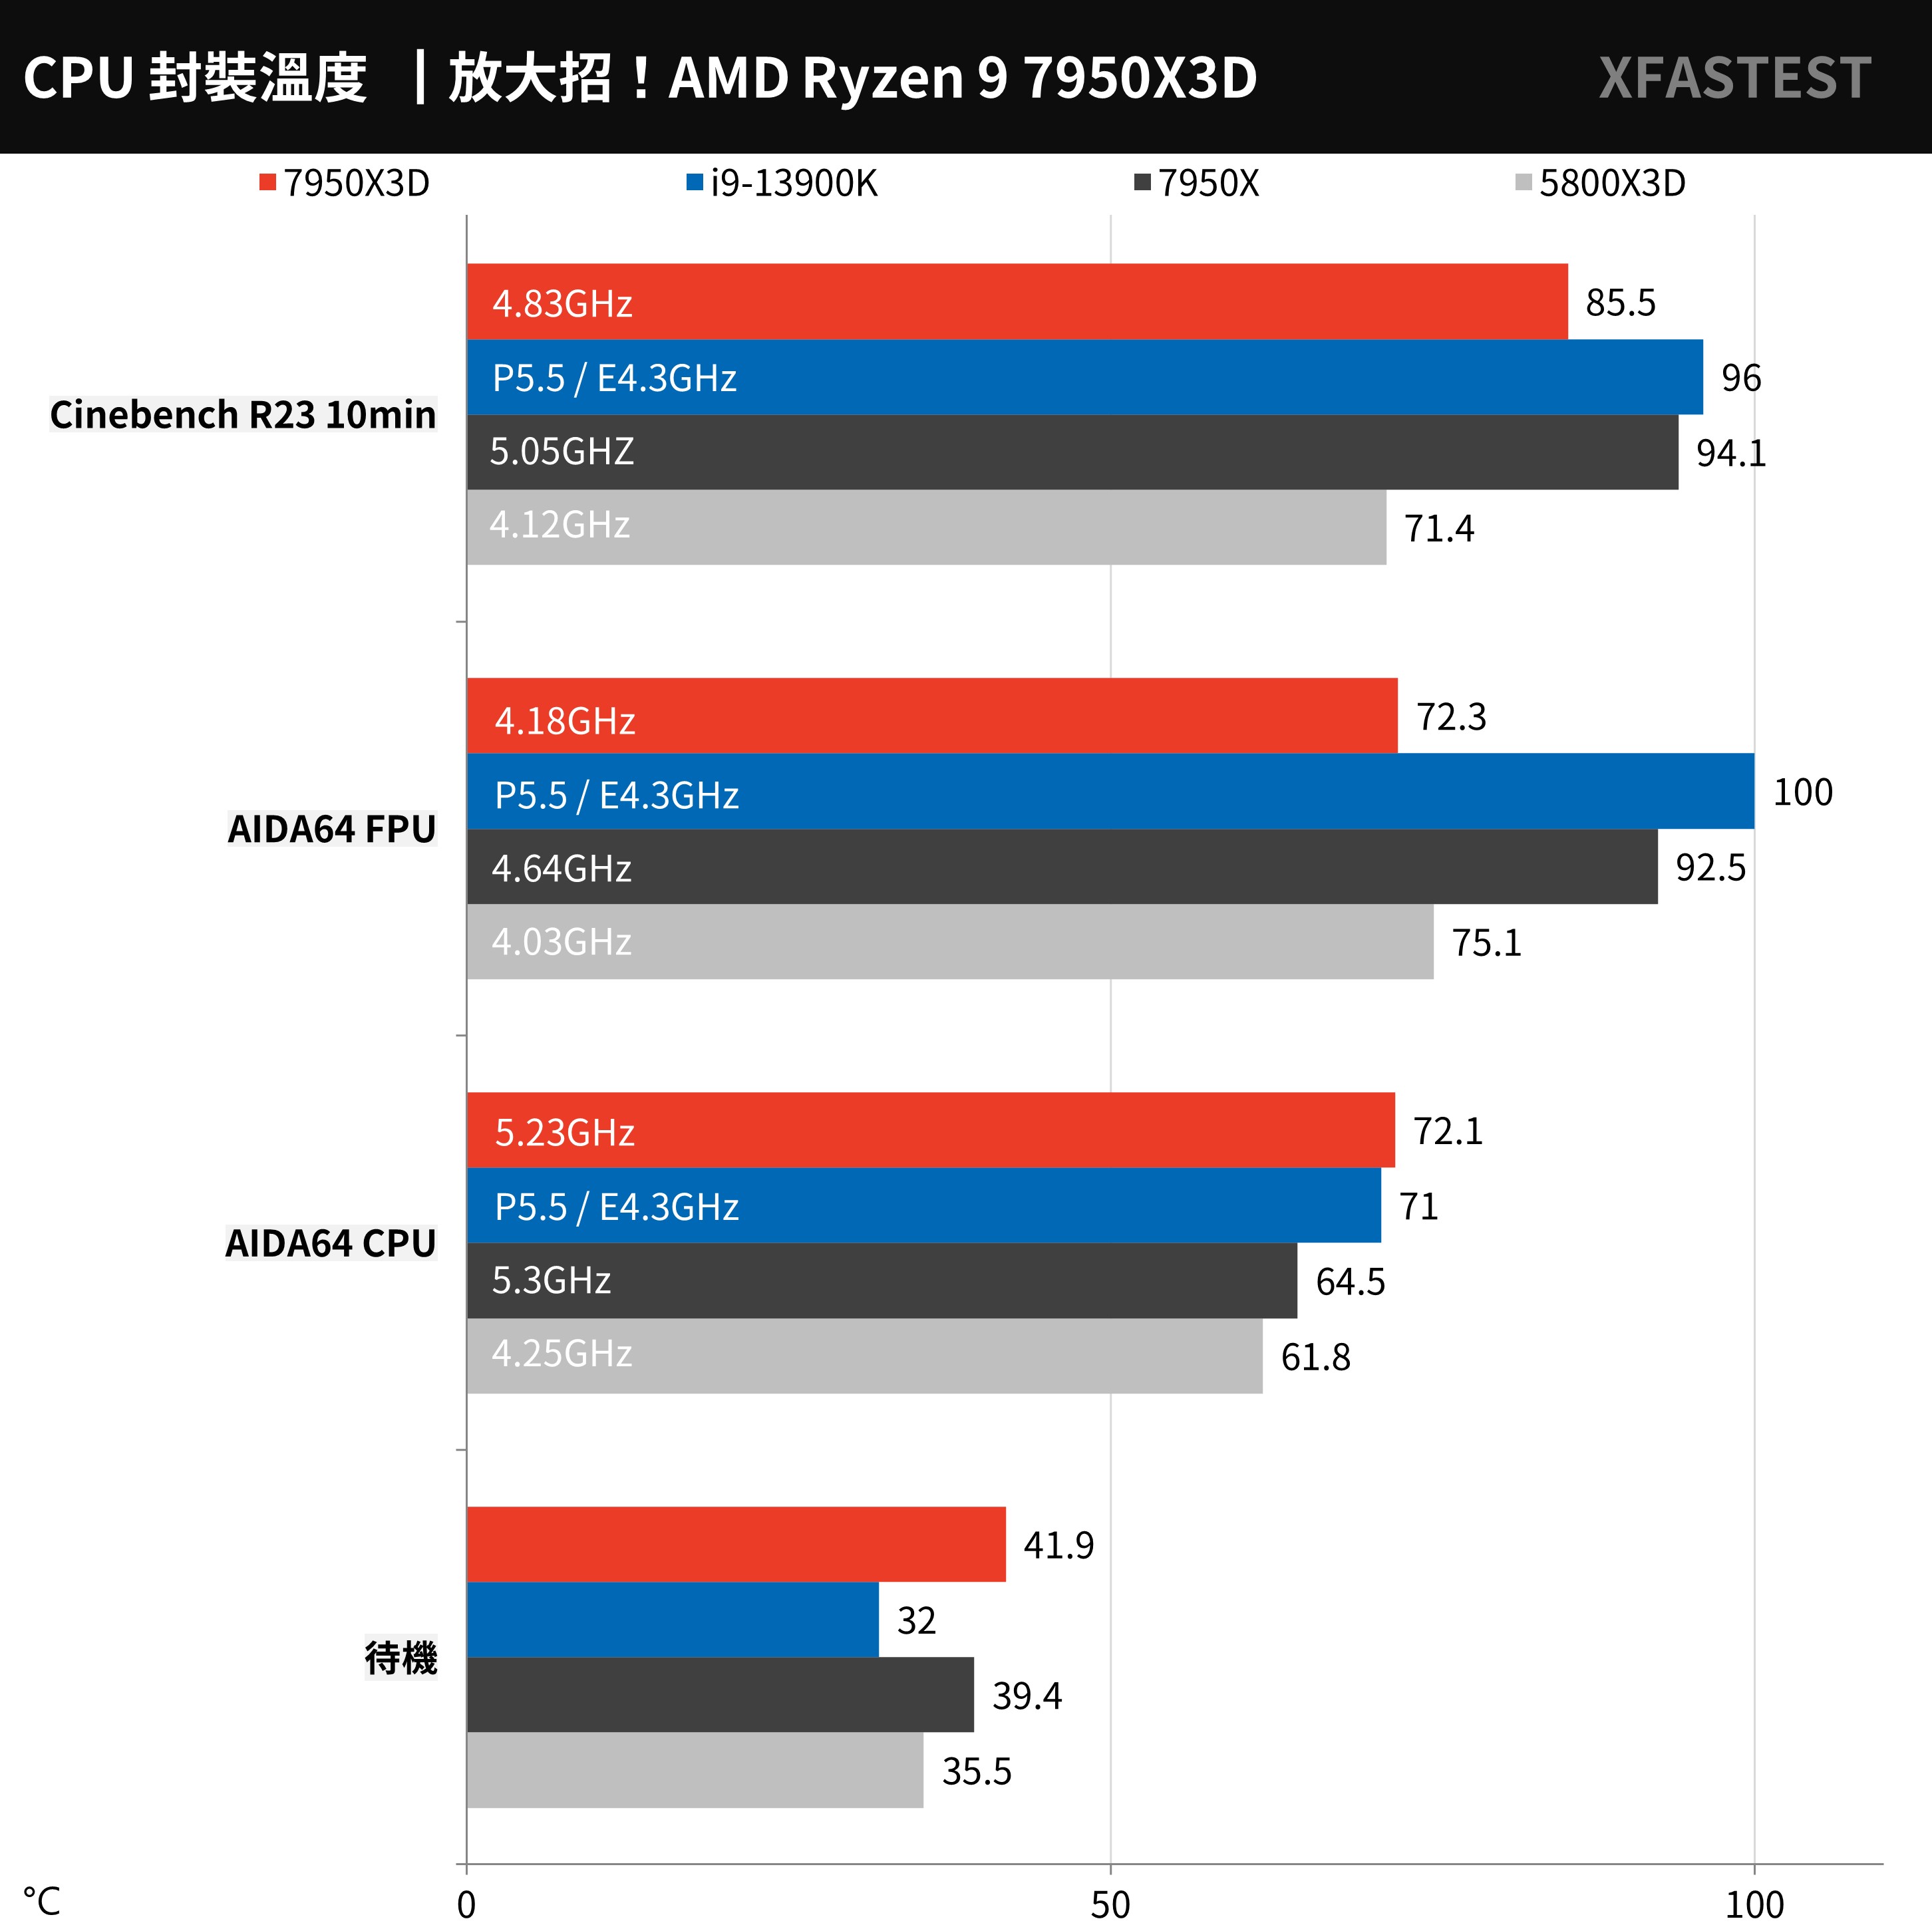
↑ Temperature test.
The clock frequency of 7950X3D stress test is lower than that of 7950X, but it has lower temperature and power consumption performance. AIDA64 CPU test is only 97.4W, FPU 130.4W, Cinebench R23 142.3W power consumption performance; calculated by Cinebench R23 , 7950X3D saves 30% power consumption compared with 7950X, and the performance per watt is 47% higher.
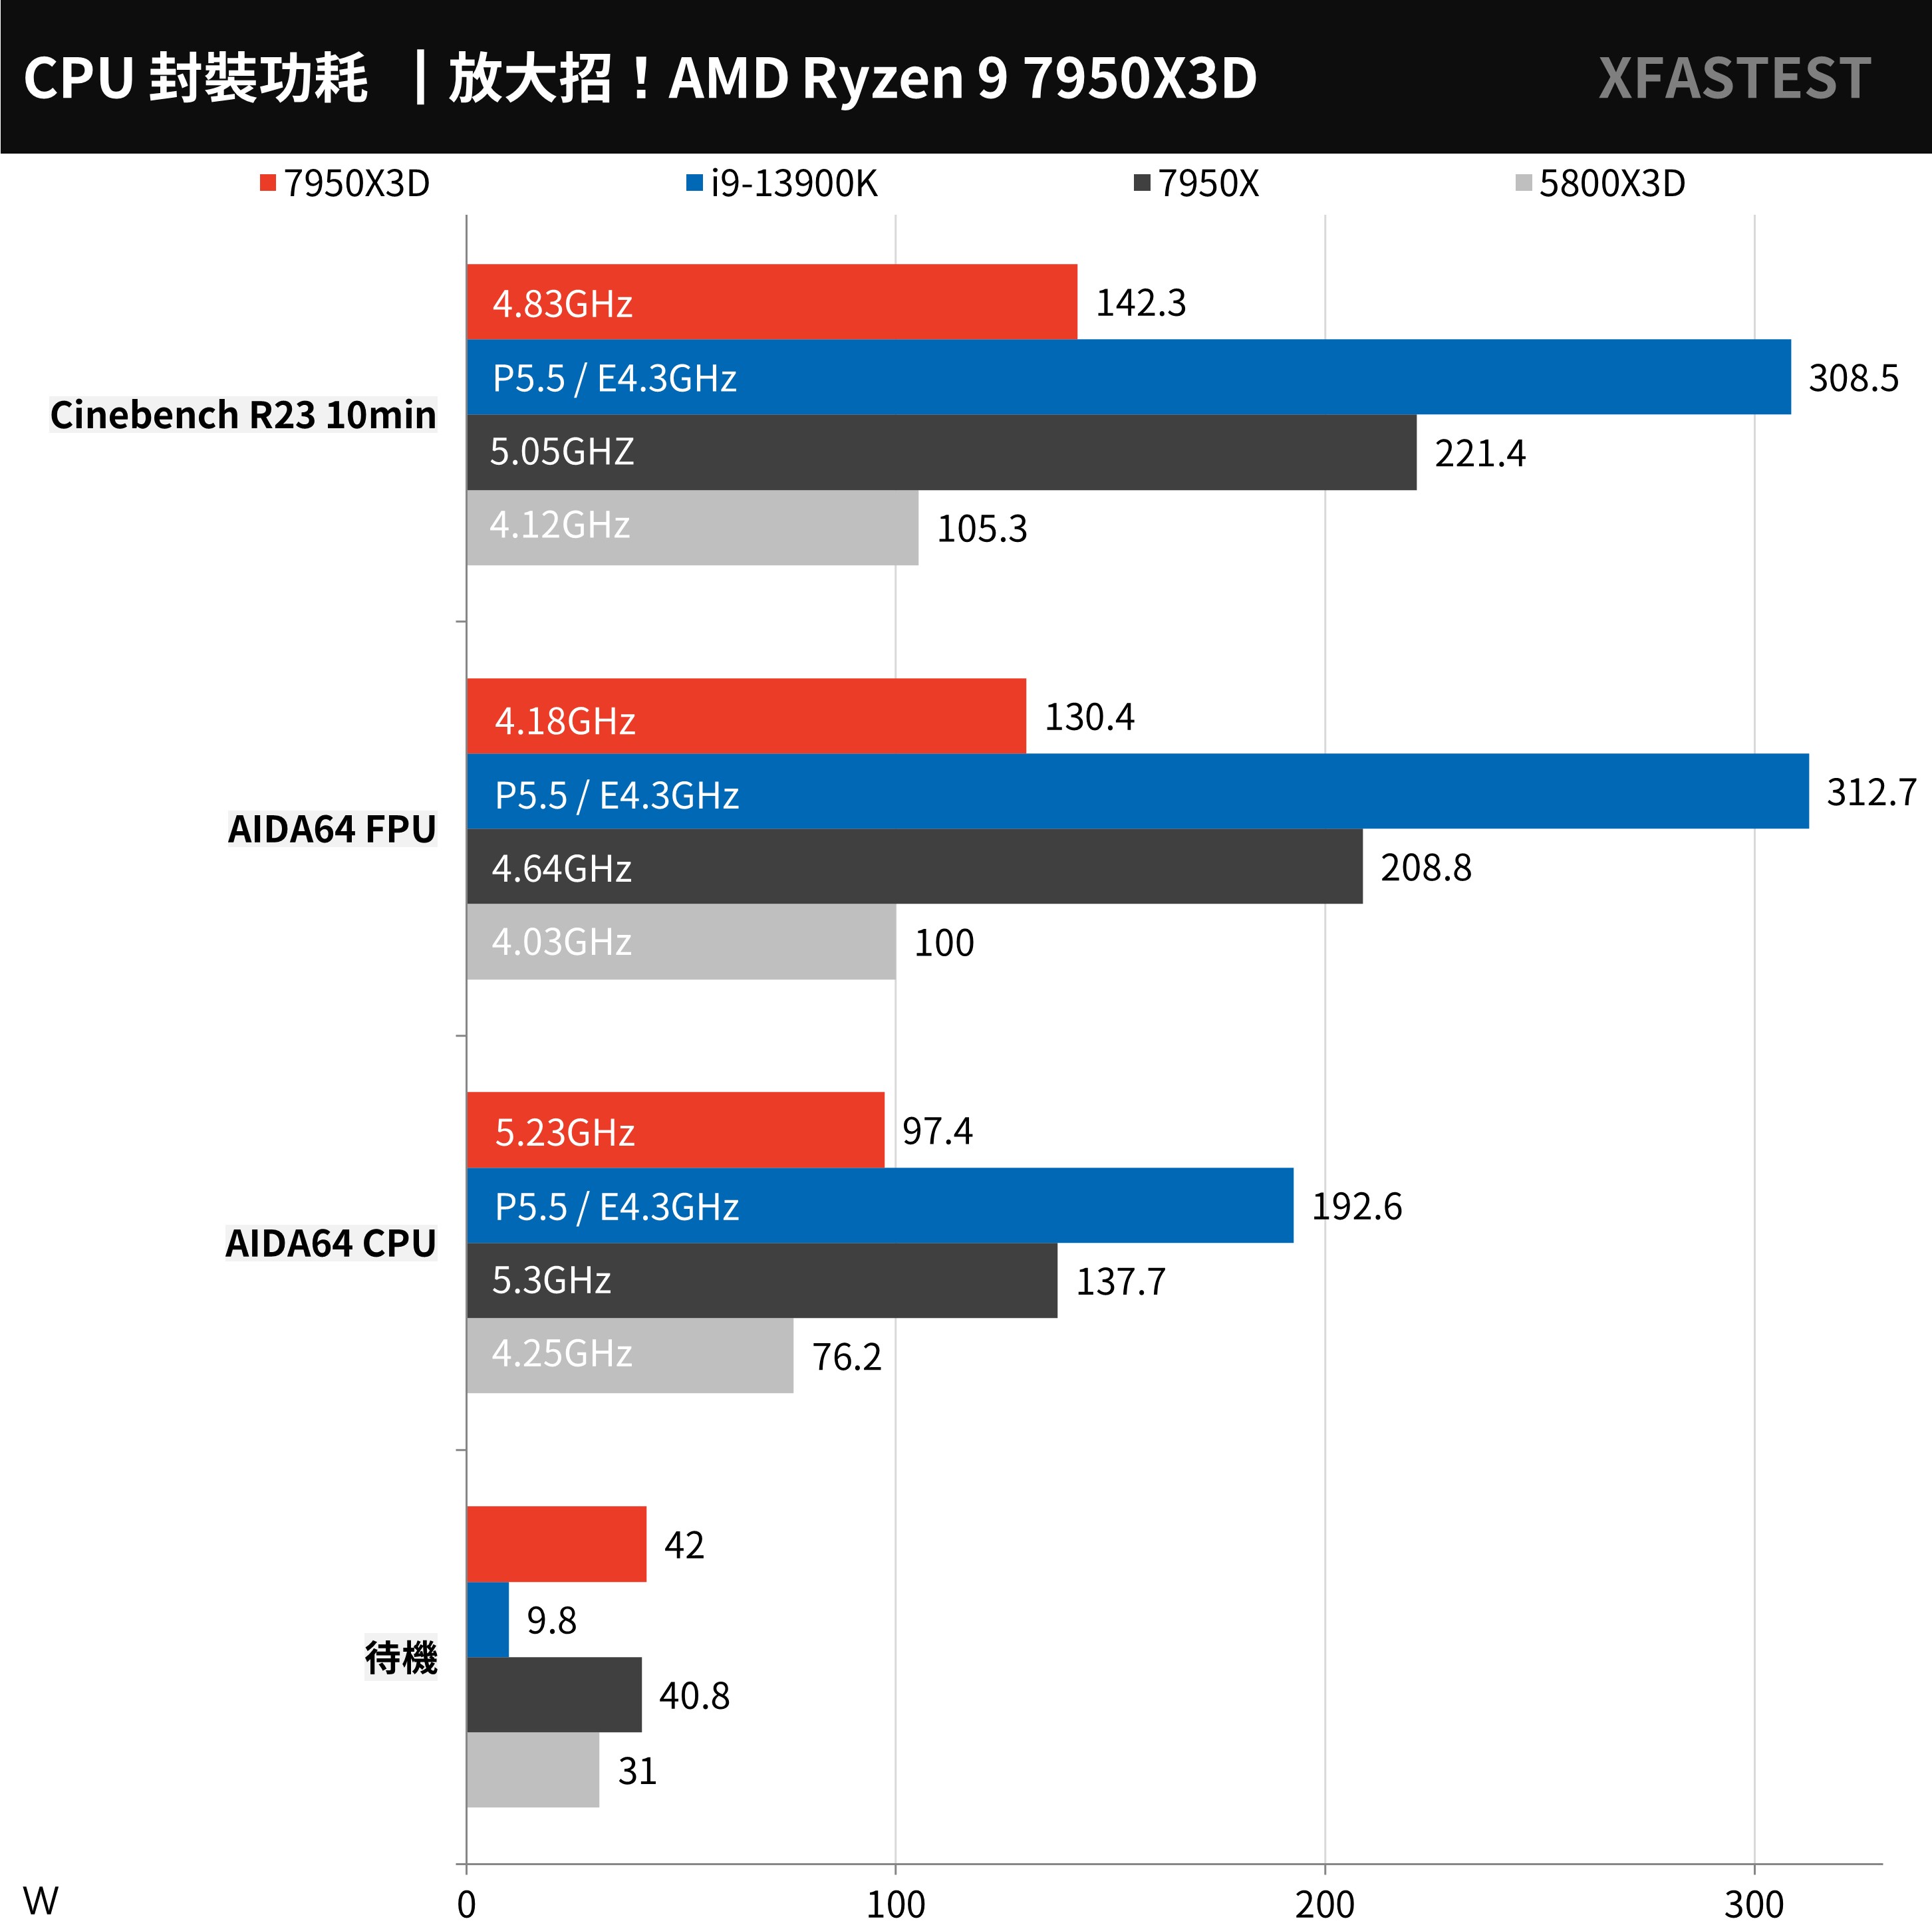
↑ Power consumption test.
Summarize
AMD Ryzen 7950X3D is undoubtedly the strongest 1080p game processor. The average game performance is about 19.7% better than i9-13900K, and 17.2% higher than 7950X. In addition to the game performance improvement, the 47% improvement in performance per watt is also quite impressive. It’s just that the multi-core computing performance and computer replacement performance have decreased by about -5%, which is also expected.
AMD also mentioned that this generation of Ryzen 7000X3D processors has open PBO and Curve Optimizer overclocking functions. Perhaps this will be another reason to choose the 7000X3D processor.
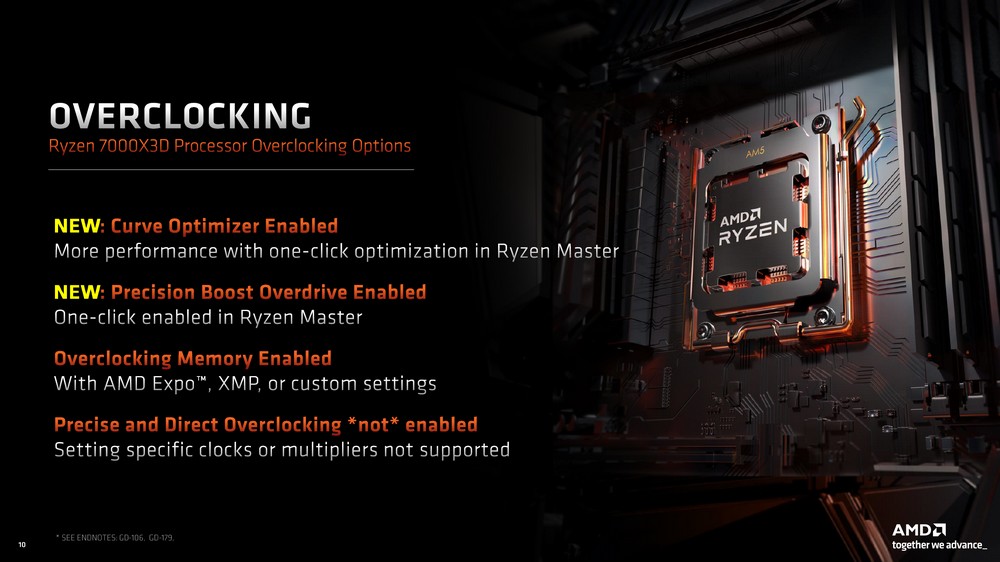
↑ Ryzen 7000X3D open PBO and Curve Optimizer overclocking.
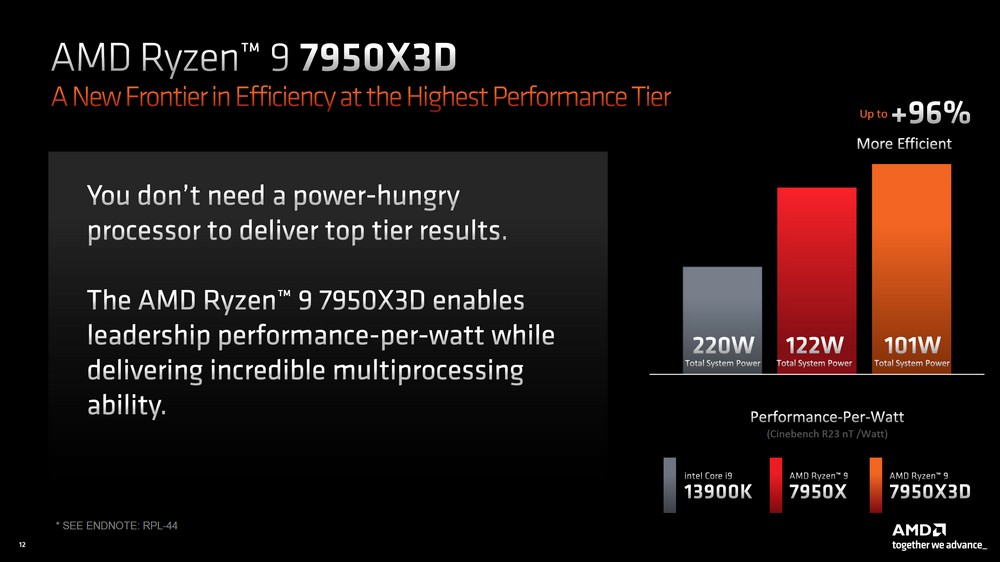
↑ Performance per watt is definitely a big plus for the Ryzen 7000X3D.
From the point of view of the strongest game processor, the 3D V-Cache of Ryzen 7950X3D and 7900X3D can make the game have a very powerful game performance at 1080p resolution, but when the resolution is increased to 2K or 4K, due to the GPU load With the improvement, even if the CPU can handle more instructions, it can’t help the GPU to output higher game performance; but from the perspective of performance per watt, the tested 7950X3D does have better heat dissipation performance and can save a lot of power. consumption.
At present, Ryzen 7950X3D is priced at 22,950 yuan in Taiwan, and 7900X3D is priced at 19,950 yuan. Compared with US dollar pricing, this exchange rate is not too bad. However, when the market prices of the first 7950X and 7900X have been adjusted, they appear to be launched later. The 7000X3D processor is more expensive, which is unavoidable.
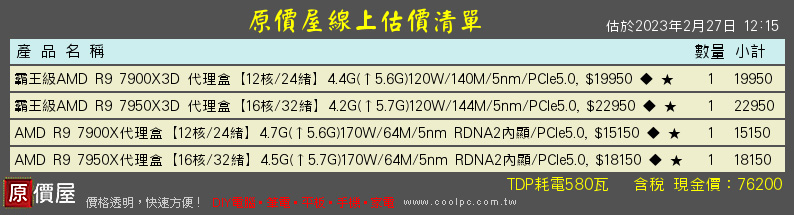
↑ Ryzen 7950X3D, 7900X3D, 7950X, 7900X original price comparison.
If you have enough budget to go directly to Ryzen 7950X3D, 7900X3D, there is no problem, but if you really like 1080p gamers, you can also look forward to the 7800X3D launched on 4/6, which may have better game performance; Watt performance is better, the first choice is definitely the Ryzen 7000X3D processor.
Further reading: