
by Bitpanda *
The last few months have been tough for the flagship cryptocurrency, but Bitcoin managed to break the negative trend by marking its first weekly green candle from the end of March. The exit from the longest negative period ever potentially indicates that BTC may finally change direction and bottom out to recover from these levels.
The past seven days have seen little action in the cryptocurrency market, with Bitcoin moving mostly in a range and the bulls managing to defend the significant support level of € 27,450. Bitcoin struggled to break out of the $ 30,250 resistance level as sellers stepped in and pushed the price back into the broad band it has held over the past month.
The long “wicks” of the candles on the charts indicate that there are still some big sellers who remain at a higher level and the momentum indicators are also showing mixed signals. The price is below important moving averages which need to be reversed to reverse the bearish trend. The feeling of extreme fear is still high, with index readings at an all-time low of 11 out of 100. Although the price is forming a bottom, it may take longer for the bulls to return to full action.
The intraday charts are volatile but show the early stages of the recovery
Bitcoin’s move into positive territory has brought some necessary optimism to the general market. Major altcoins are also showing early stages of recovery, but intraday charts remain volatile. Ethereum it is trading inside a descending wedge pattern and under a descending trend line, which serves as the first resistance level. The falling wedge pattern is a continuation pattern that forms when the price bounces between two converging and downward sloping trend lines. It is considered a bullish chart formation, but can indicate both reversal and continuation patterns, depending on where it appears in the trend.
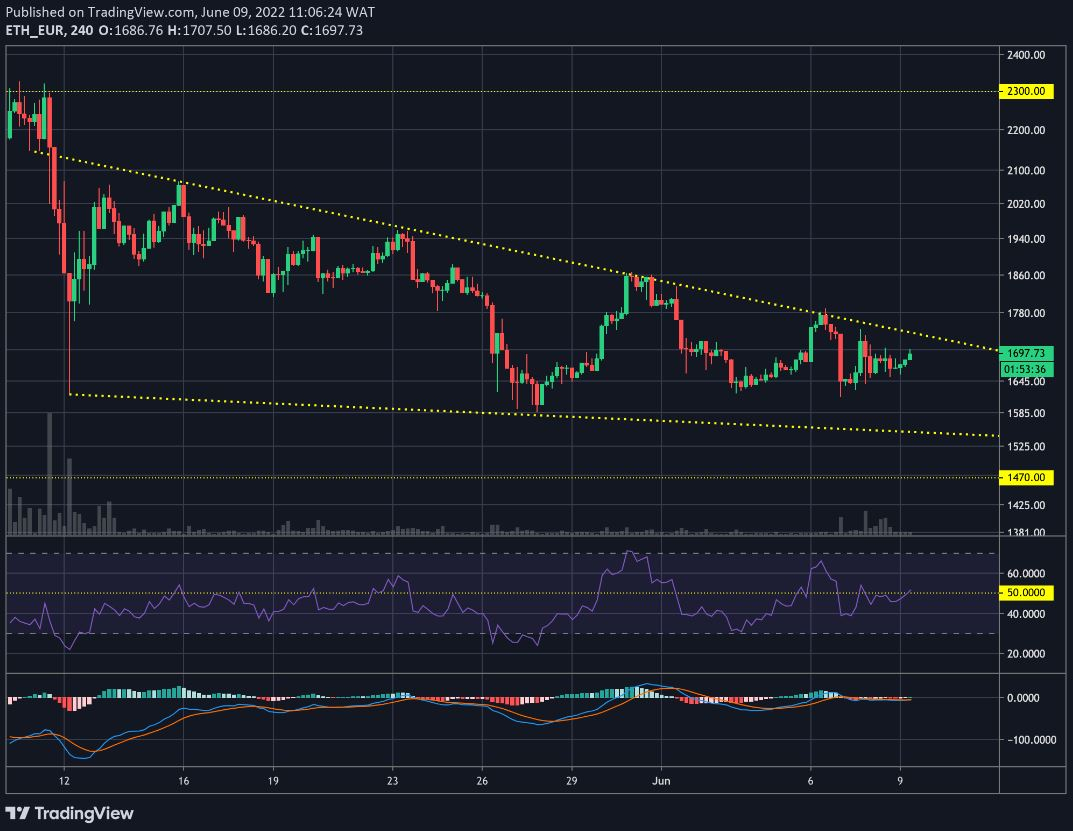
Success for the merge of the Ropsten testnet into Beacon Chain
Ethereum’s Ropsten testnet has successfully merged its Proof of Work execution level with Beacon Chain Proof-of-Stake, in a process identical to what Ethereum’s core network will undergo over the course of the year. The Ropsten testnet was created in 2016 and is considered one of the best replicas of the Ethereum main net. Its similarity to the ETH blockchain allows developers to conduct realistic tests before implementing changes to the Ethereum network.
Here are the main movements of the other altcoins
Cardano recorded asoaring by about 20% since the beginning of June, scoring one of the best performances among the major altcoins. The price is moving above the trend line support level, with the RSI moving into bullish territory and indicating a possible shift in favor of a bullish recovery.
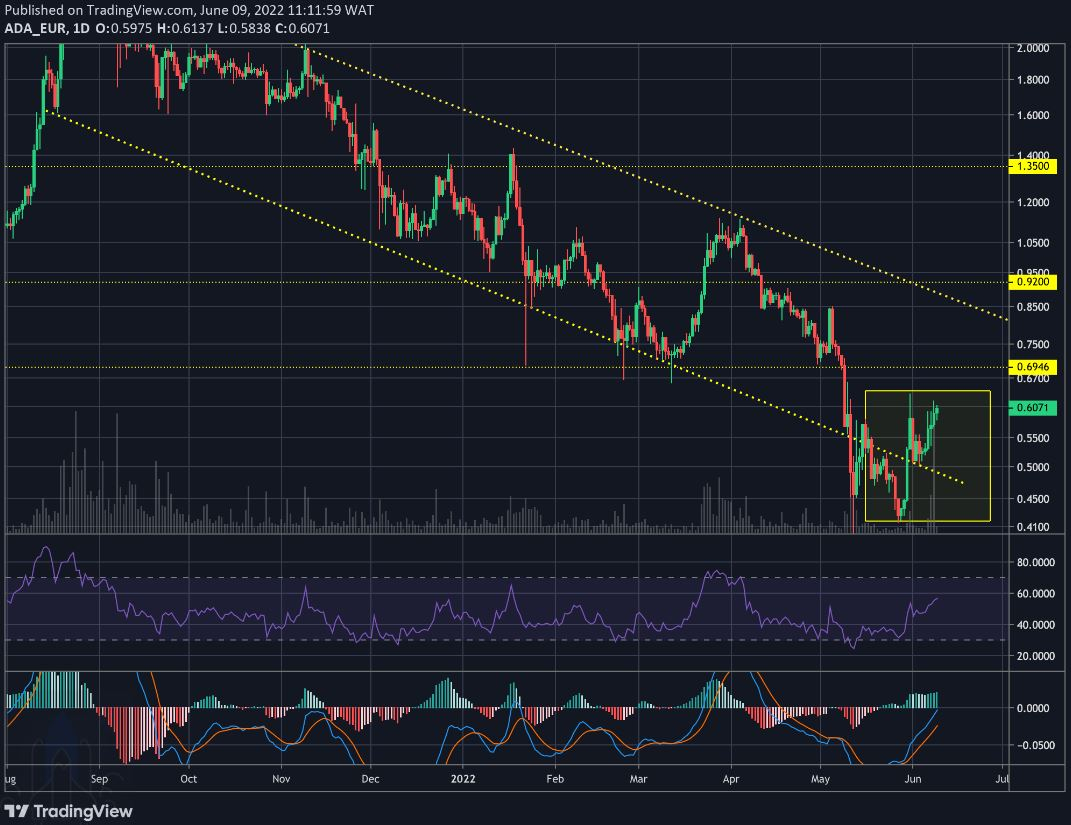
The price hike is probably linked to the imminent Vasil Hard Fork, scheduled for June 29th. The goal is to improve network performance and make it easier for developers to use the Cardano blockchain to create applications; the update is also expected to substantially improve the Plutus smart contract platform.
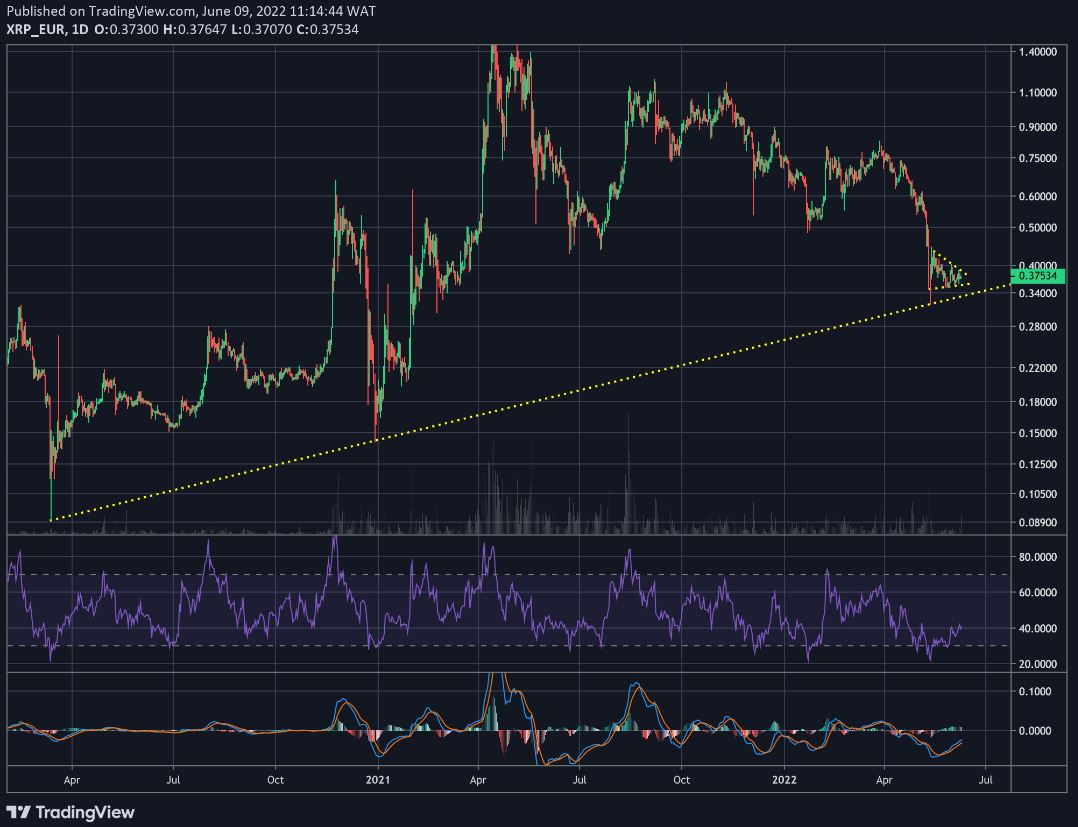
Buyers of Ripple they are holding their positions above the long-term support trend line on the upper time frame. The support has already been tested three times in the past. On the lower time frame, XRP is forming a wedge pattern, with a support around € 0.36 and a resistance at the € 0.38 level.
Solana it plunged below the EUR 36 support level on the daily chart, but the bulls managed to push the price higher, printing a long tail on the candle. The bulls are holding the support level for now and the RSI has formed a positive divergence, indicating that the bearish momentum may subside. However, the SOL is still below the descending trend line, which acts as an important resistance level for now.
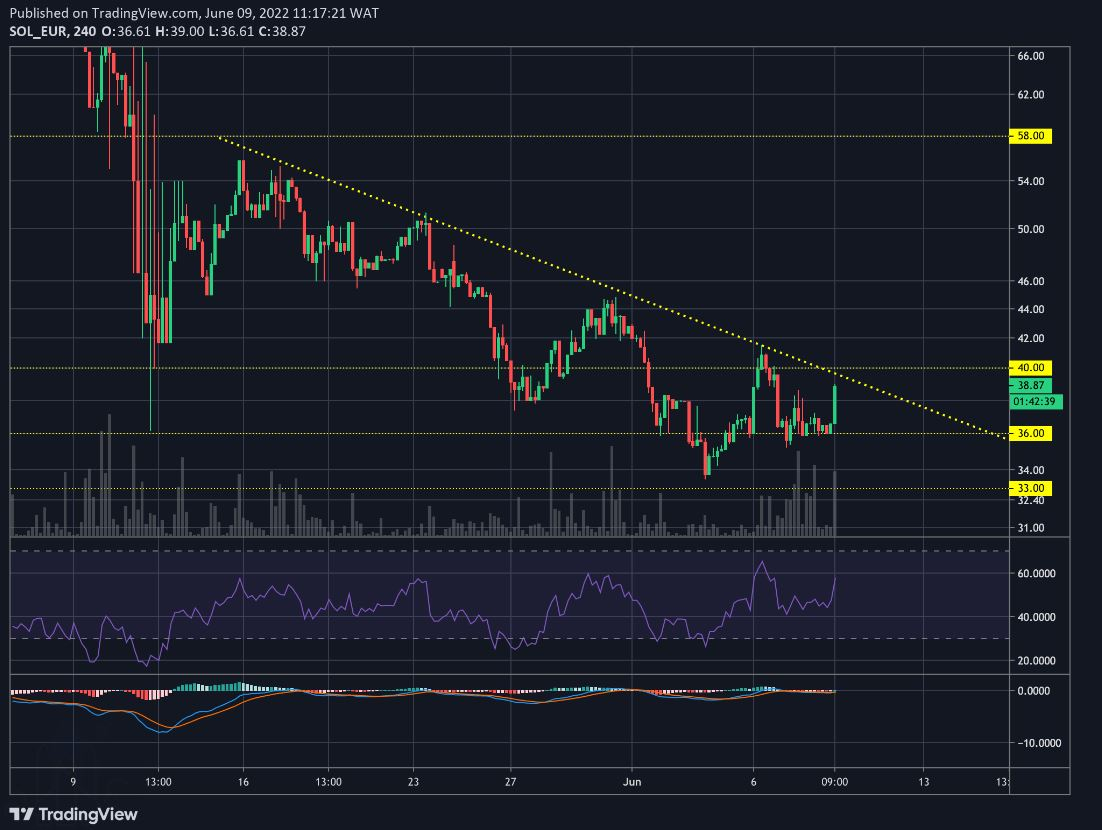
Solana Ventures and the Solana Foundation have launched a € 100 million investment and grant fund to support cryptocurrency projects and other Solana-based initiatives in South Korea.
Il polka dots formed a symmetrical triangle, which usually acts as a continuation pattern. The price is currently bouncing off the lower support level as buyers are trying to push the price up to the resistance line of the triangle.
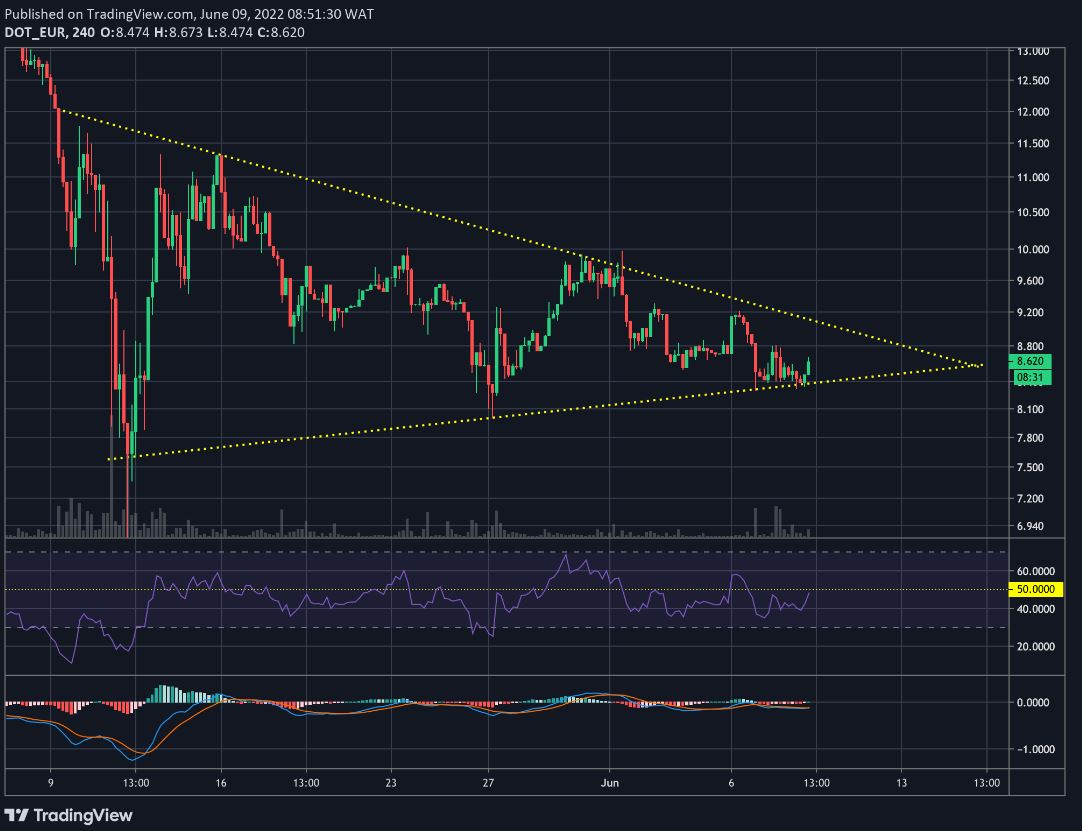
A breakout and close above the triangle will be the first indication of a potential trend change. Alternatively, if the price falls and breaks below the triangle, it will suggest that the sellers are in control.
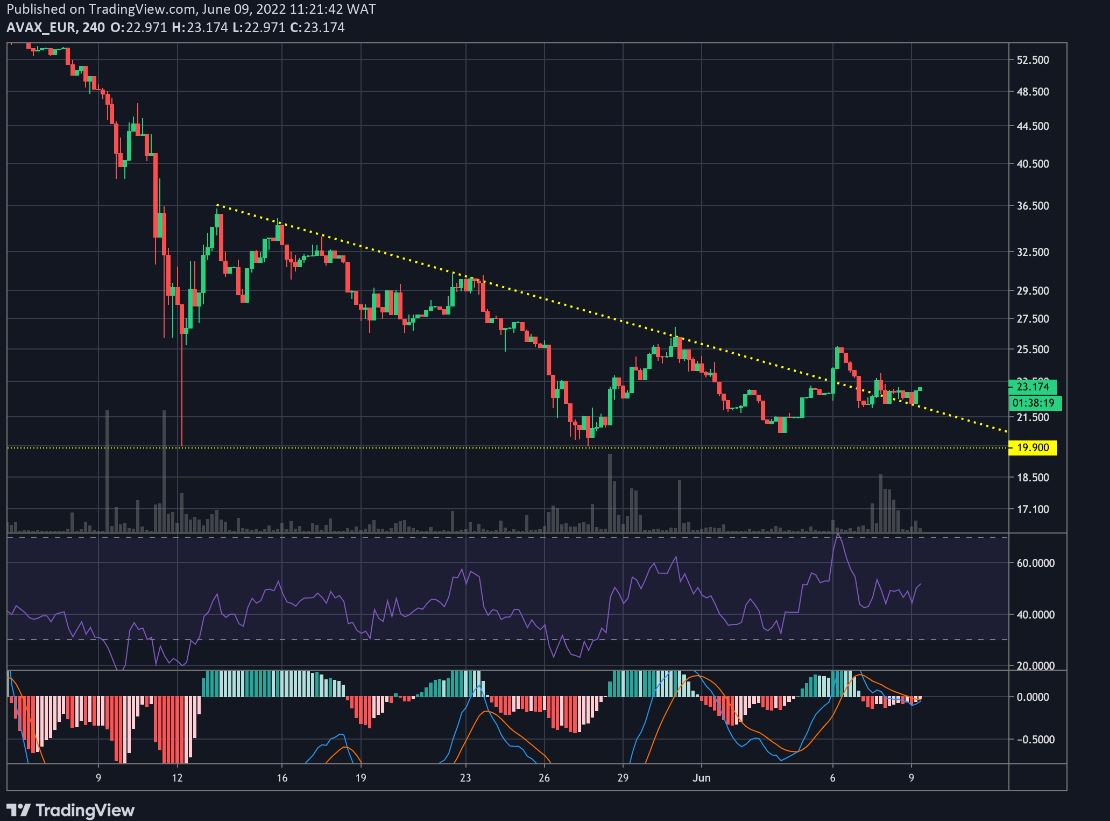
Avalanche it has bounced above the descending trend line, indicating that the bulls are defending these levels. The price is now testing the trend line which, in this case, serves as a new support level. If buyers hold out, the AVAX / EUR pair could gain momentum and begin its upward journey.
Although Bitcoin and altcoins are in green on the weekly charts, the resistance levels in the lead will continue to pose a challenge in the short term. Correlation with major US indices and macro data continue to influence cryptocurrencies and will be a driving force in the future as well.
* Data updated on 9/06/2022.
For more news from the financial markets and the world of fintech, check out the Weekly Recap on Bitpanda su Youtube