
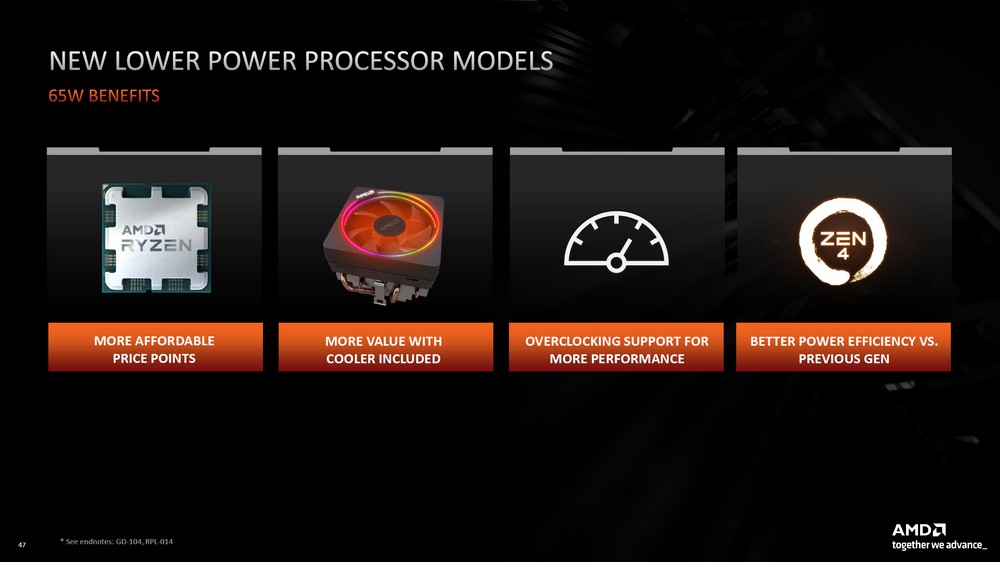
AMD brought quite a few new products to this year’s CES Keynote, including the upcoming Ryzen 7000 processor to be launched in February, as well as the mainstream, entry-level 65W Ryzen 7000 processor product line, including three Ryzen 7900, 7700 and 7600 The newly launched processor also supports PBO overclocking with unlocked multiplier and is equipped with AMD Faith cooler as standard.
AMD Ryzen 7000 joins 65W new force, looking forward to February 3D cache processor
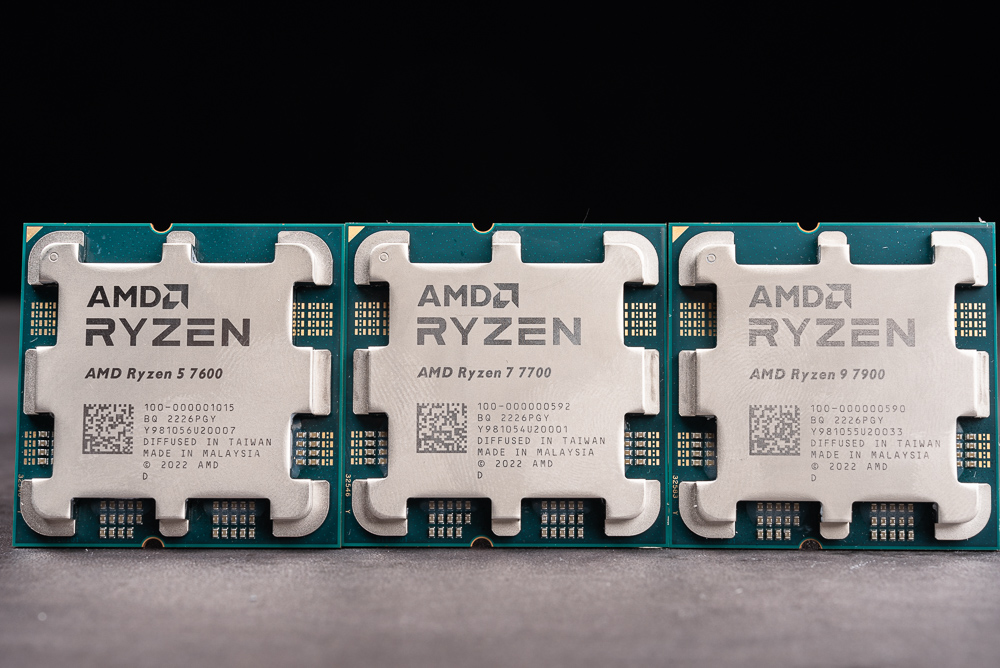
The newly added AMD Ryzen 7000 processors are mainly mainstream and entry-level products with 65W TDP, including Ryzen 9 7900’s 12 cores and 24 threads with a maximum clock speed of 5.4GHz Boost, and Ryzen 7 7700’s 8 cores and 16 threads with a maximum speed of 5.3GHz Boost Compatible with Ryzen 5 7600’s 6-core 12-threaded products with a clock speed of up to 5.1GHz.
↑ Ryzen 7000 65W processor.
The Ryzen 7000 generation adopts Zen 4 micro-architecture, 5nm process core, 6nm I/O Die and AM5 new platform, and also includes RDNA 2 2CU internal display, which is more useful for 65W entry-level processors. After all, DIY assembles a document In the case of an Internet computer, you can save the budget for buying a flash card, and adding more RAM or SSD will be even more valuable.
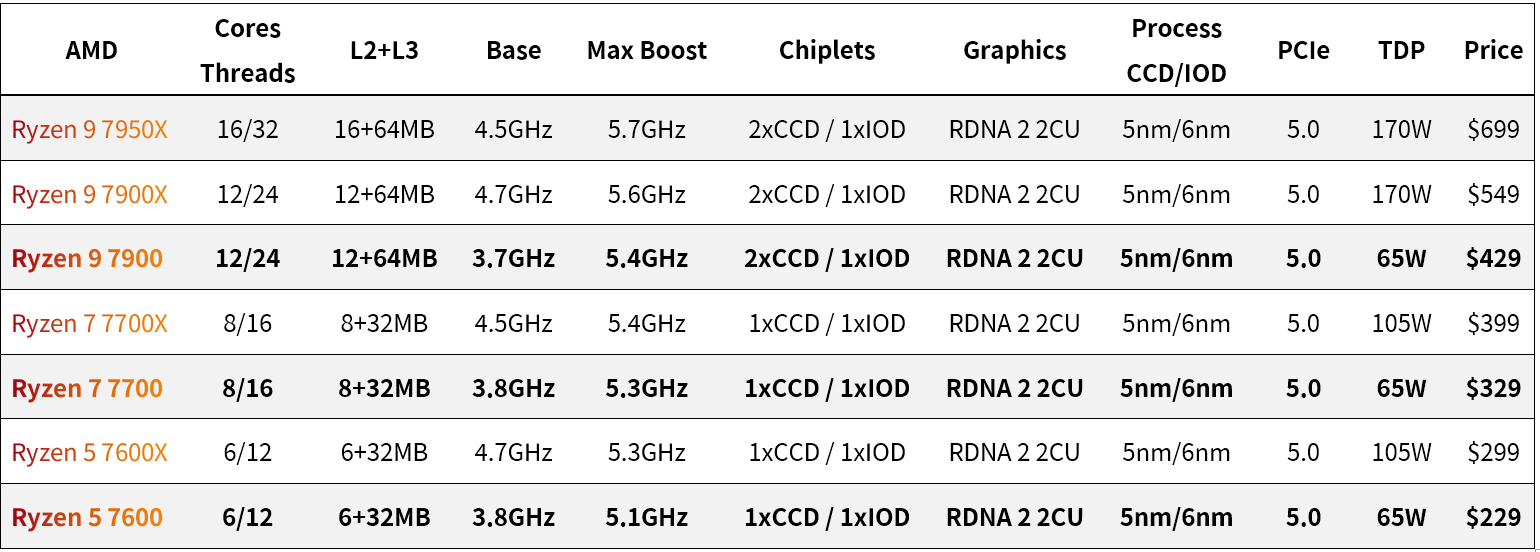
↑ Ryzen 7000 Desktop Spec Sheet.
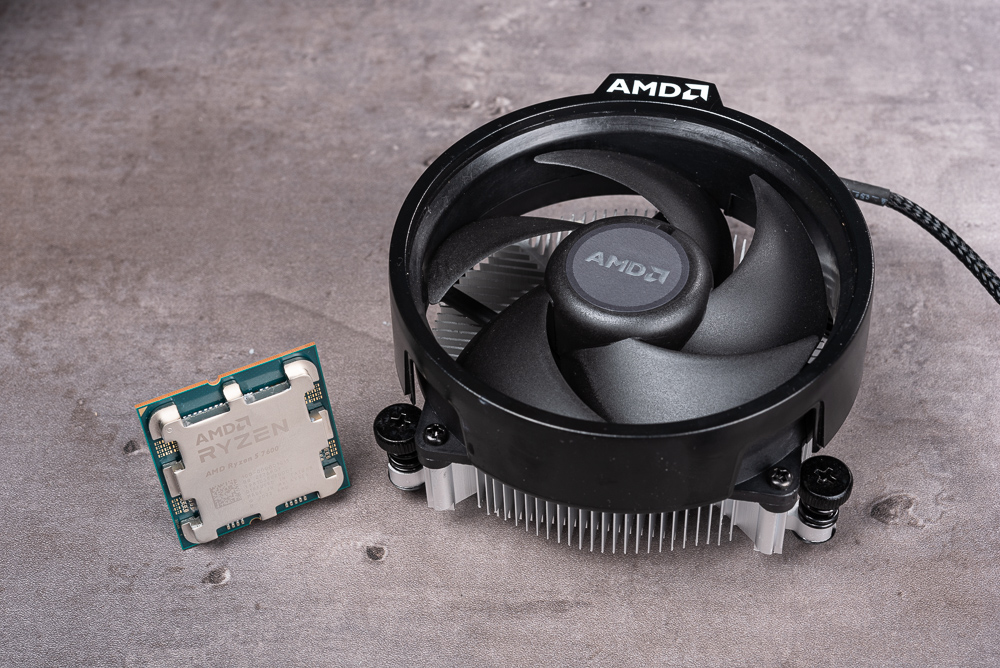
In addition, Ryzen 9 7900 and Ryzen 7 7700 are equipped with AMD Wraith Prism RGB radiator as standard, while Ryzen 5 7600 is equipped with Wraith Stealth radiator. Even the 65W processor supports PBO overclocking. If gamers want a more cost-effective price, they can switch to an AIO water-cooled radiator to unlock PBO overclocking to obtain higher performance.
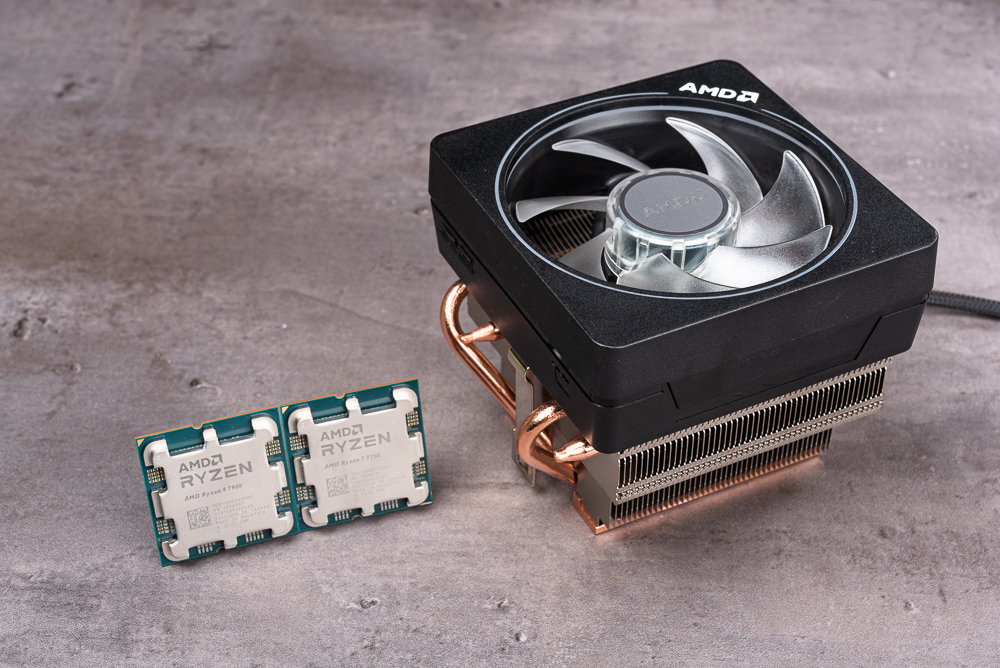
↑ AMD Wraith Prism RGB cooler.
↑ AMD Wraith Stealth cooler.
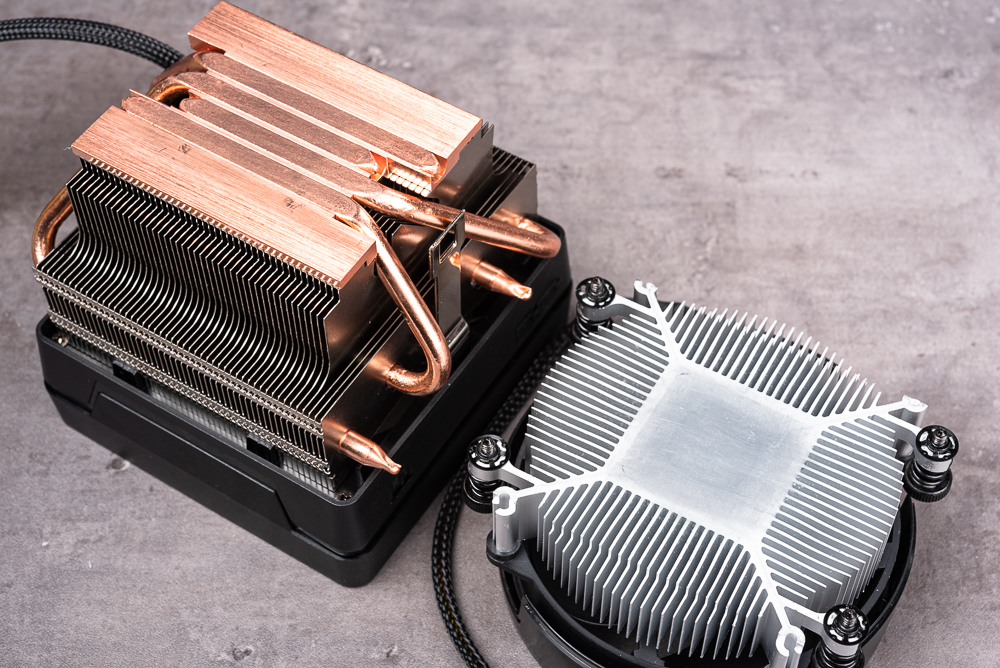
↑ Wraith Prism can bring good heat dissipation performance through copper bottom, heat pipe and cooling fins; Wraith Stealth is a general aluminum extruded radiator.
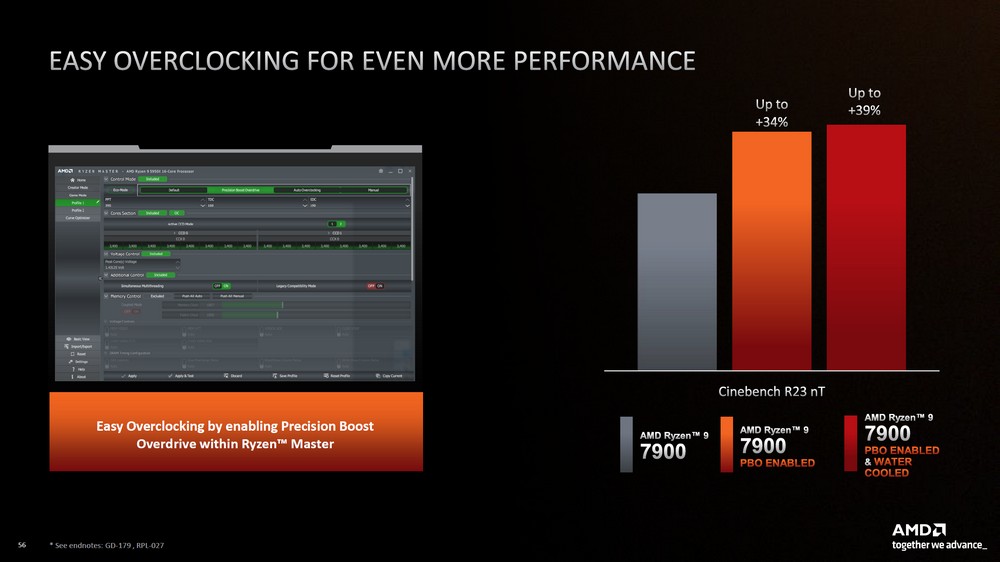
↑ Through PBO overclocking, 7900 multi-core can get 39% performance improvement.
Test platform and settings
This test is mainly based on the performance test of the Ryzen 7000 family. In addition to the newly launched Ryzen 7900, 7700 and 7600, the X-series Ryzen 7950X, 7900X, 7700X and 7600X are also added, so that players can better understand this generation of processors when choosing difference in device performance.
In terms of heat dissipation, Ryzen 7900 and 7700 use Wraith Prism RGB radiators, while 7600 uses Wraith Stealth radiators. As for Ryzen 7950X, 7900X, 7700X and 7600X, they use AIO 360mm water-cooled radiators. DDR5-5200 XMP memory settings; the test platform is provided below for your reference.
testing platform
Processor: AMD Ryzen 9 7950X, 7900X, 7900, 7700X, 7700, 7600X, 7600
Motherboard: ASUS ROG CROSSHAIR X670E HERO
Memory: CORSAIR DOMINATOR PLATINUM RGB DDR5 32GBx2 5200MHz
Graphics card: AMD Radeon RX 7900 XTX
System drive: Solidigm P41 Plus 1TB PCIe 4.0 SSD
Radiator: Wraith Prism (7900 / 7700), Wraith Stealth (7600), 360mm AIO Liquid Cooler (7950X / 7900X / 7700X / 7600X)
Power supply: Seasonic PRIME PX-1000
OS: Windows 11 Pro 22H2
CPU-Z The correct processor information can be viewed, code-named Raphael, 5nm process, Ryzen 9 7900 12C24T, Ryzen 7 7700 8C6T and Ryzen 5 7600 6C12T and other processors.
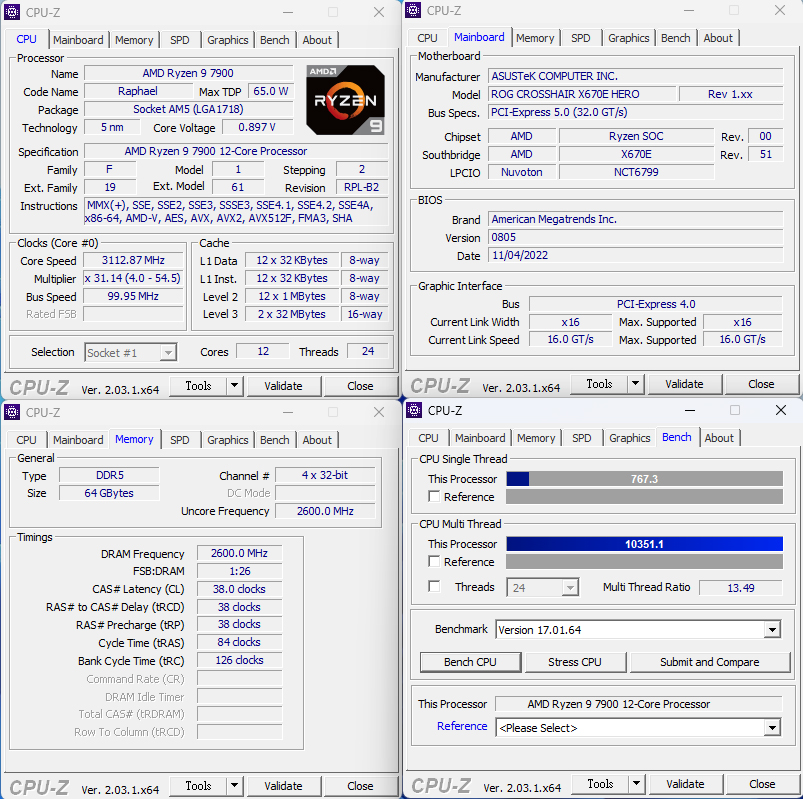
↑ CPU-Z Ryzen 9 7900。
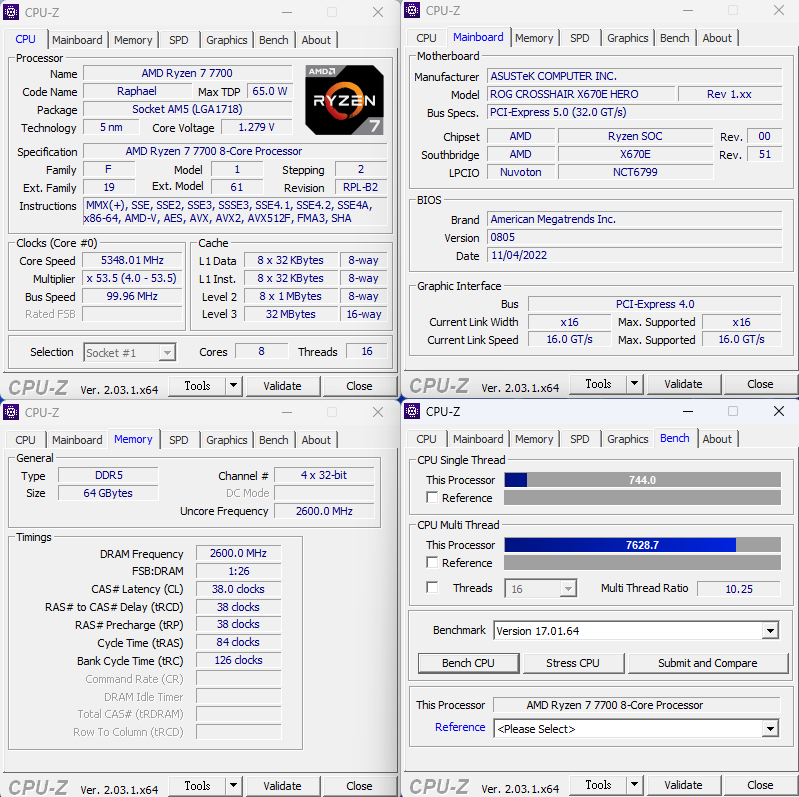
↑ CPU-Z Ryzen 7 7700。
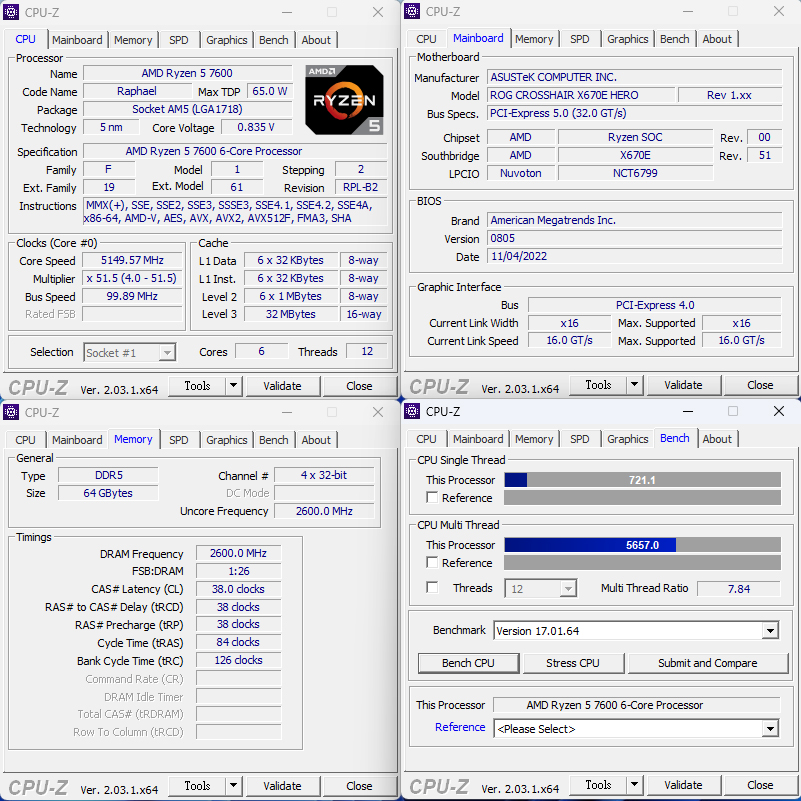
↑ CPU-Z Ryzen 5 7600。
Processor computing performance Cinebench, VRay rendering test
CINEBENCH R20developed by MAXON based on Cinema 4D, can be used to evaluate the 3D rendering performance of computer processors. It is also a reliable test software that can quickly evaluate the performance of CPU multi-core computing.
The nT multi-threaded 7900 has 9472 points, 7700 has 7280 points, and 7600 has 5473 points; 1T single-threaded 7900 has 763 points, 7700 has 751 points, and 7600 has 723 points.
Compared with the previous generation of X series, the 7900 multi-core decreased by -16%, single thread -2.6%, the 7700 was -6.4%, -3.1%, and the 7600 was -8.2%, -5.7%.
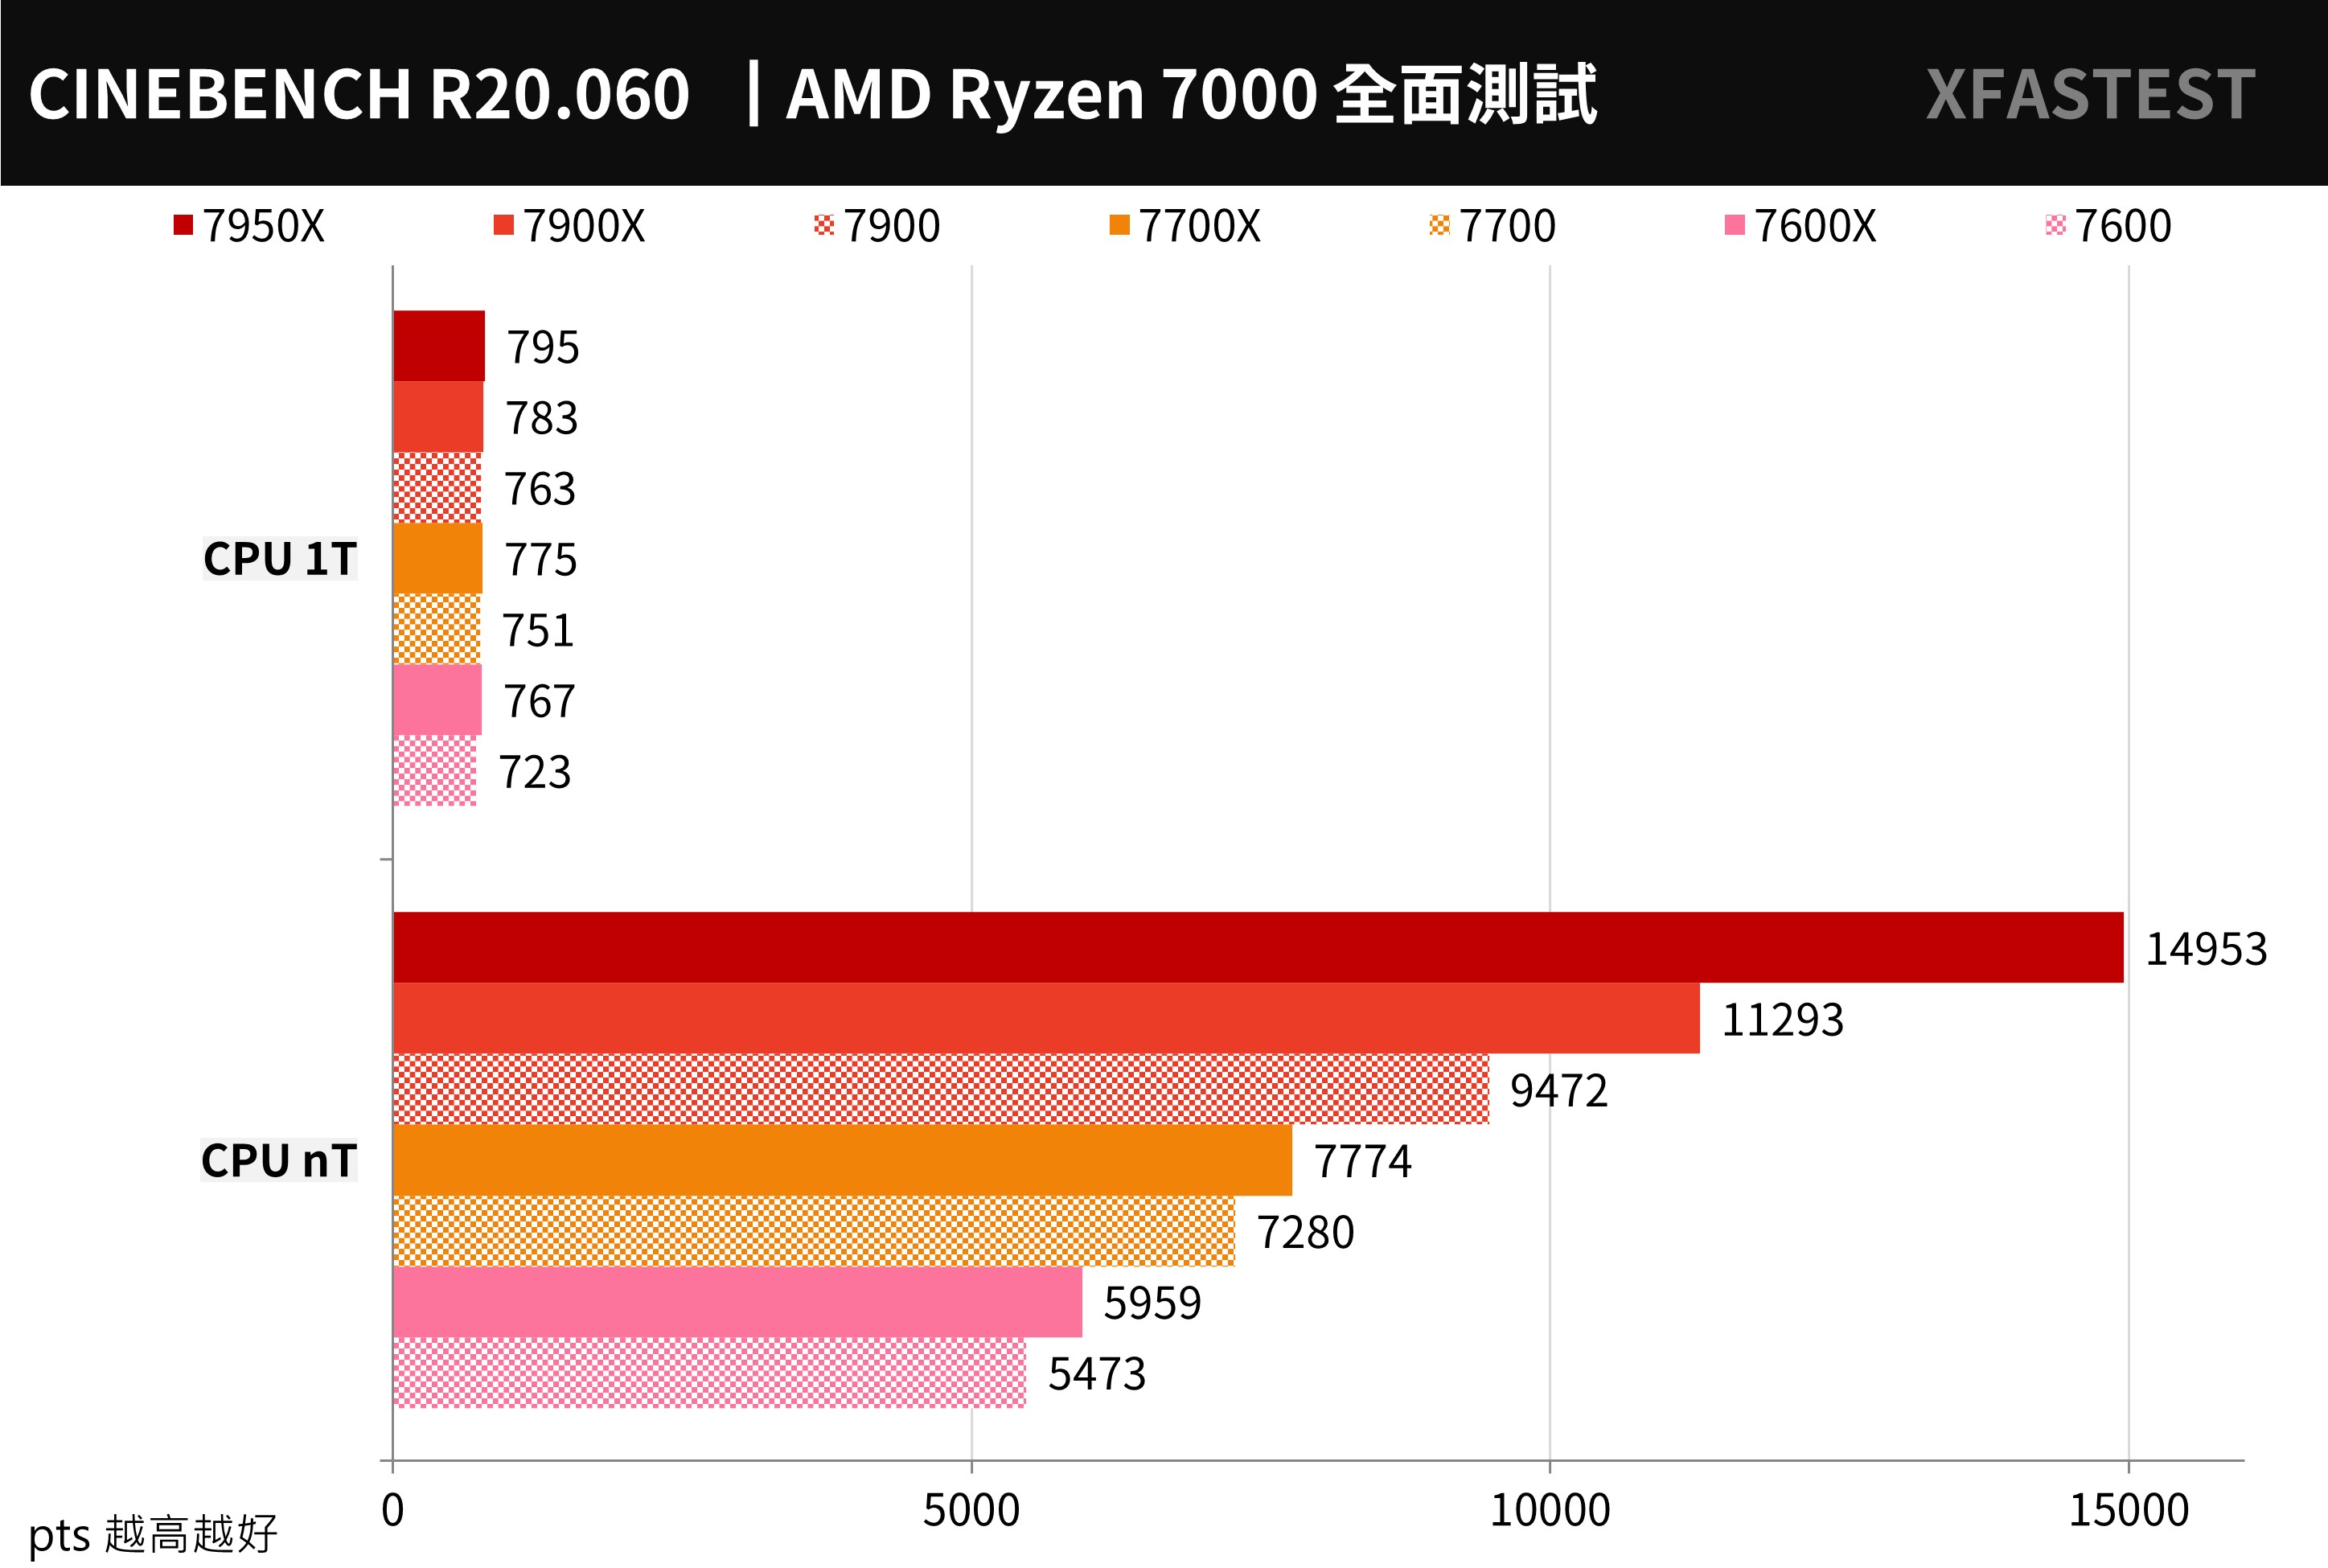
↑ CINEBENCH R20, the higher the score, the better.
CINEBENCH R23 The test scenario is the same as R20, with a new compiler and a stress test function. Players can customize the Minimum Test Duration time, such as 10 or 30 minutes to test the stability of the computer; however, the results of R23 cannot be compared with R20.
nT multi-threaded 7900 scored 23983 points, 7700 scored 18628 points, and 7600 scored 13924 points; 1T single-threaded 7900 scored 1964 points, 7700 scored 1931 points, and 7600 scored 1857 points.
Compared with the previous generation of X series, the 7900 multi-core is reduced by -18%, and the single thread is -2.8%, the 7700 is -6.5%, -2.9%, and the 7600 is -8.8%, -5.6%.
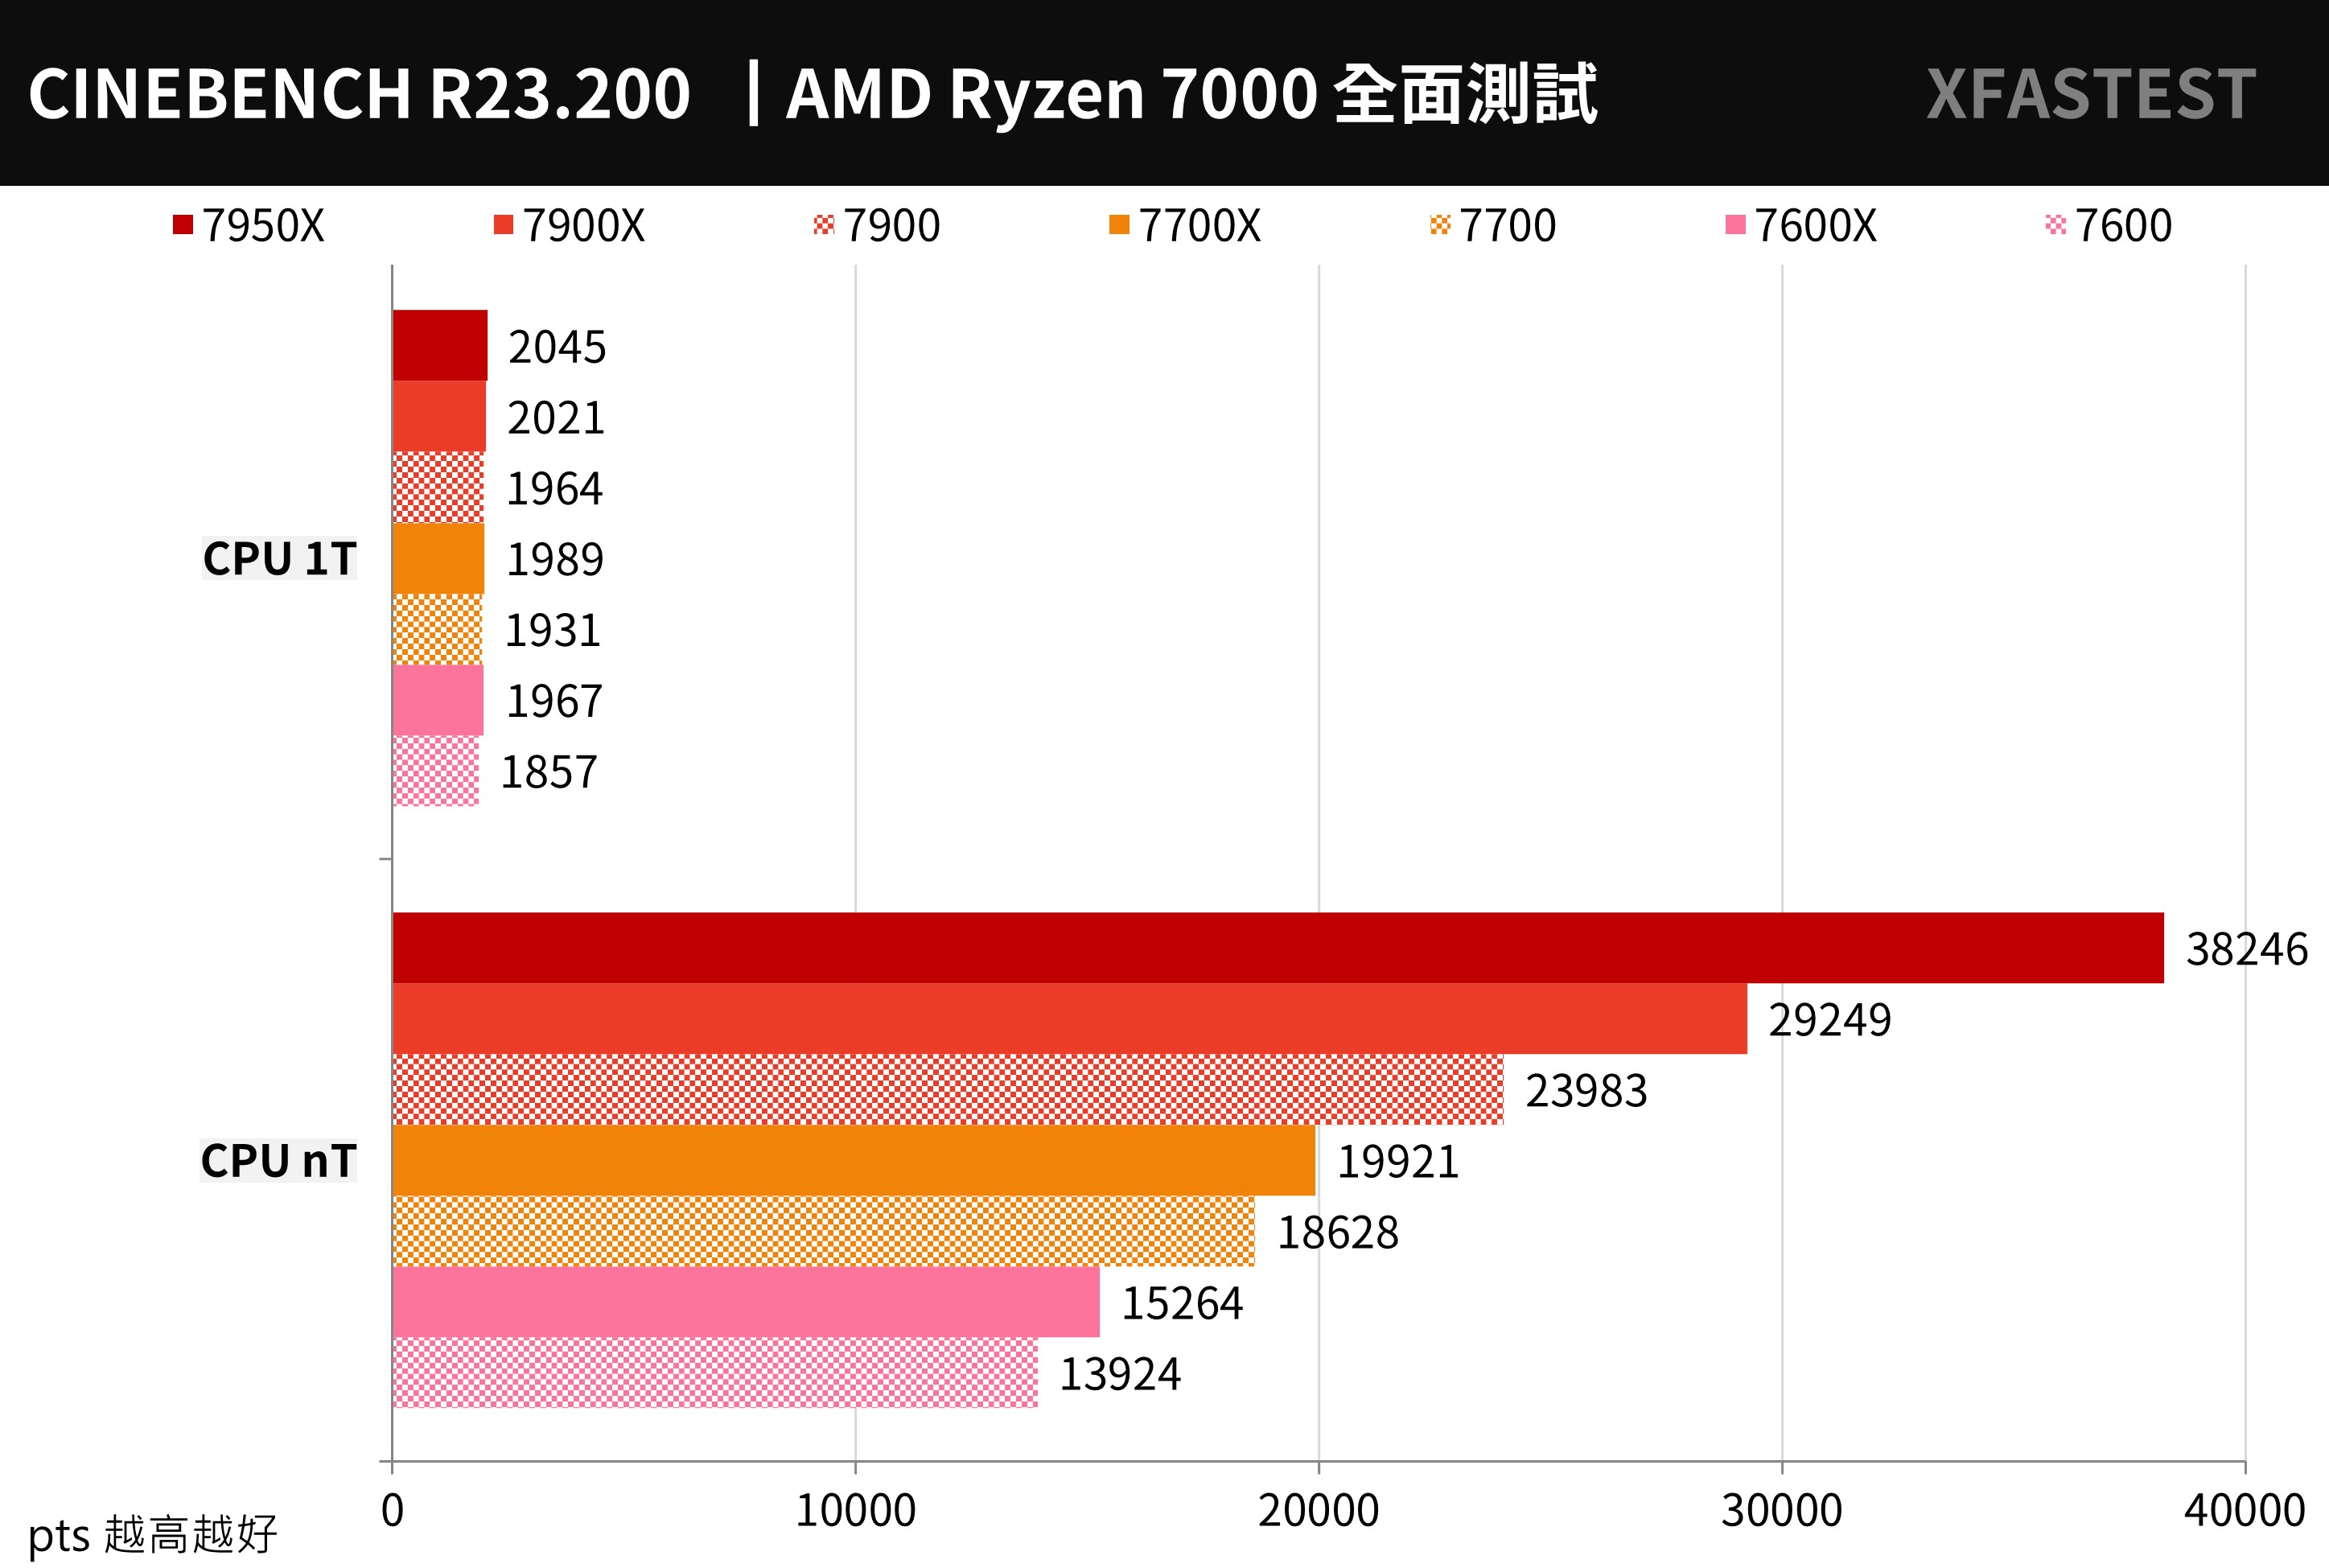
↑ CINEBENCH R23, the higher the score, the better.
Corona Benchmark It is a very easy-to-operate testing tool. It uses the Corona Renderer 1.3 renderer to test, compare the rendering speed of the processor and the performance of Rays/s, and score the timing in seconds.
The 7900 takes 56 seconds to complete the calculation, the 7700 takes 1 minute and 15 seconds, and the 7600 takes 1 minute and 42 seconds. Compared with the previous generation X series, the computing performance is reduced by 7900 / -19.1%, 7700 / -5.6%, and 7600 / -8.5%.
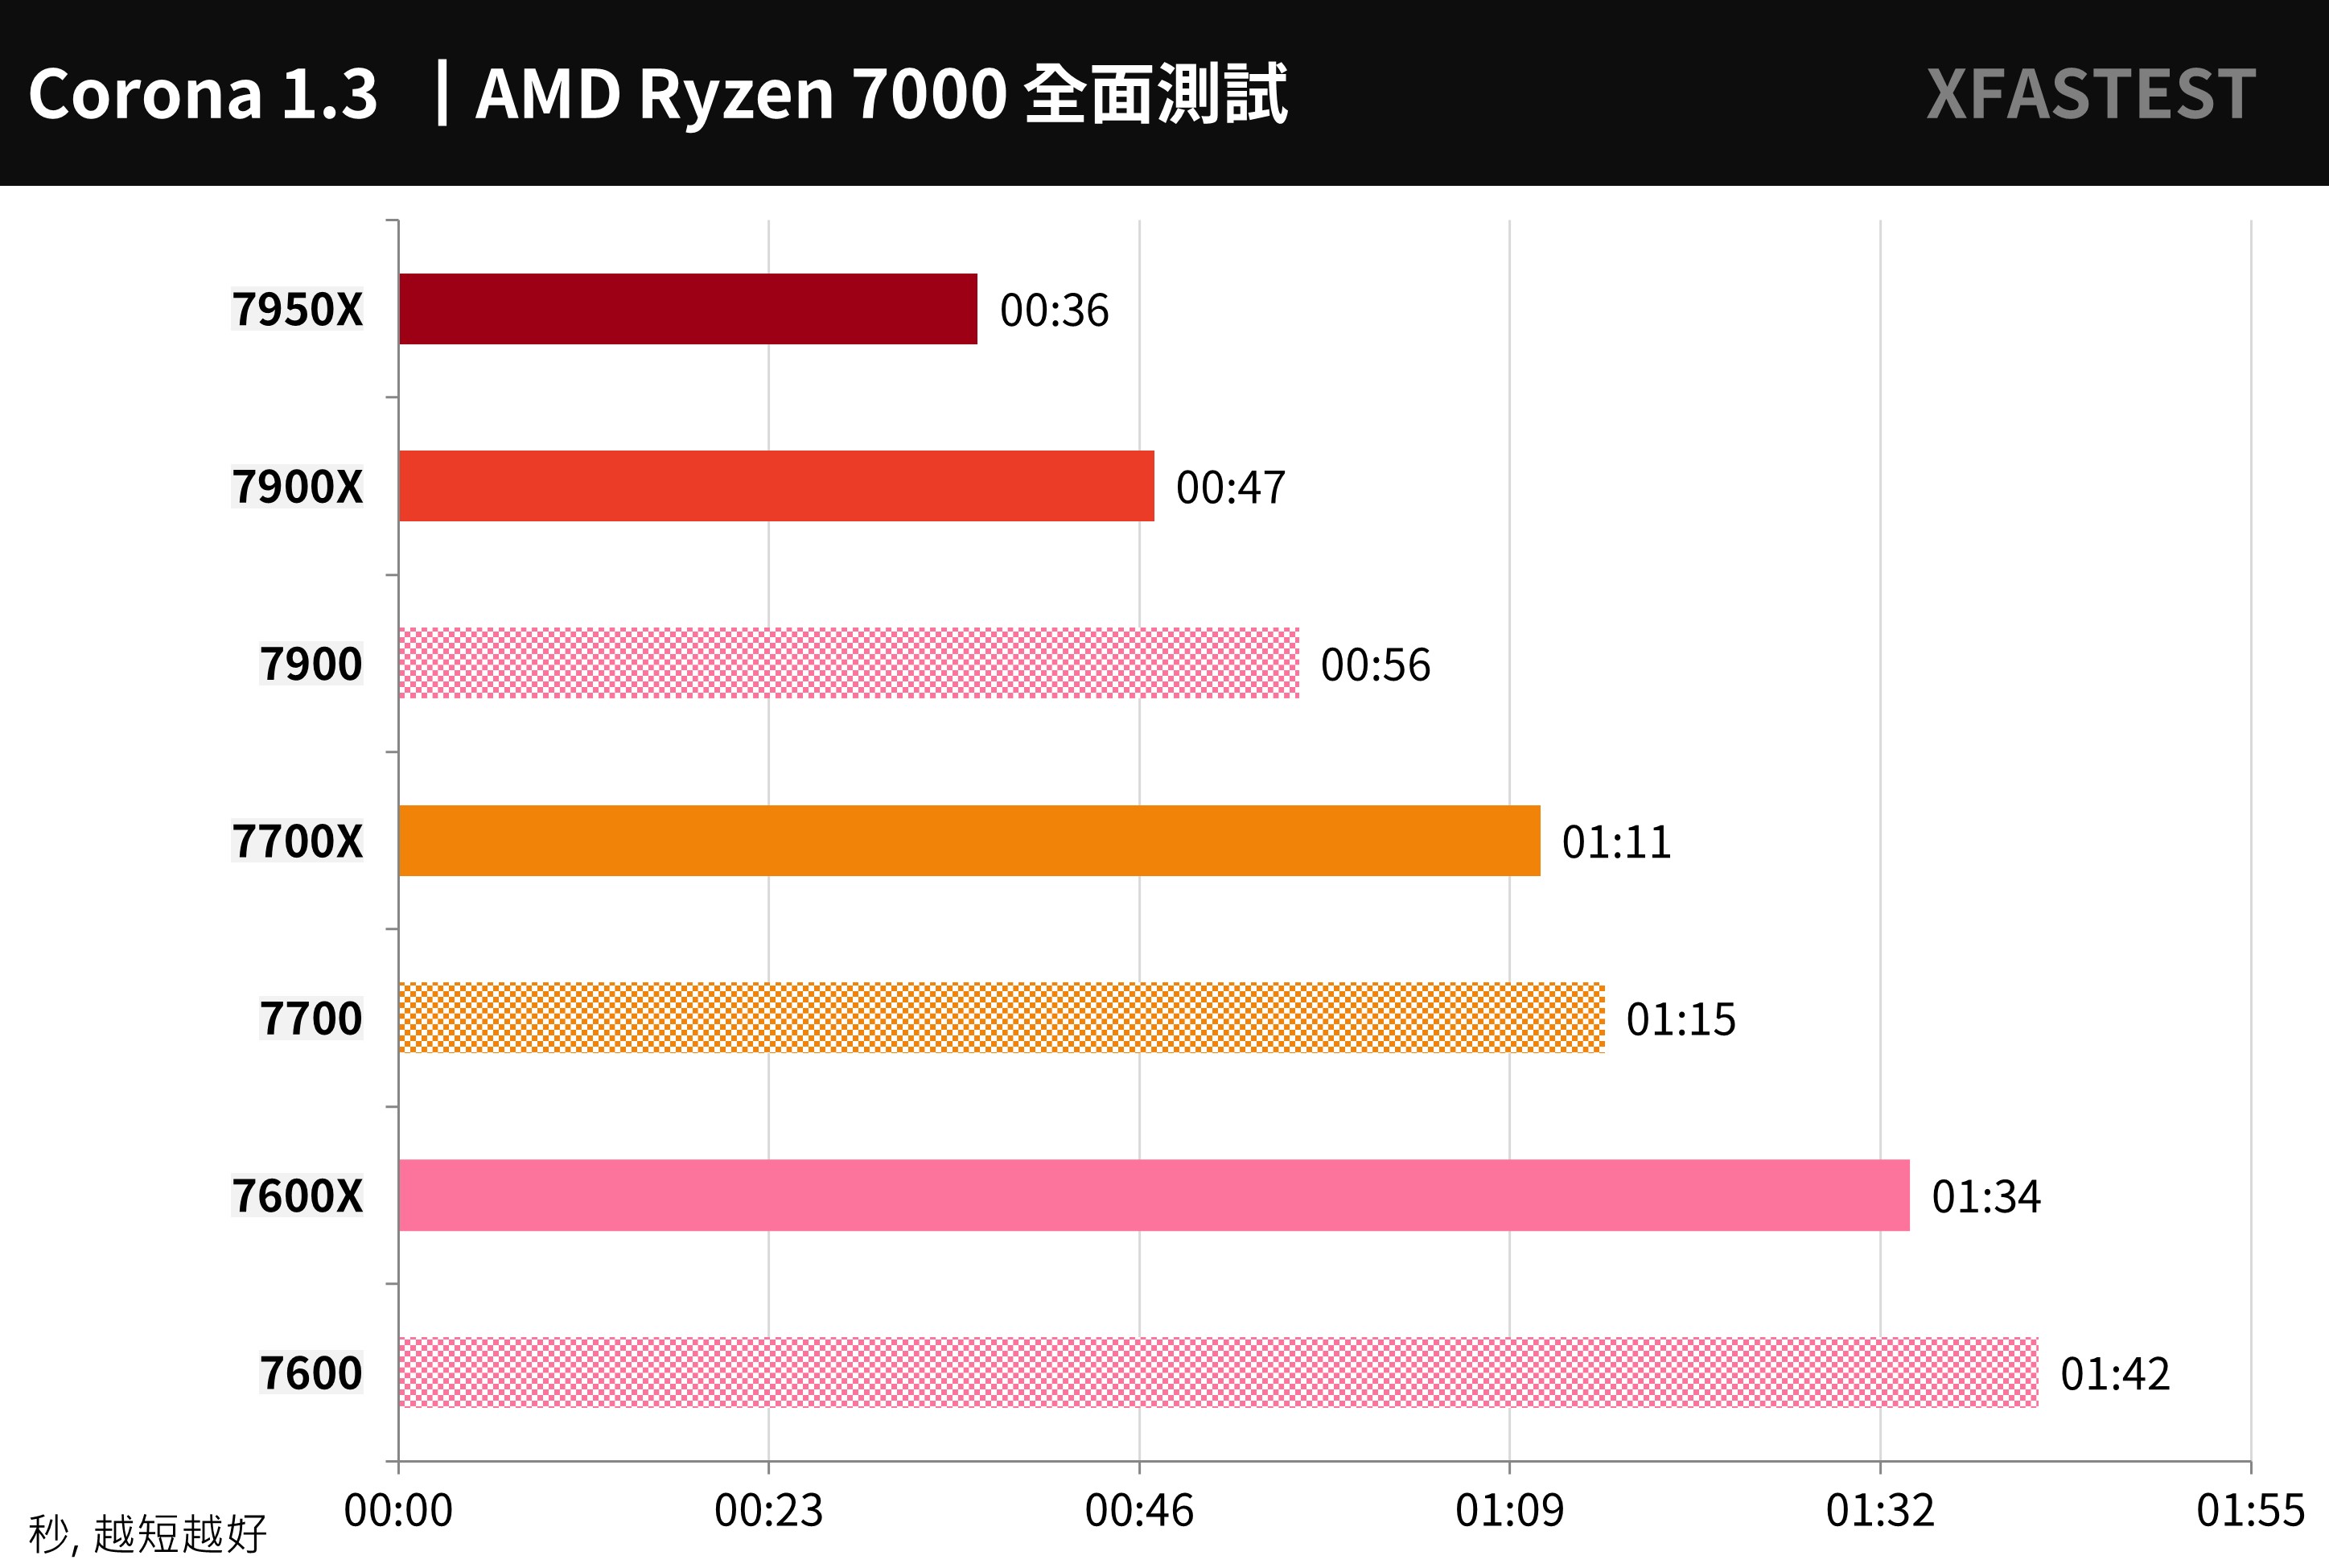
↑ Corona Benchmark, the shorter the better.
V-Ray Benchmark Developed by Chaos Group, V-Ray is a ray rendering software designed based on the laws of physics. This tool can test the computing performance of the rendered image for ray tracing on the CPU. The CPU score is calculated in units of vsamples per second.
The 7900 scored 18851 points, which is -15.4% less performance than the 7900X; the 7700 scored 14179 points, which was -7.2% less performance than the 7700X; the 7600 scored 10540 points, which was -9.3% less performance than the 7600X.
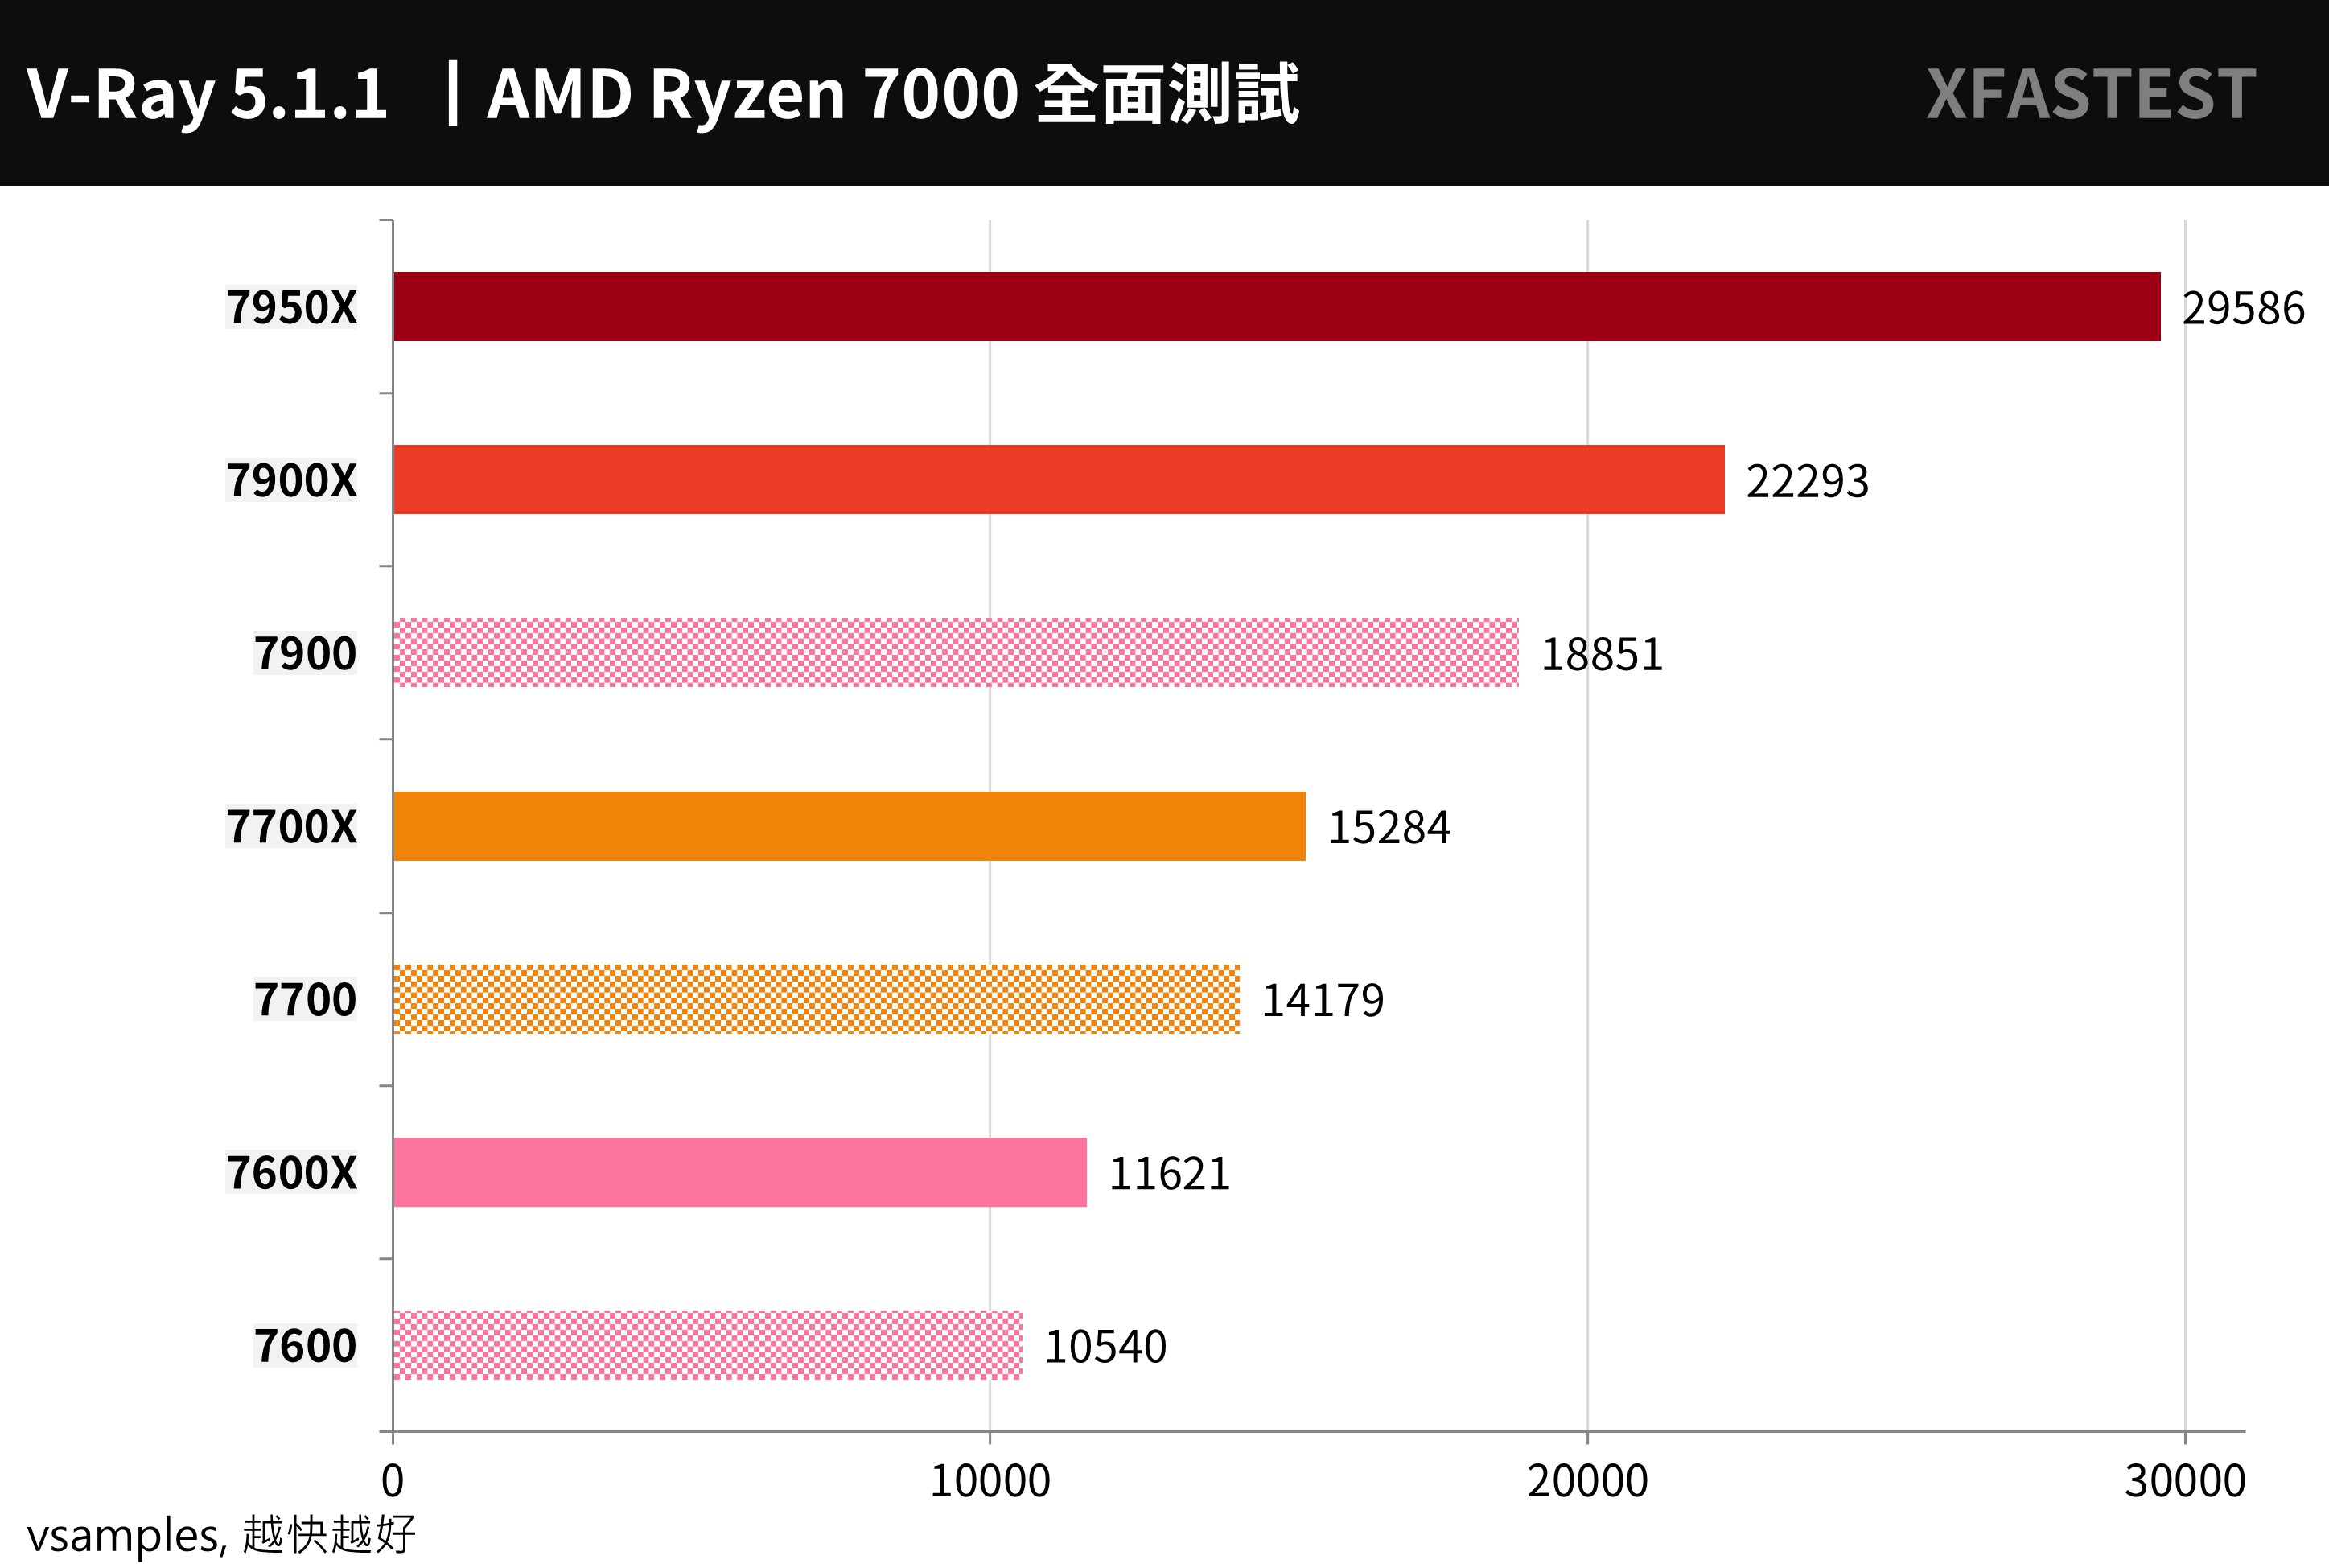
↑ V-Ray Benchmark, higher scores are better.
POV-Ray It is another set of free ray tracing 3D rendering tools, which uses the computing power of multi-core CPU to calculate the rendering of light and shadow and 3D images.
The 7900 scored 8137.5 points, which was -17.3% lower than the 7900X; the 7700 scored 6446.43 points, which was -6.6% lower than the 7700X; the 7600 scored 4878 points, which was -8% lower than the 7600X.
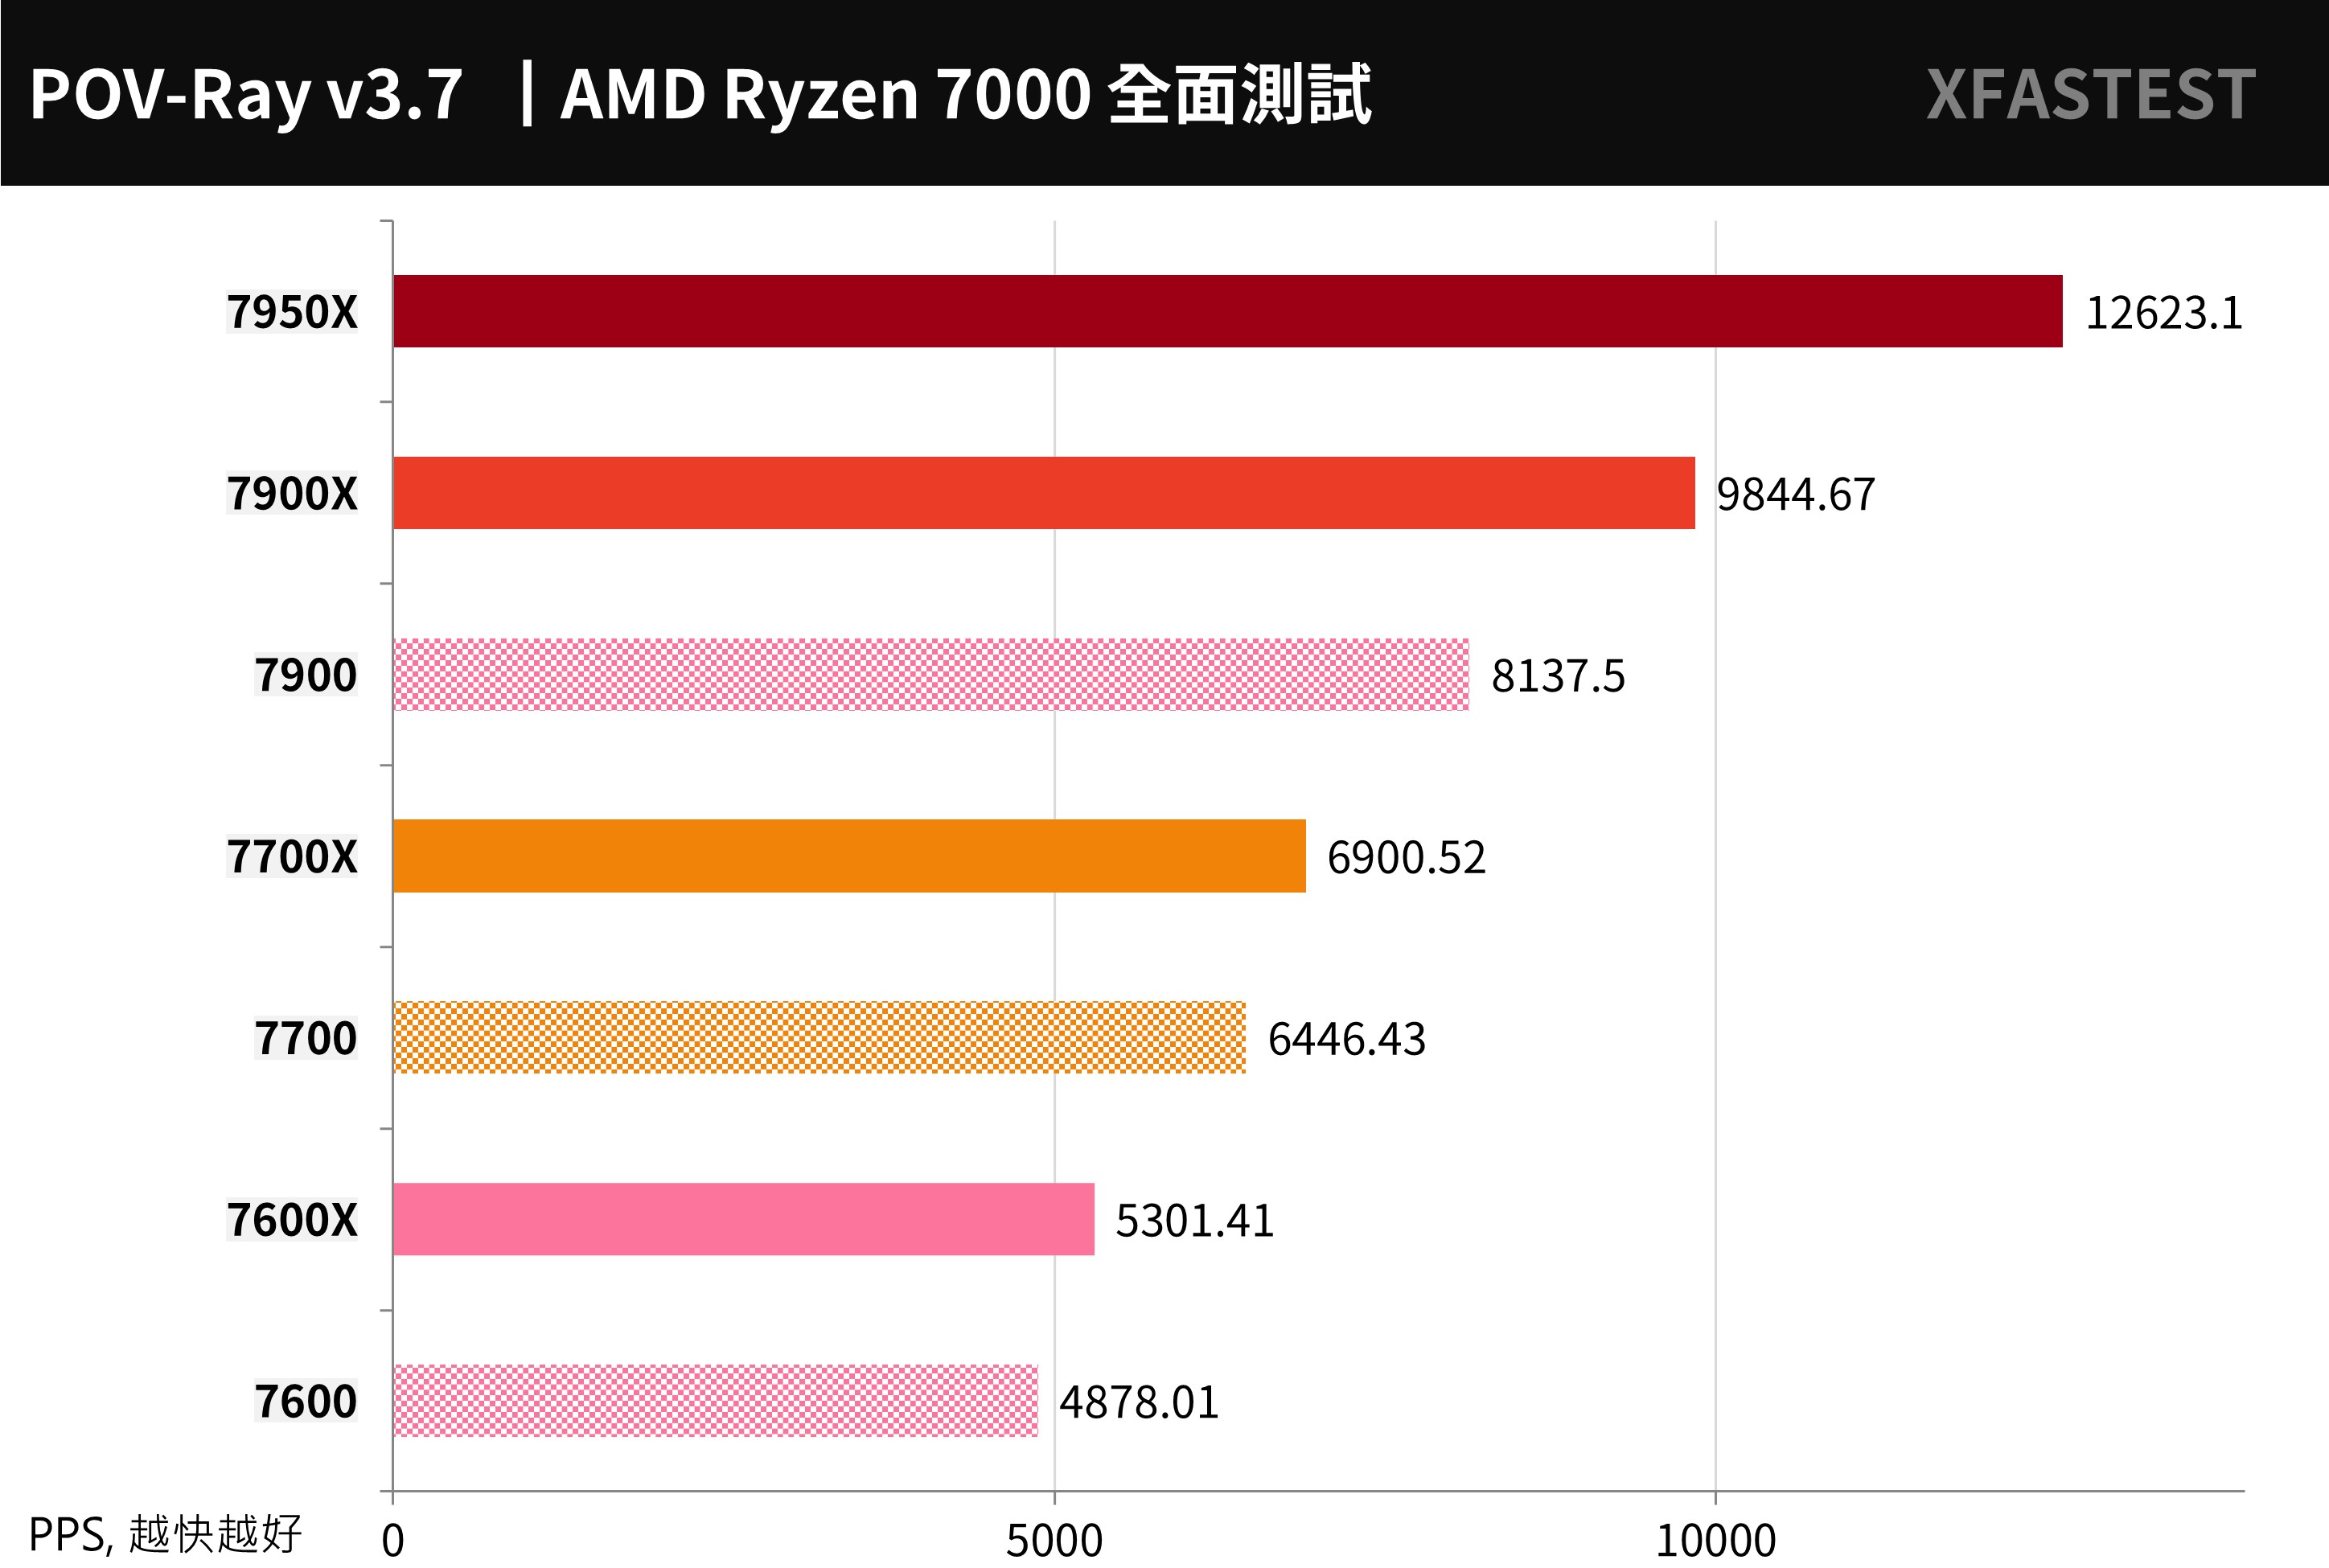
↑ POV-Ray, the higher the score the better.
Blender It is a cross-platform, open-source 3D creation tool that supports CPU and GPU rendering acceleration functions, as well as various 3D operations: Modeling, Rigging, Animation, Simulation, Rendering, Compositing and Motion Tracking, etc.
Blender Benchmark 3.4.0 test, using three test scenarios of monster, junkshop, and classroom, the 7900 has a -15.4% performance reduction compared to the 7900X; the 7700 has a -5.6% performance reduction compared to the 7700X; the 7600 has a -8.6% performance reduction compared to the 7600X.
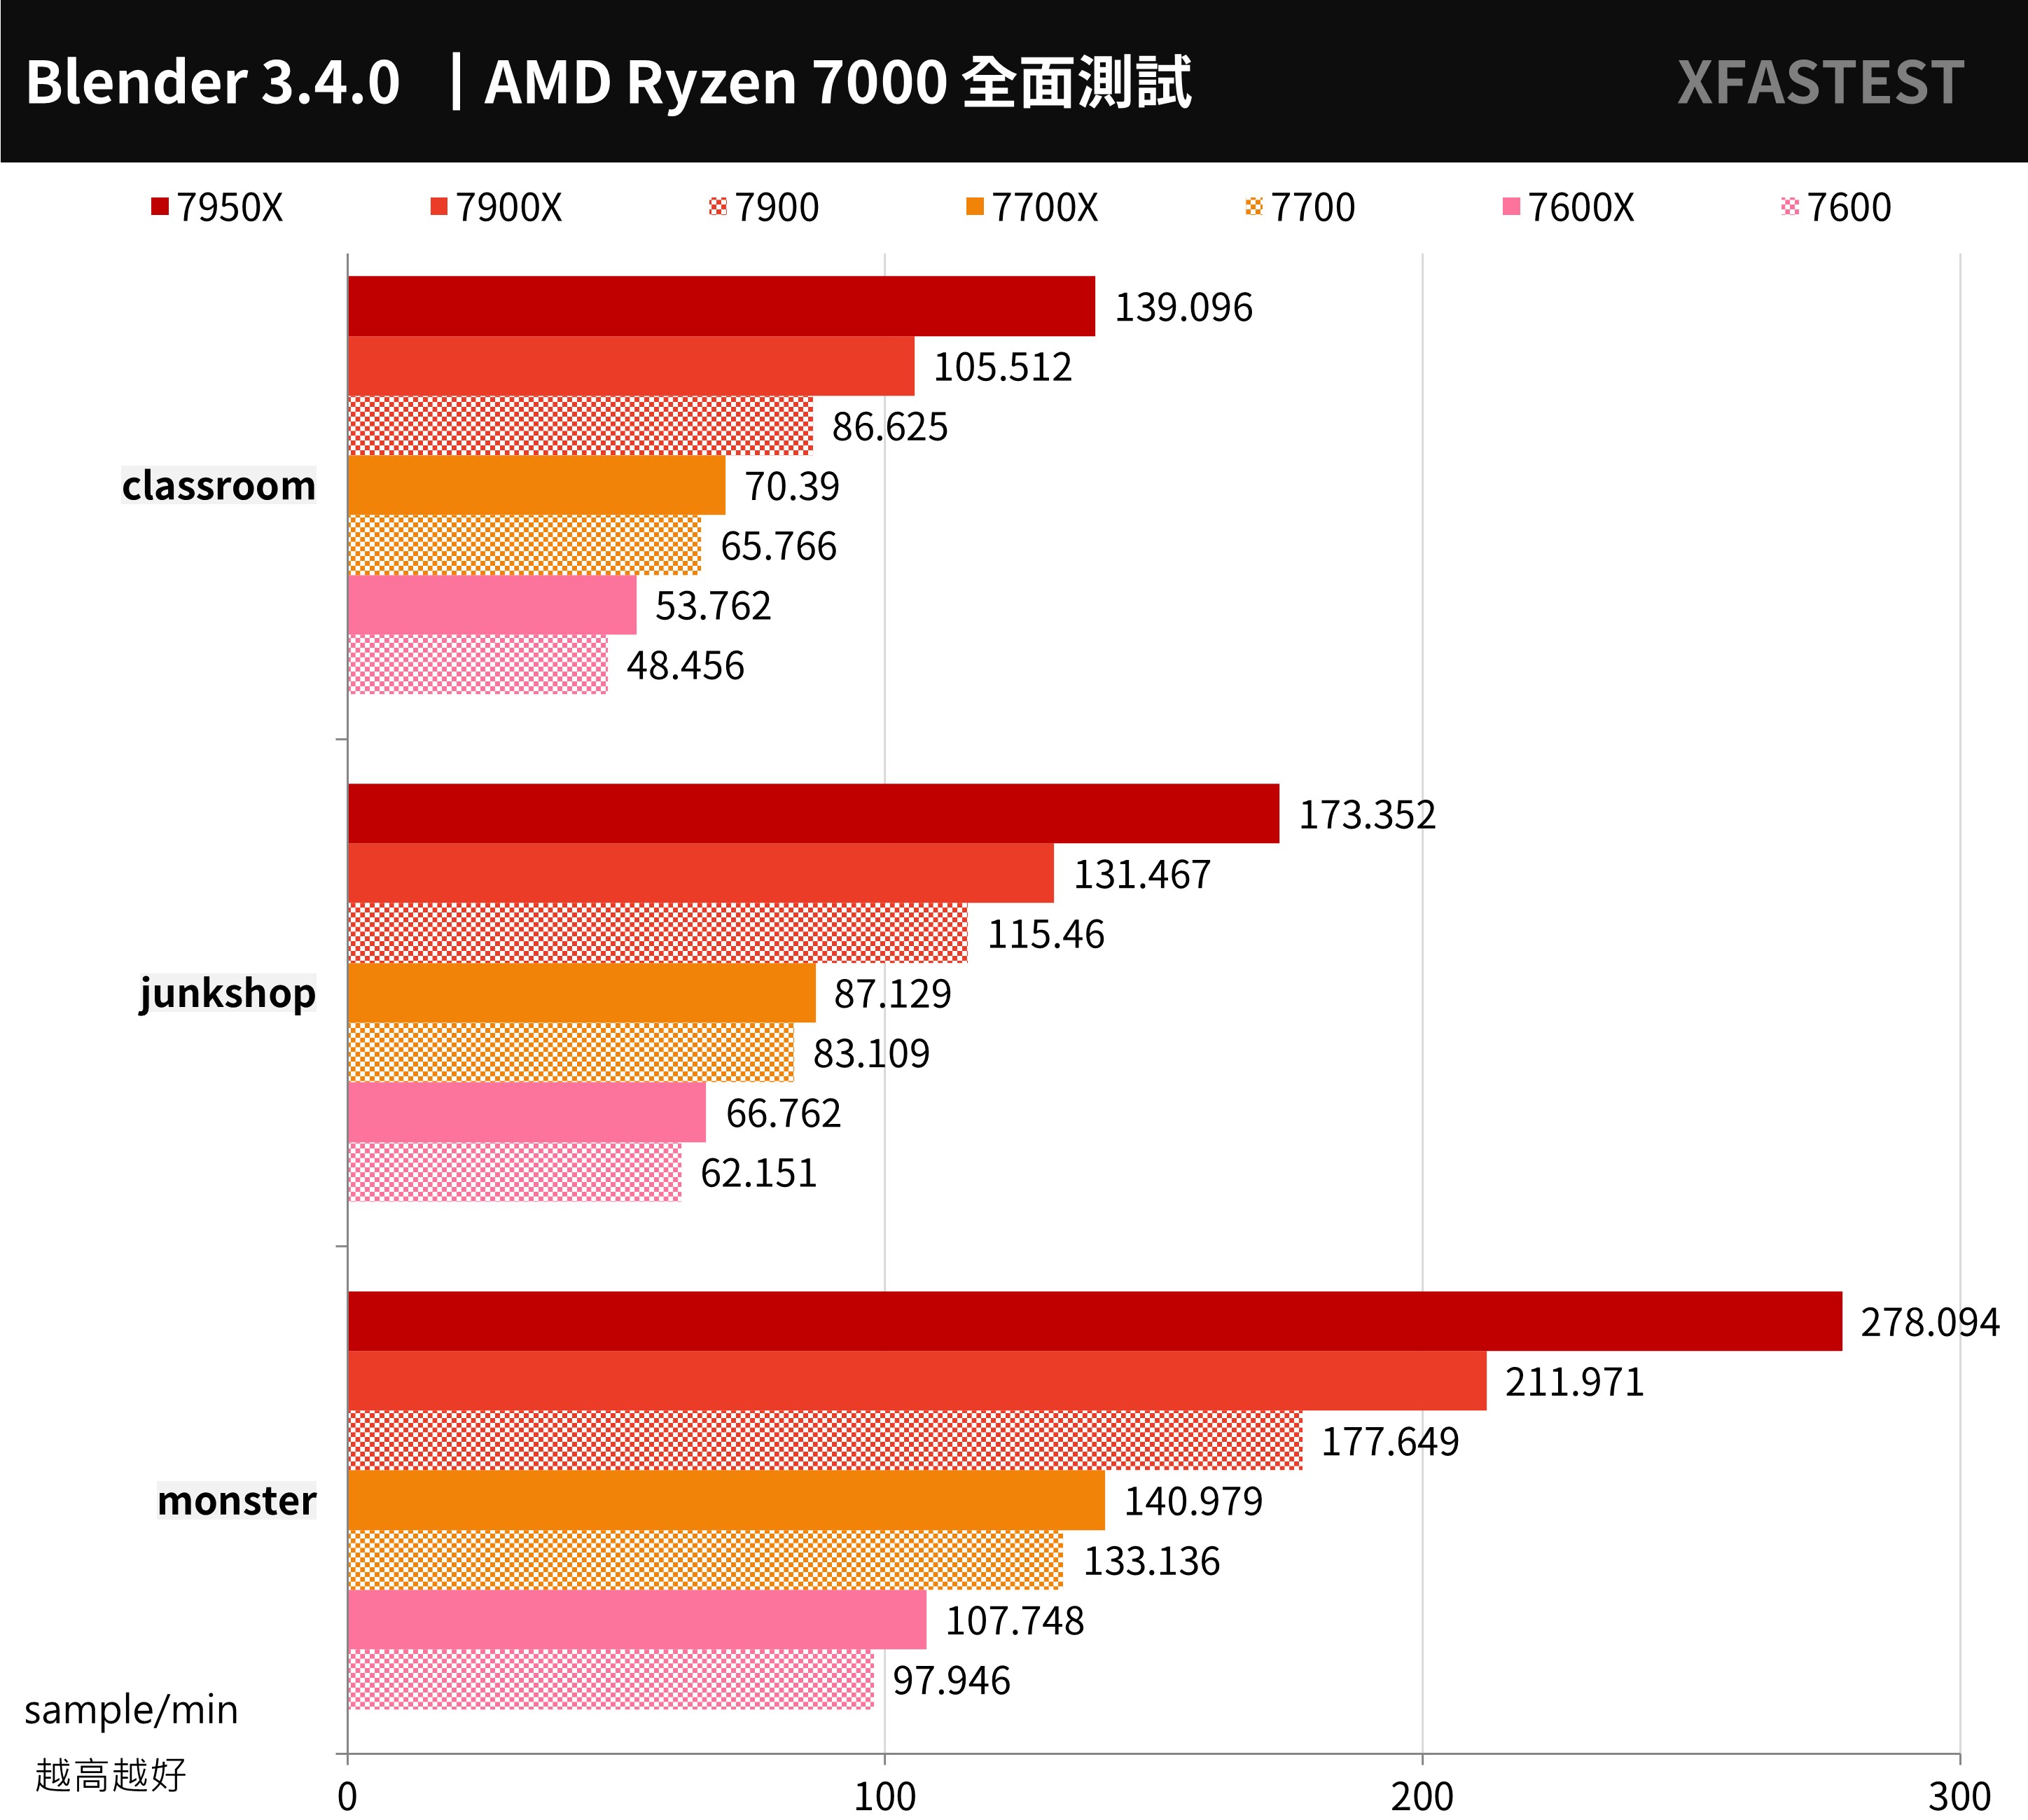
↑ Blender, the higher the score the better.
Creative PR image output, LR and PS photo editing performance test
For the conversion output test of Adobe Premiere Pro 2020, this time using UL Procyon Video Editing Benchmark Test tool, the test scenario is to use 2160p 30/60 FPS video, output as H.264 – YouTube 1080p Full HD and HEVC (H.265) – 4K UHD format respectively, and compare the output performance of pure CPU output and adding GPU acceleration . Tested using RX 7900 XTX graphics card.
If you are only comparing video output performance, the CPU difference is relatively insignificant under the current situation of GPU acceleration. Unless you use video effects that can only be calculated by the CPU or add test items such as editing operations and playback, you can test the audio and video. EDIT For obvious differences on different CPUs.
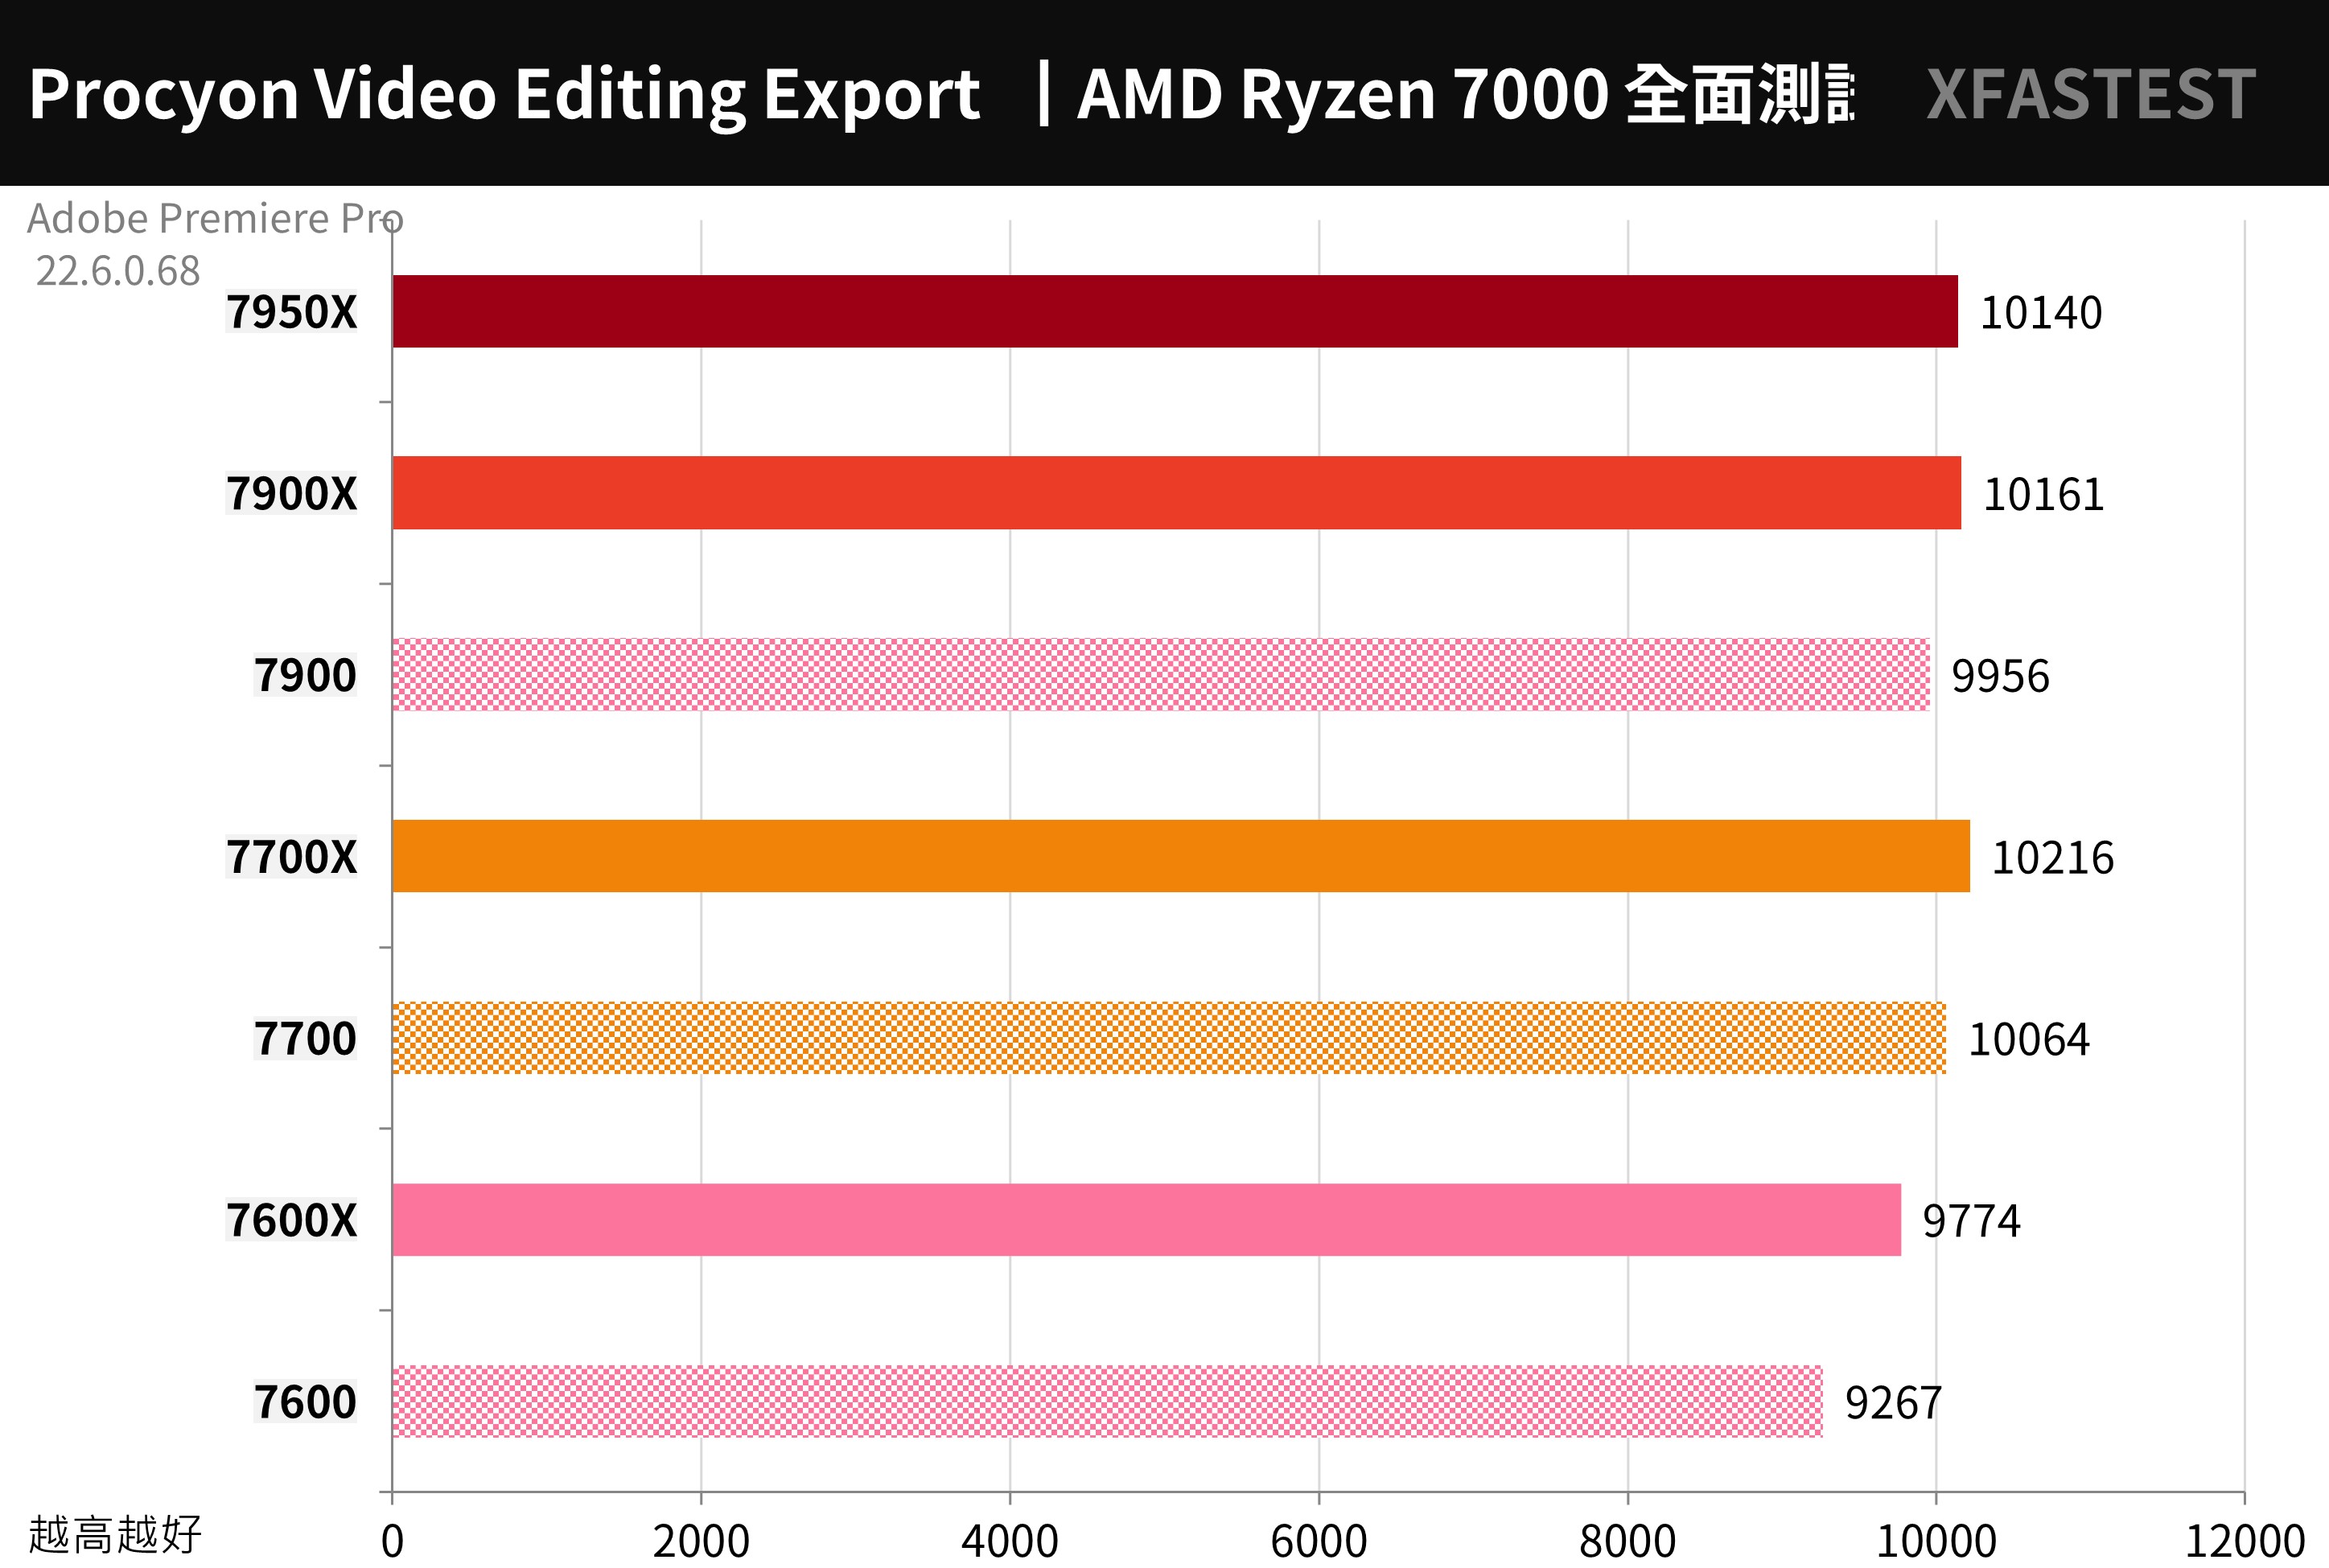
↑ UL Procyon Video Editing Benchmark, the higher the score, the better.
Adobe Photoshop and Lightroom Classic through UL Procyon Photo Editing Benchmark Test tool; the two working conditions of the test, Image Retouching test is to use Photoshop to retouch photos, and record the time of each step, while Batch Processing test is to use Lightroom to adjust and output a large number of photos in batches.
The total score of 7900 is 10374 points, 7700 is 10255 points, and 7600 is 9767 points. Modern mainstream CPUs can meet the performance required for photo editing, but the advantages of high-core processors can be clearly felt in batch processing.
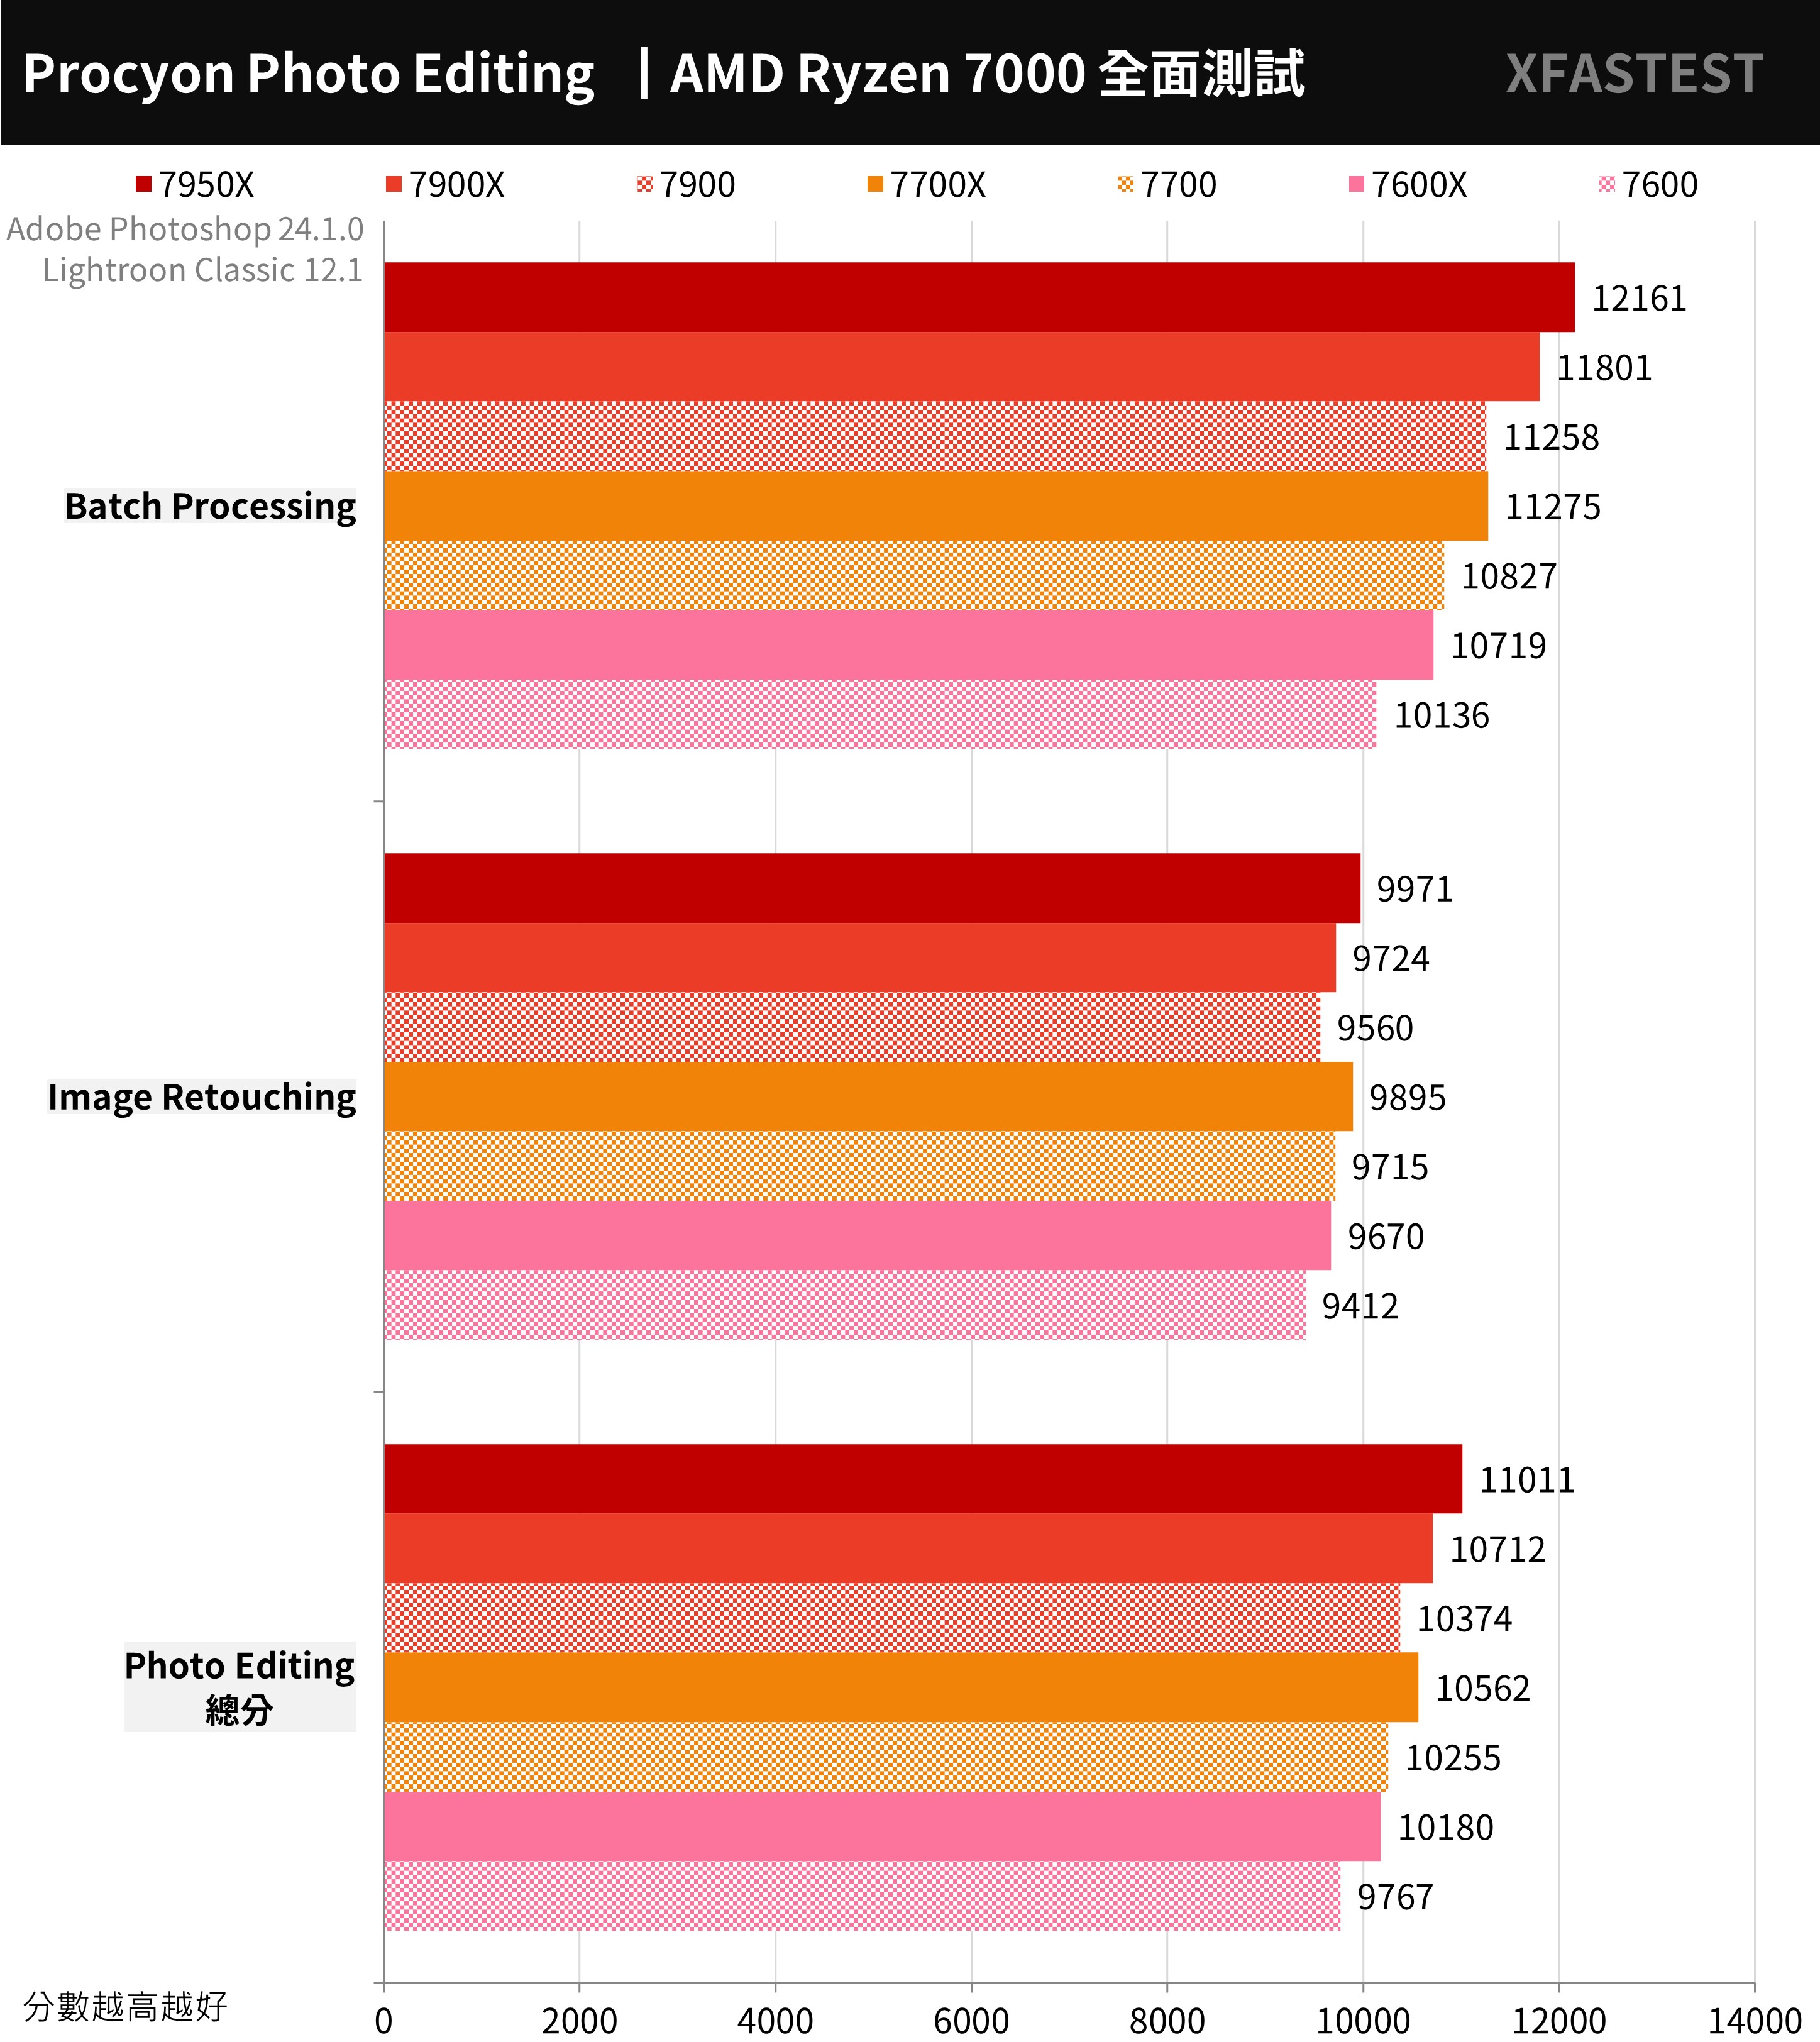
↑ UL Procyon Photo Editing Benchmark, the higher the score, the better.
AIDA64 processor memory, 7-Zip compression test
The memory test is carried out using AIDA64, using CORSAIR DOMINATOR PLATINUM RGB DDR5 32GBx2 5200MHz memory, the general writing can reach 74400 MB/s, while the reading of 7900 can reach 70594 MB/s, while 7700 and 7600 are 62198 MB /s.
Memory latency is between 73.1ns-74.7ns.
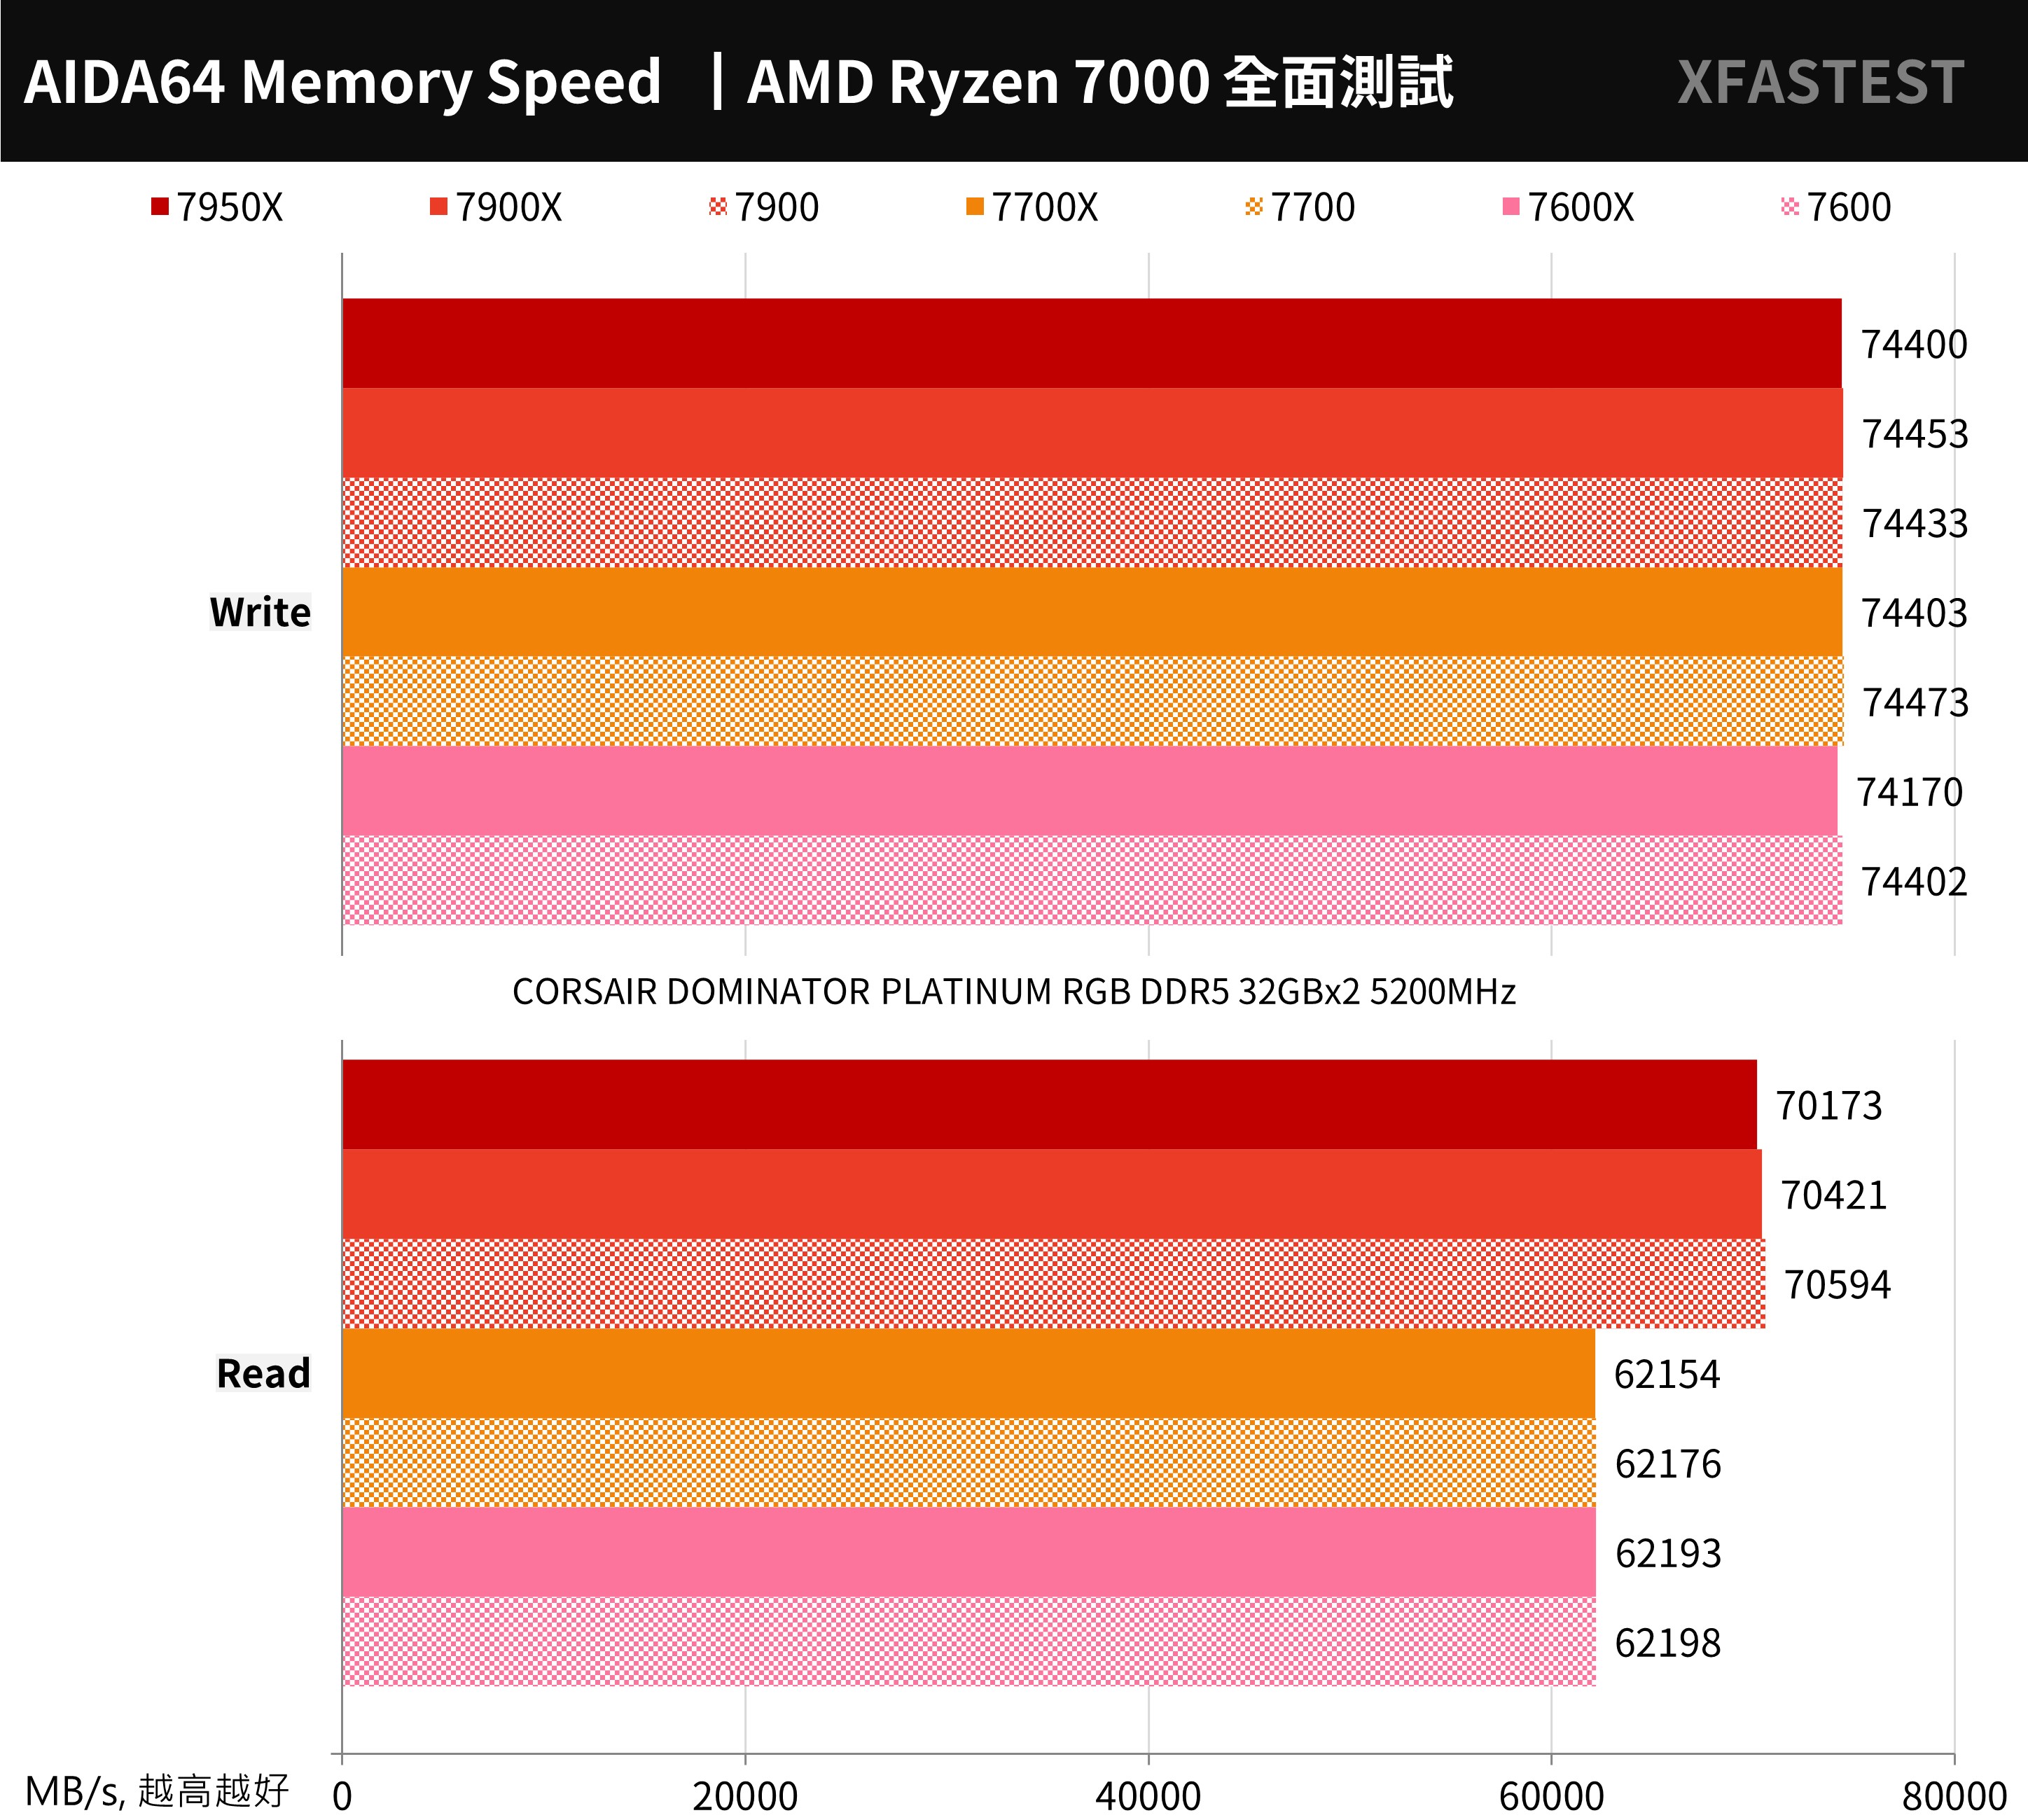
↑ AIDA64 memory test.
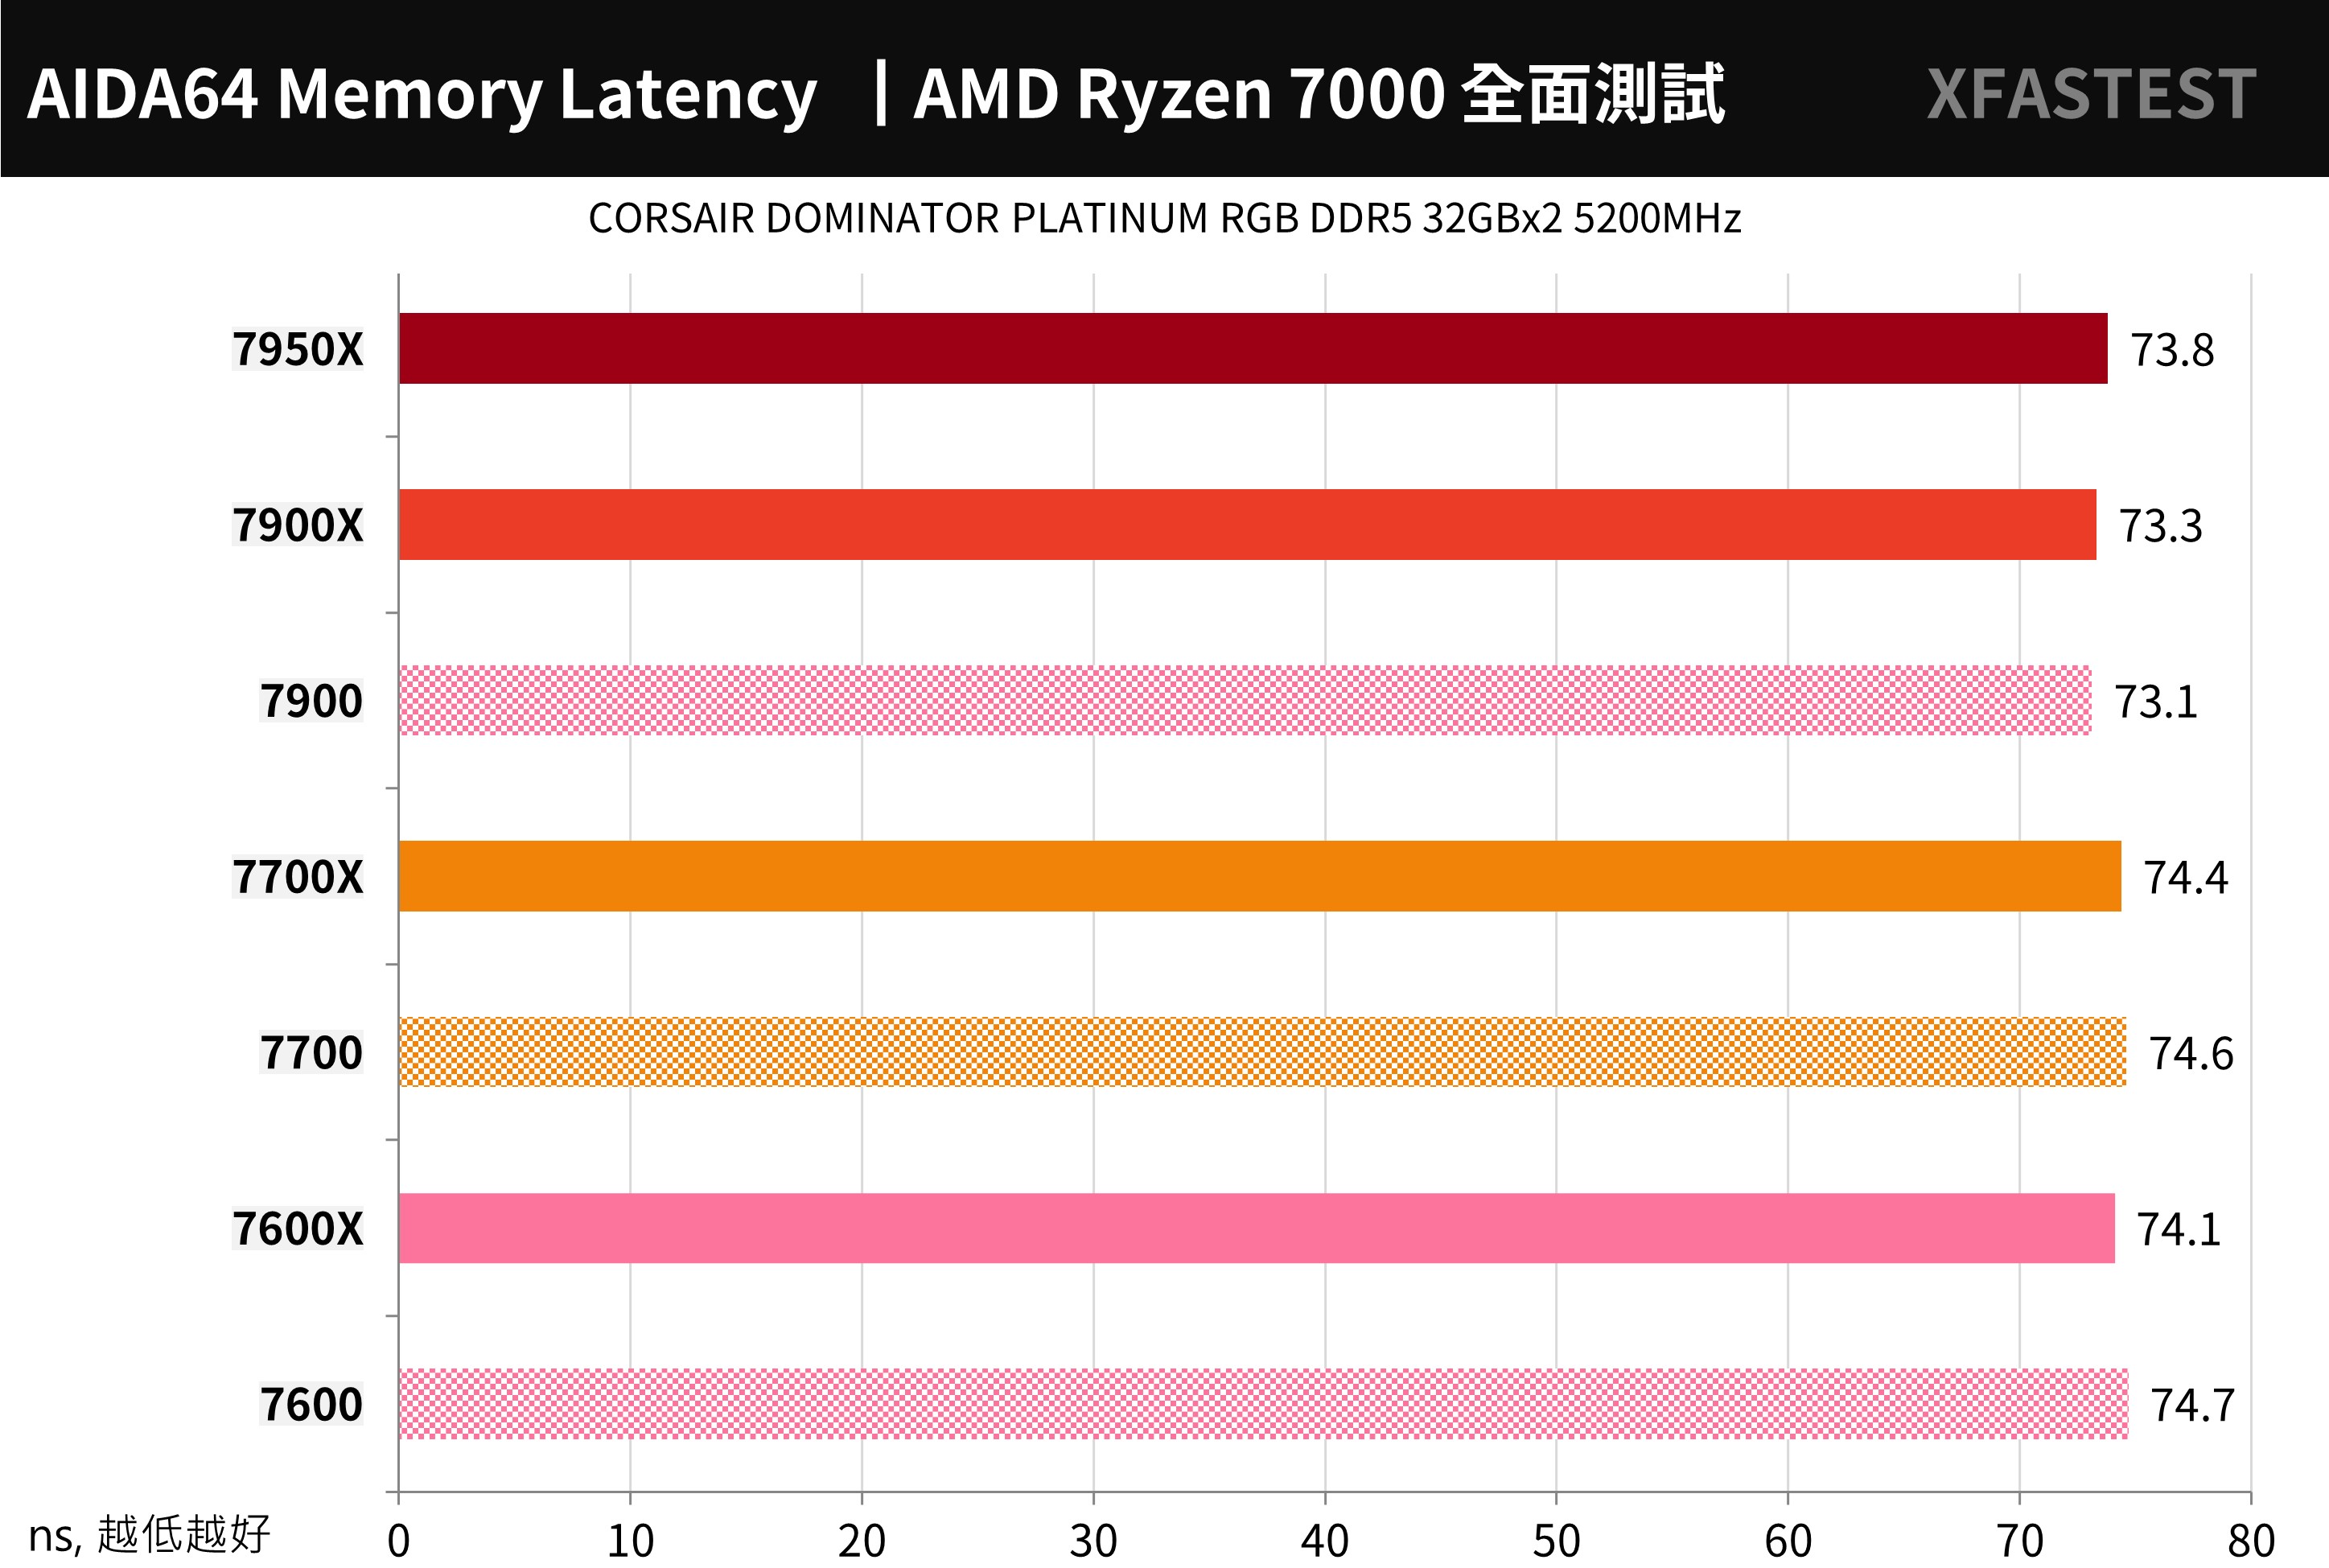
↑ AIDA64 memory test.
WinRAR The most commonly used compression tool, the 7900 has a performance of 48371 KB/s, the 7700 has a performance of 38219 KB/s, and the 7600 has a performance of 31084 KB/s.
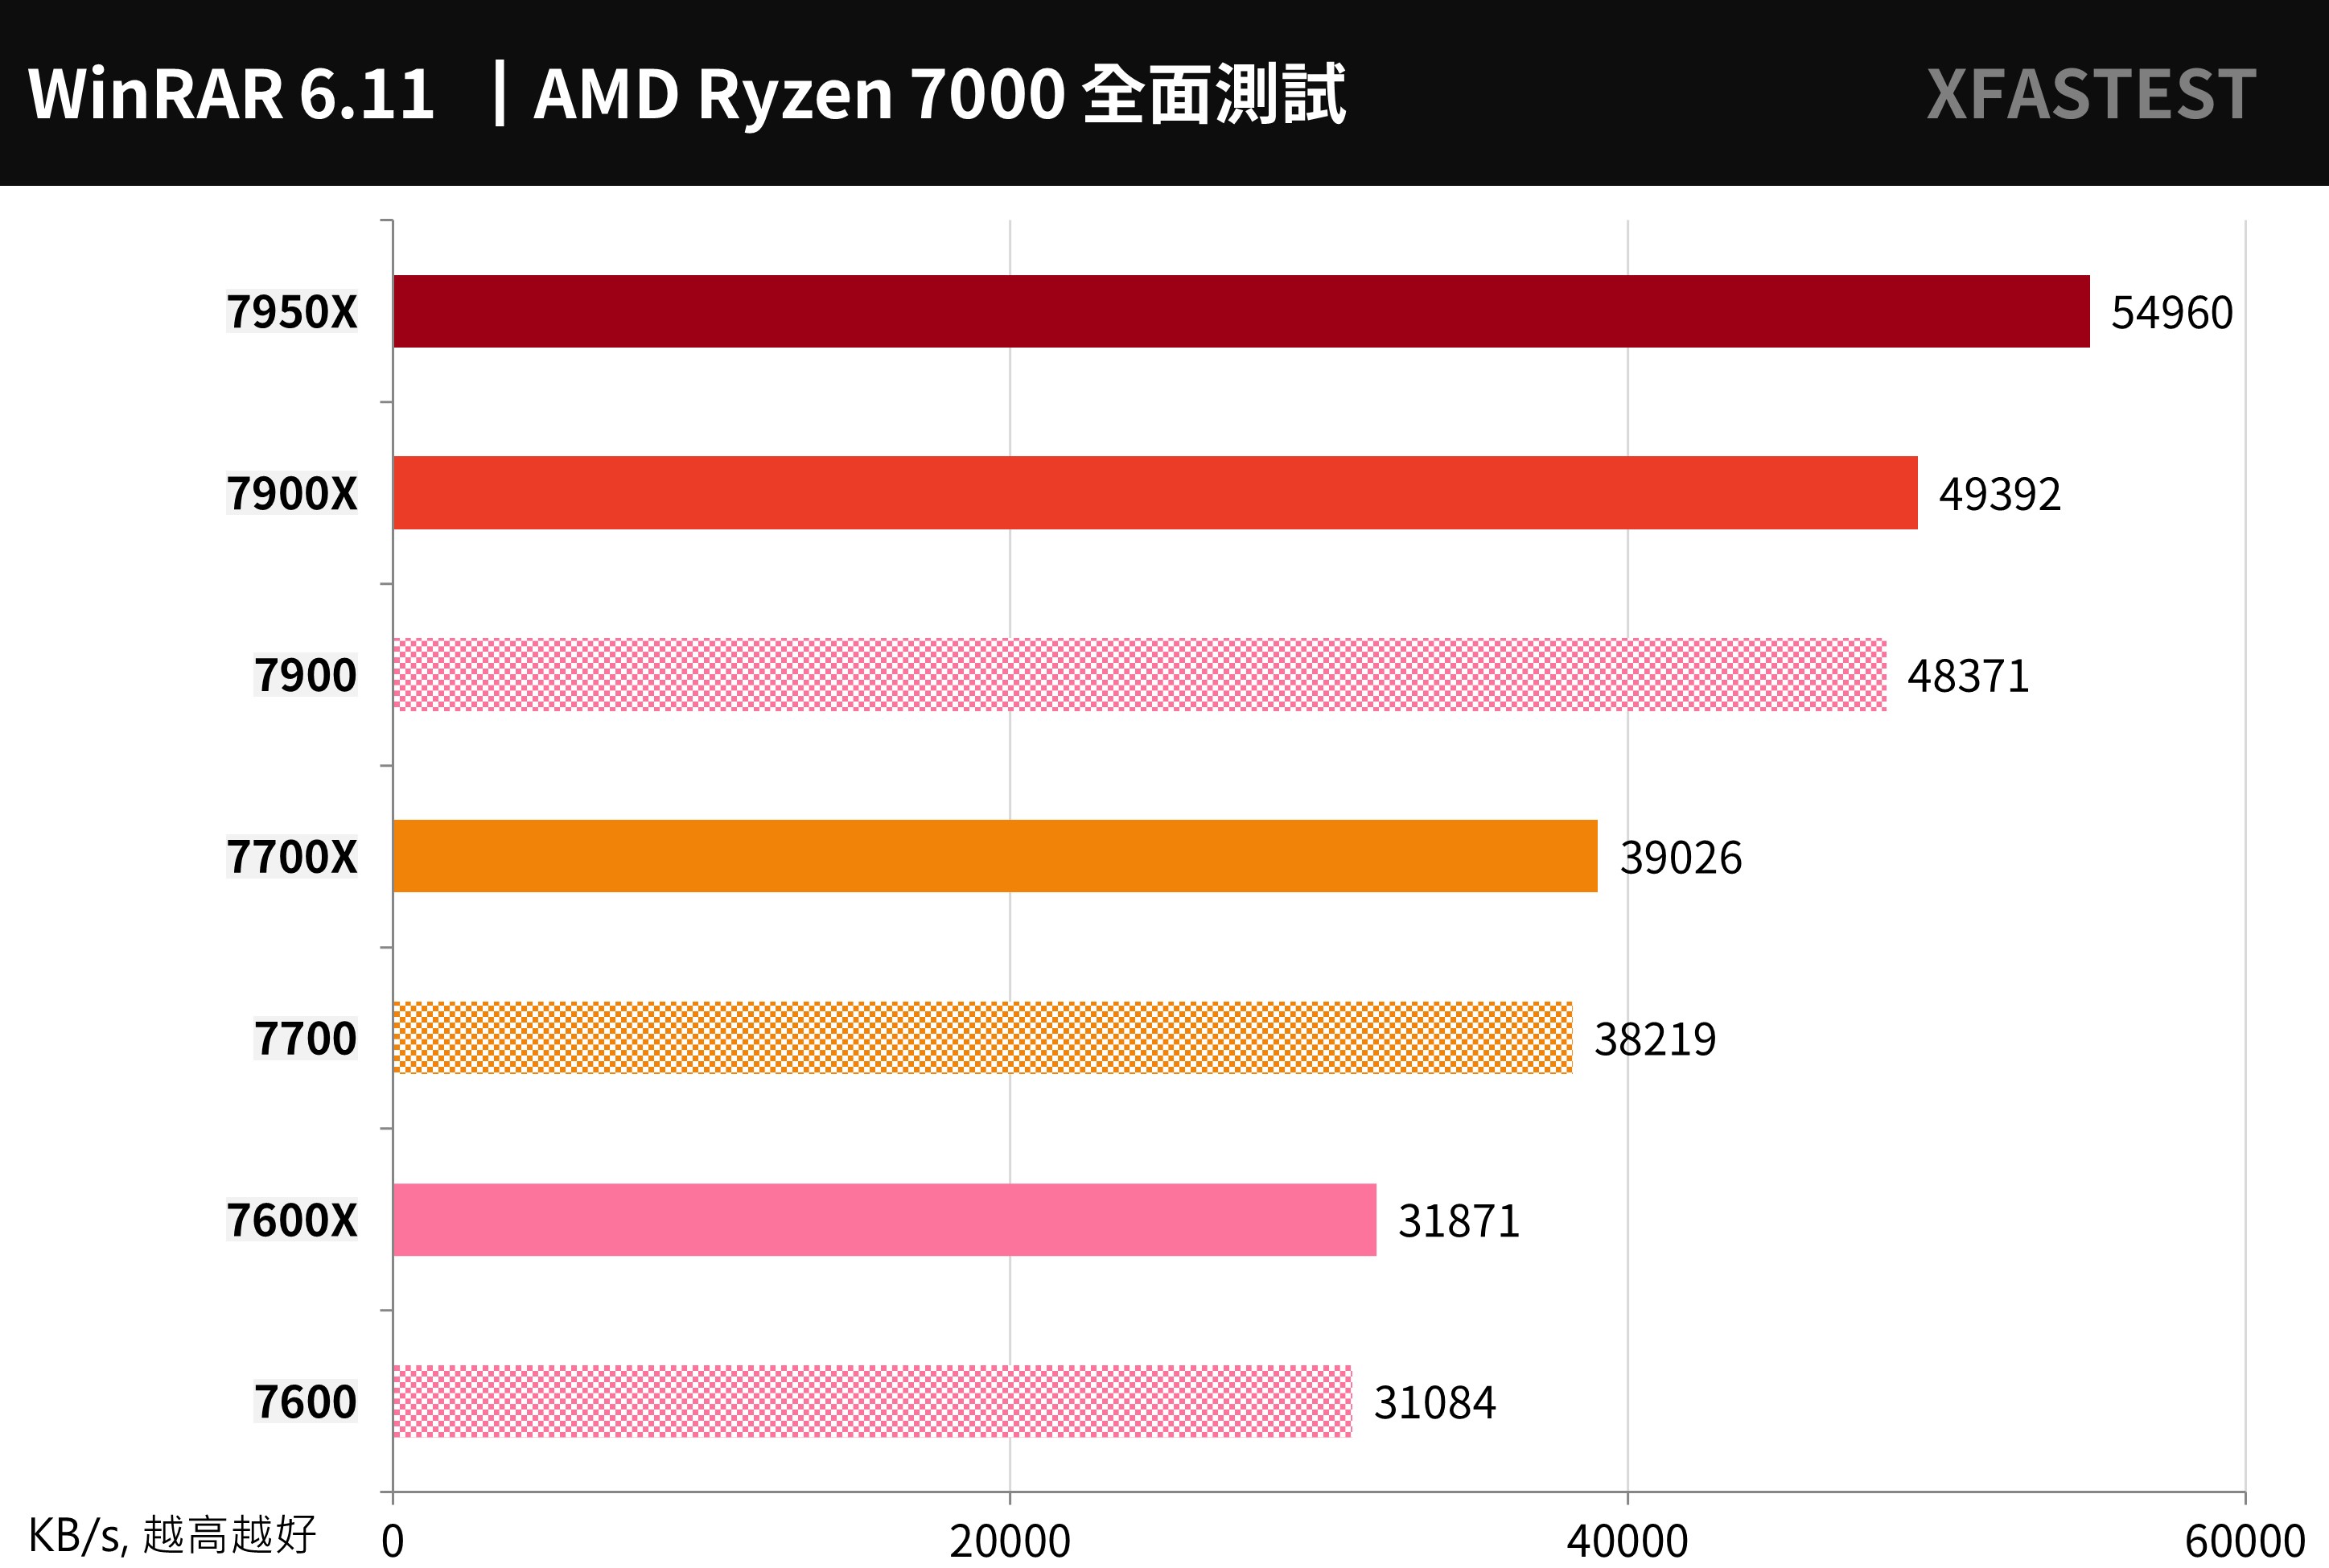
↑ WinRAR, the more performance the better.
7-Zip Another well-known and free compression tool can effectively use multi-core performance, 7900 compression 145.8 GIPS, decompression 179 GIPS; 7700 compression 115.6 GIPS, decompression 128.4 GIPS; 7600 compression 90.2 GIPS, decompression 98.1 GIPS.
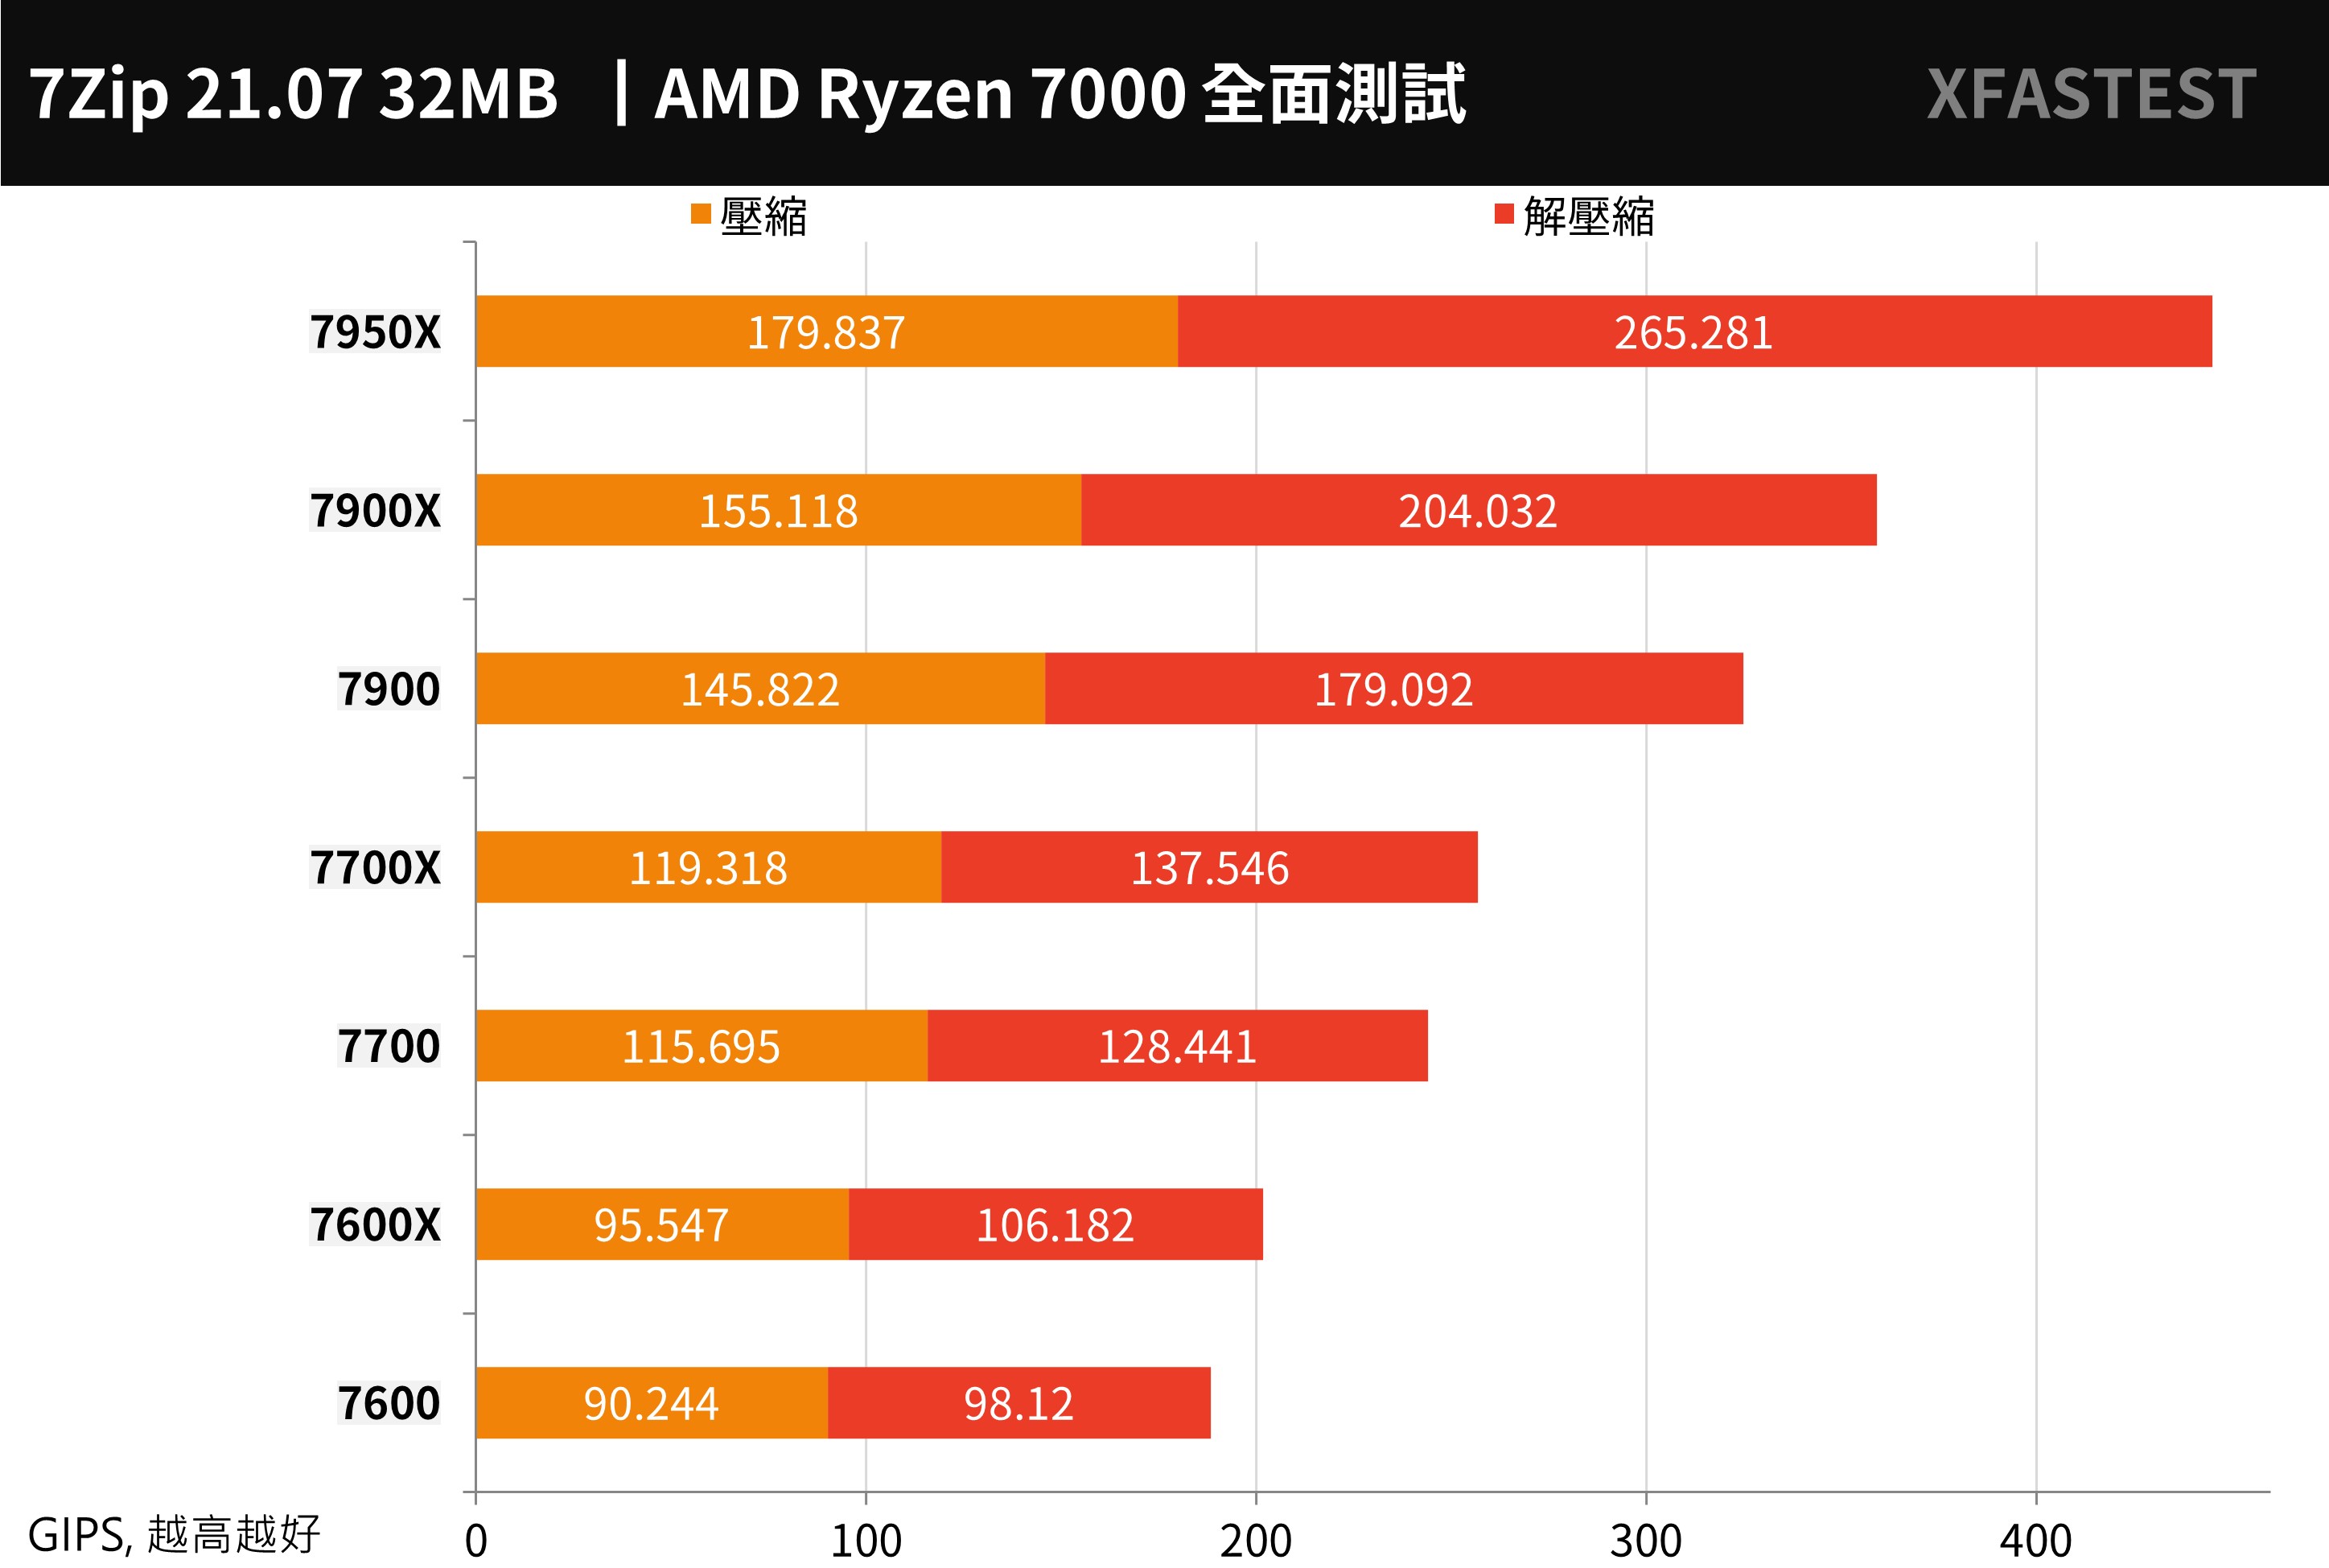
↑ 7Zip, the higher the performance, the better.
PCMark 10, CrossMark and Office PC Benchmarks
The overall performance of the computer is first PCMark 10 For the test, you can score the basic computer work of Essentials, such as App startup speed, video conferencing, and web browsing performance. The Productivity productivity test uses spreadsheets and paperwork as test items. Digital Content Creation video content creation, then Tested on photo/video editing, rendering and visualization.
The score of 7900 is 10286, 7700 is 10283, and 7600 is 9923, all of which can meet the needs of basic document surfing and paperwork. The higher the number of cores, the higher the efficiency of digital content creation will be.
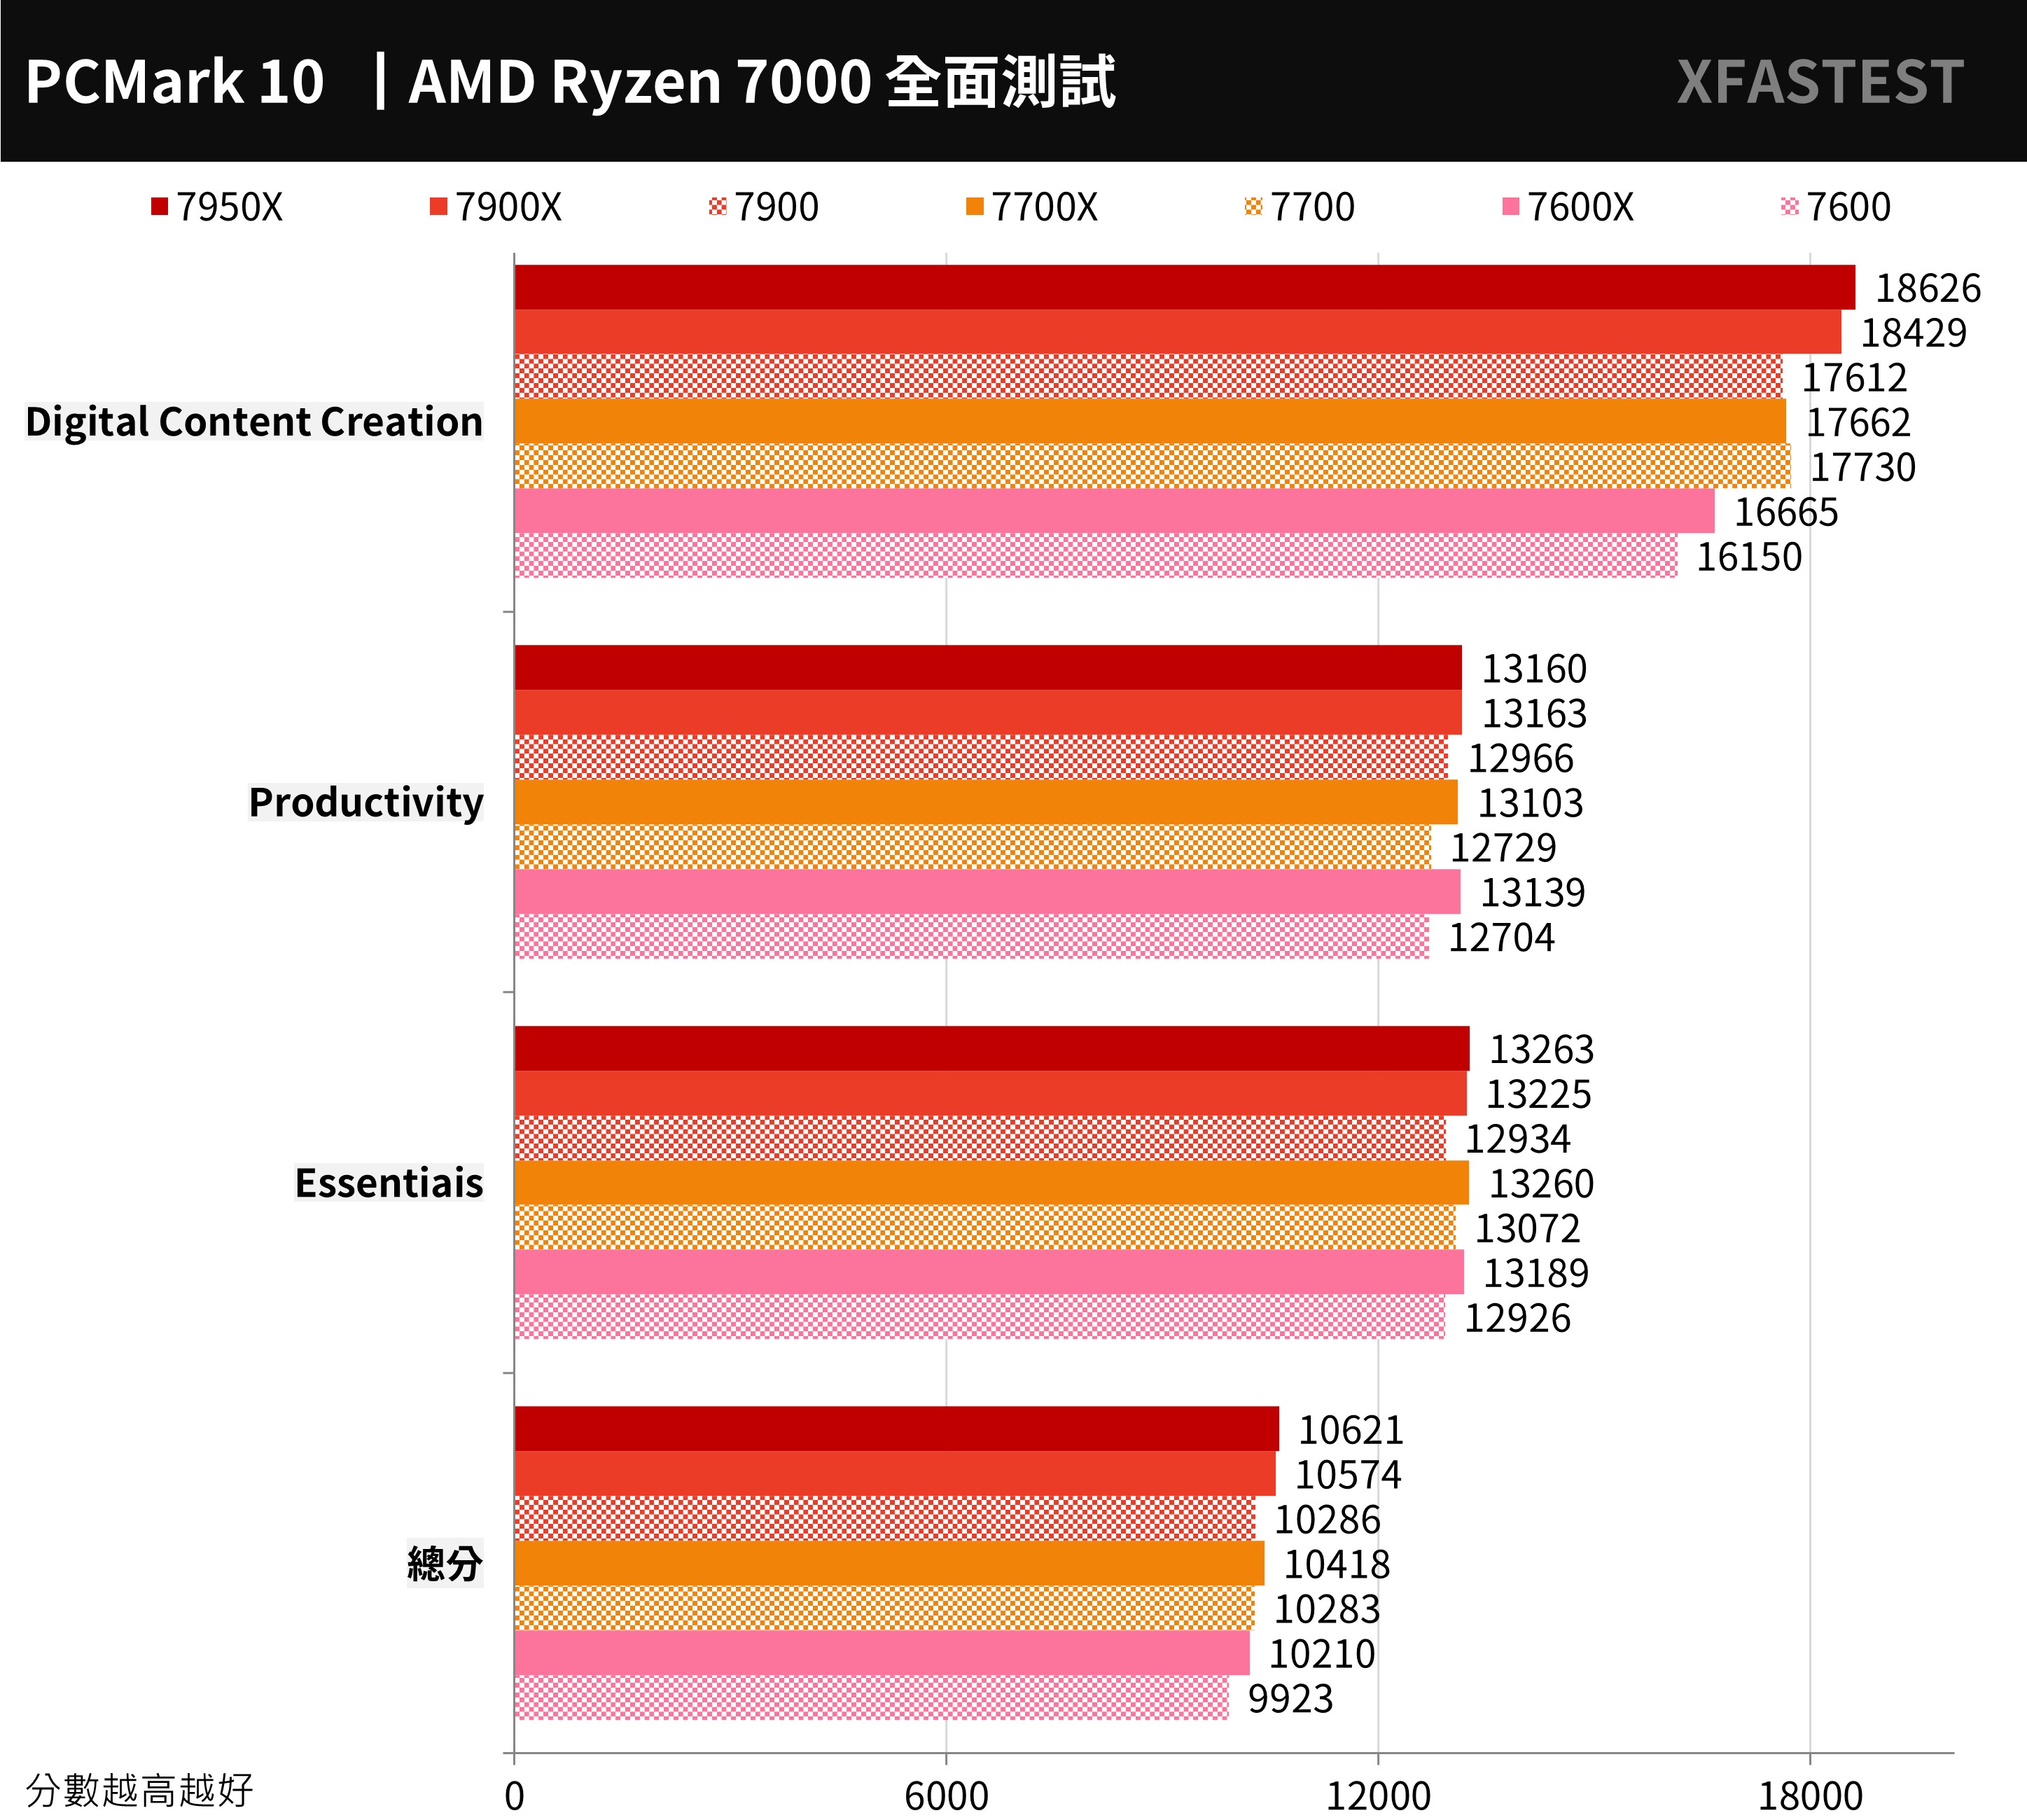
↑ PCMark 10, higher scores are better.
Cross-platform computer performance testing tool CrossMarkis a free test tool developed by BAPCo that supports platforms such as Windows, iOS/iPadOS, macOS, and Android, and is aimed at computer productivity, such as text editing, spreadsheets, web browsing, and creative photo editing, organizing, and Video editing and other work, plus computer response speed for testing.
7900 reached 2107 points, 7700 scored 2135 points, and 7600 scored 1985 points. This test added the test item of computer response, so when the CPU clock rate is higher, the overall performance will also improve a lot.
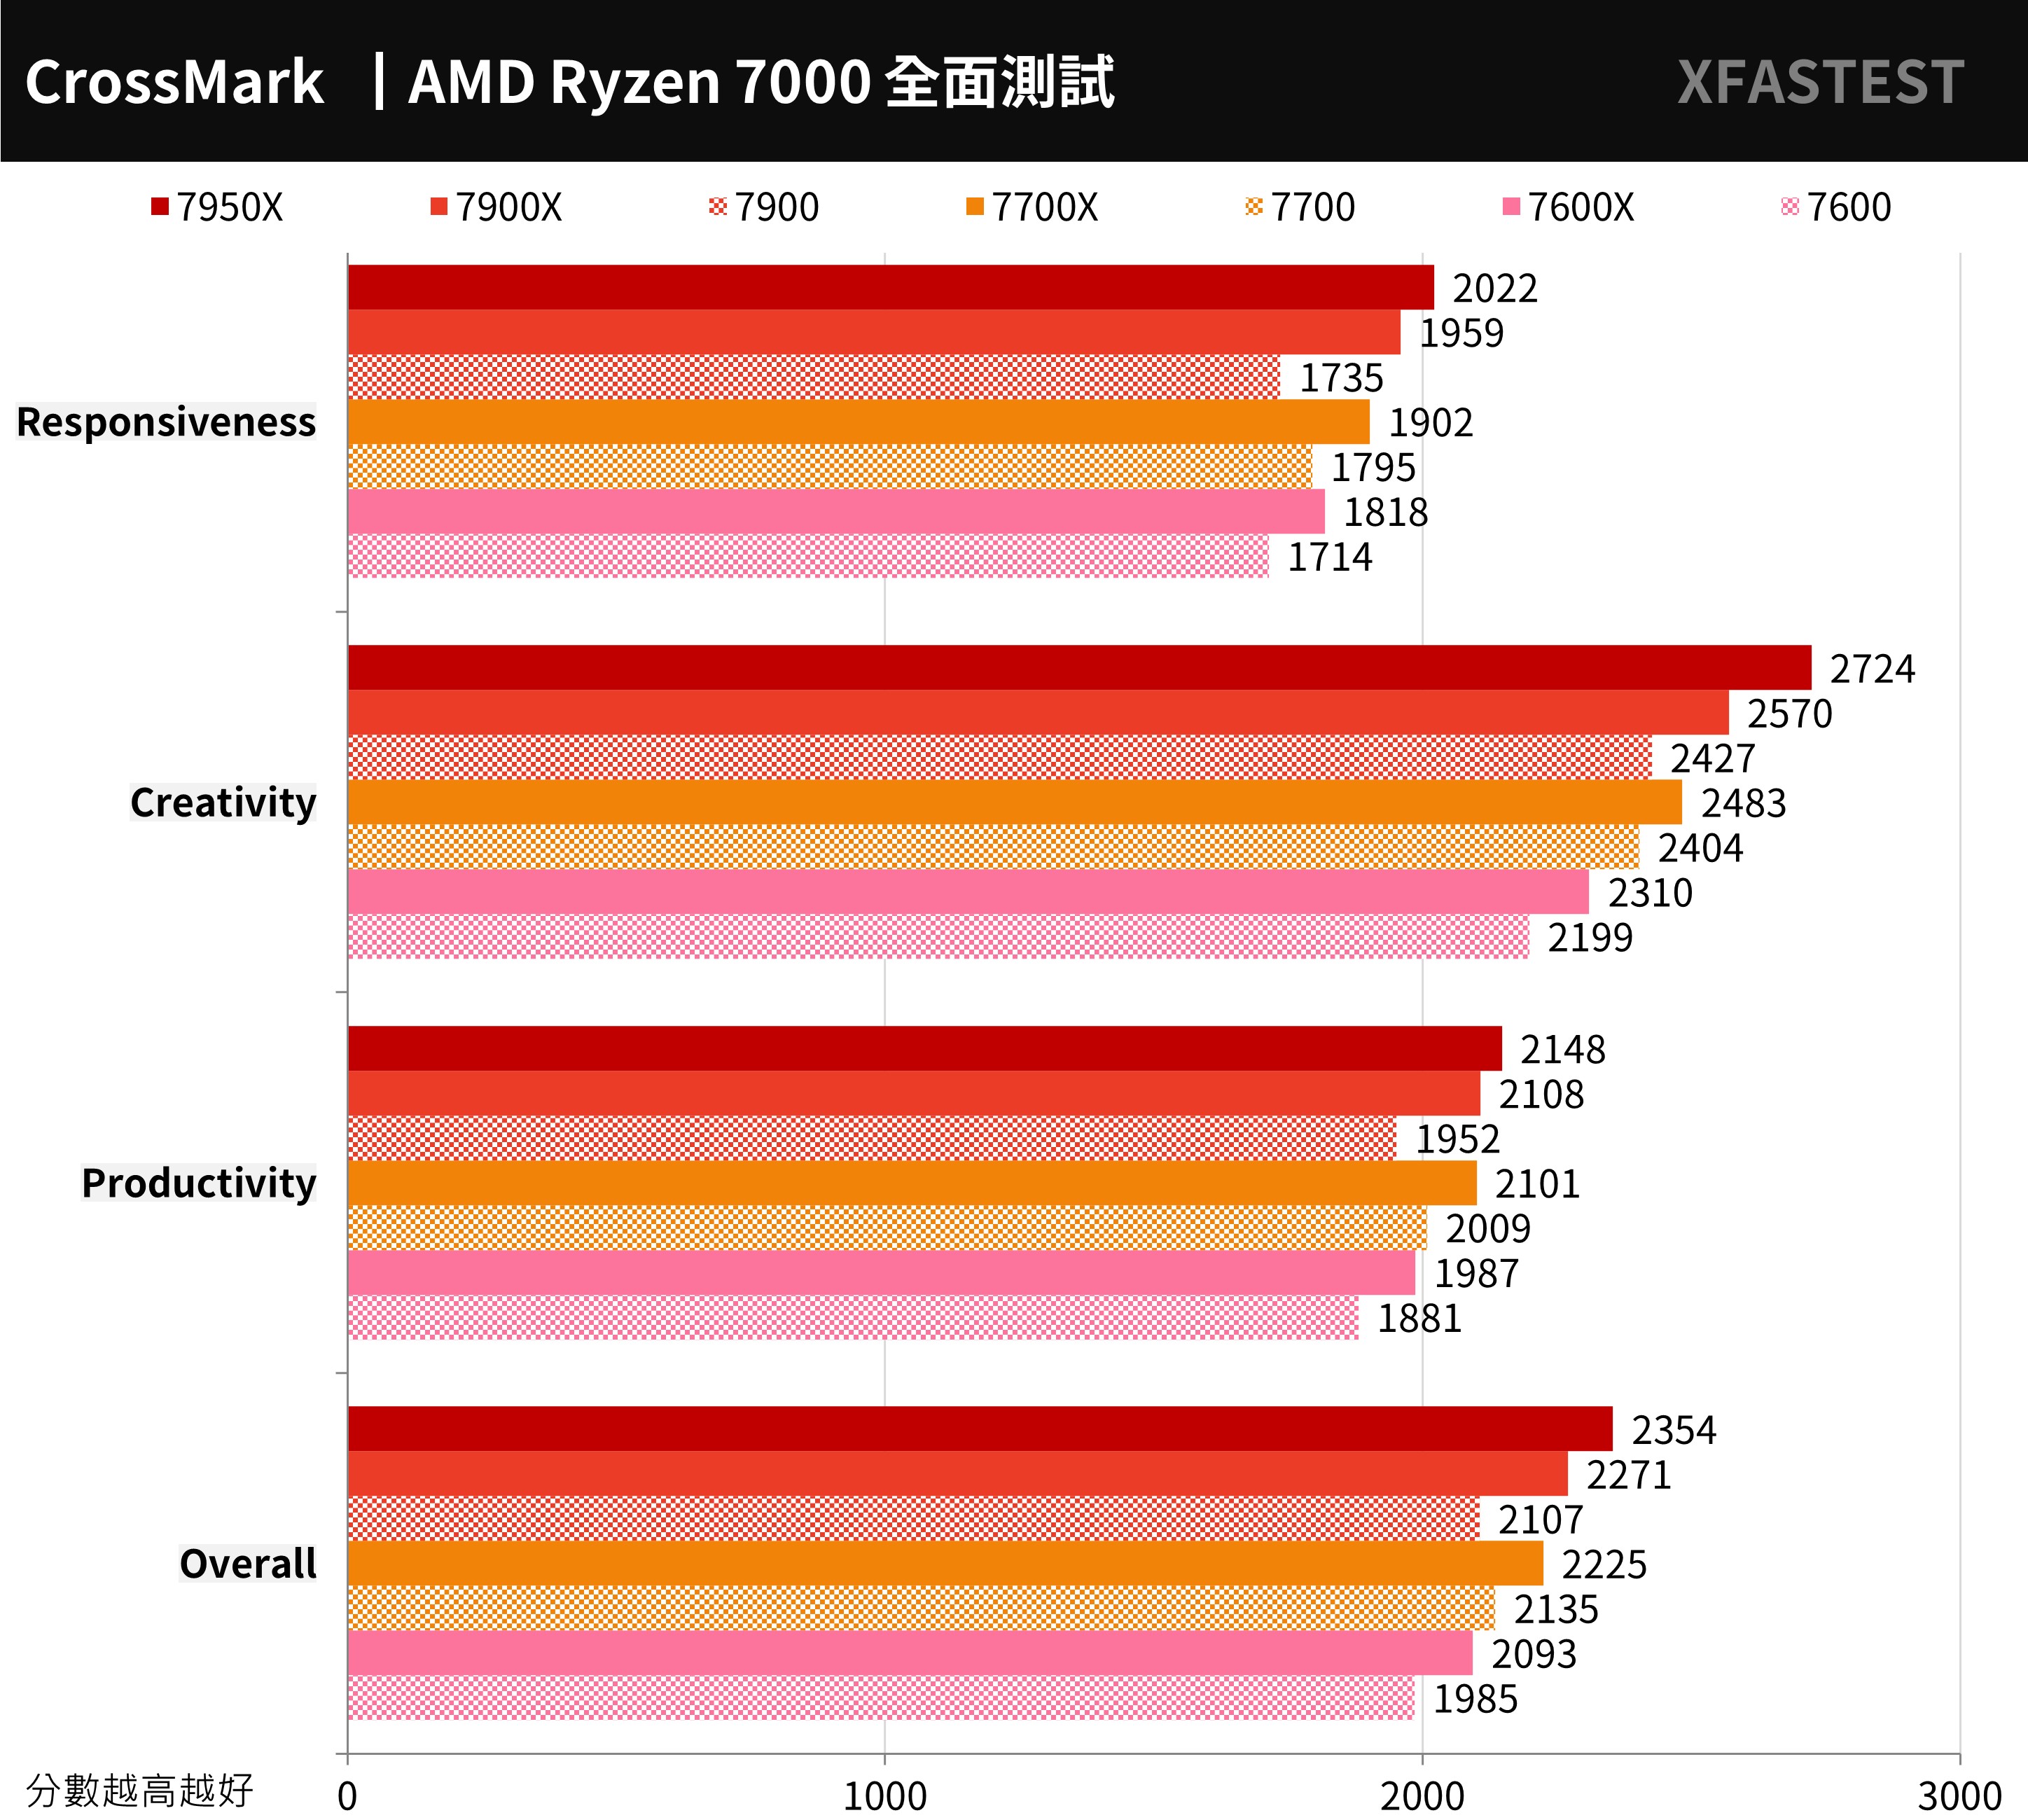
↑ CrossMark, the higher the score, the better.
UL Procyon The office productivity benchmark test uses Microsoft Word, Excel, PowerPoint and Outlook to test the practical and real performance of Windows computers in daily work, and uses common paperwork to design test situations, from document opening, copying, input, and spreadsheet Calculation, sorting, exporting, adding files, image files, videos, and sending and receiving emails to presentations.
The 7900 scored 7784 points, the 7700 scored 7810 points, and the 7600 scored 7485 points. The paperwork performance difference is not obvious for general use, but CPUs with higher clocks also have higher scores.
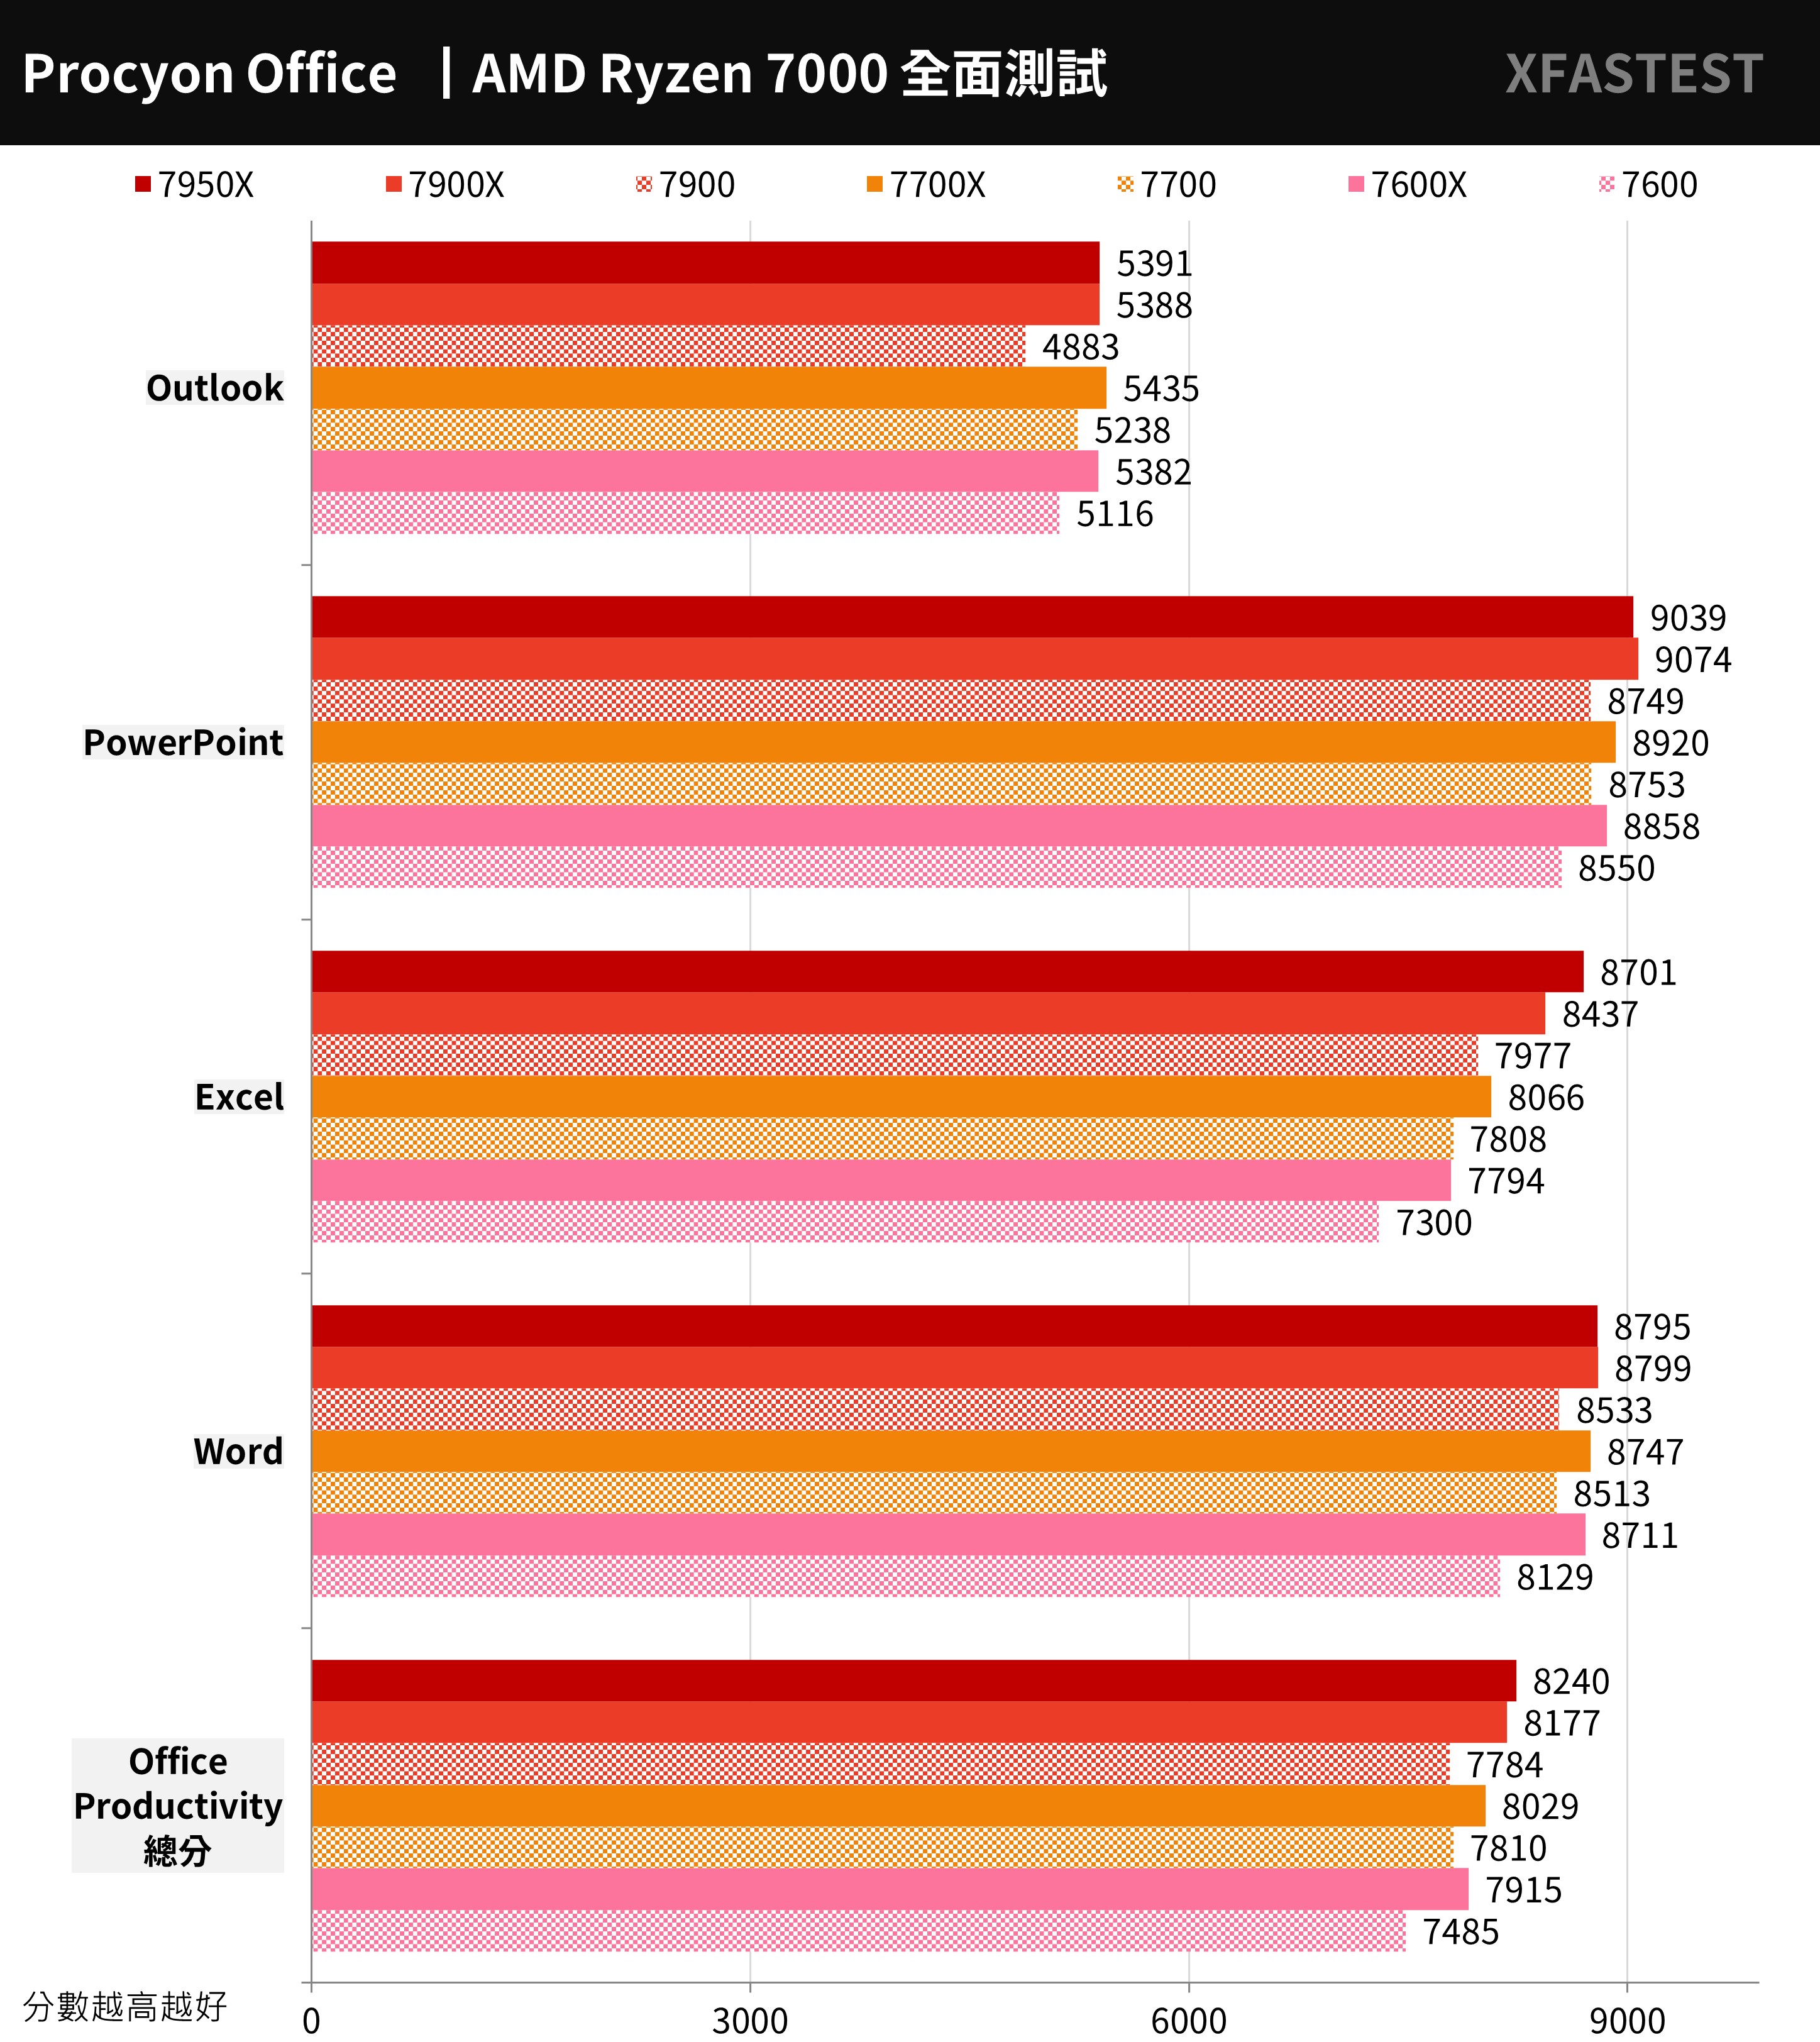
↑ UL Procyon, the higher the score the better.
3DMark CPU performance and FS, TS benchmark test
Computer graphics game performance testing tool 3DMarkthe mainstream Direct X11 test Fire Strike and Direct X12 Time Spy test.
From the performance point of view, in the Fire Strike Physics project, it is the core, and the higher the clock speed, the higher the score, but the total score is relatively higher than that of 7700 and 7700X. It can be seen that the overall performance of DX11 has no advantage after more than 8 cores; as for DX12’s Time Spy results are relatively in line with expectations, that is, the CPU has little difference in game performance, but high-end CPUs can definitely have better performance.
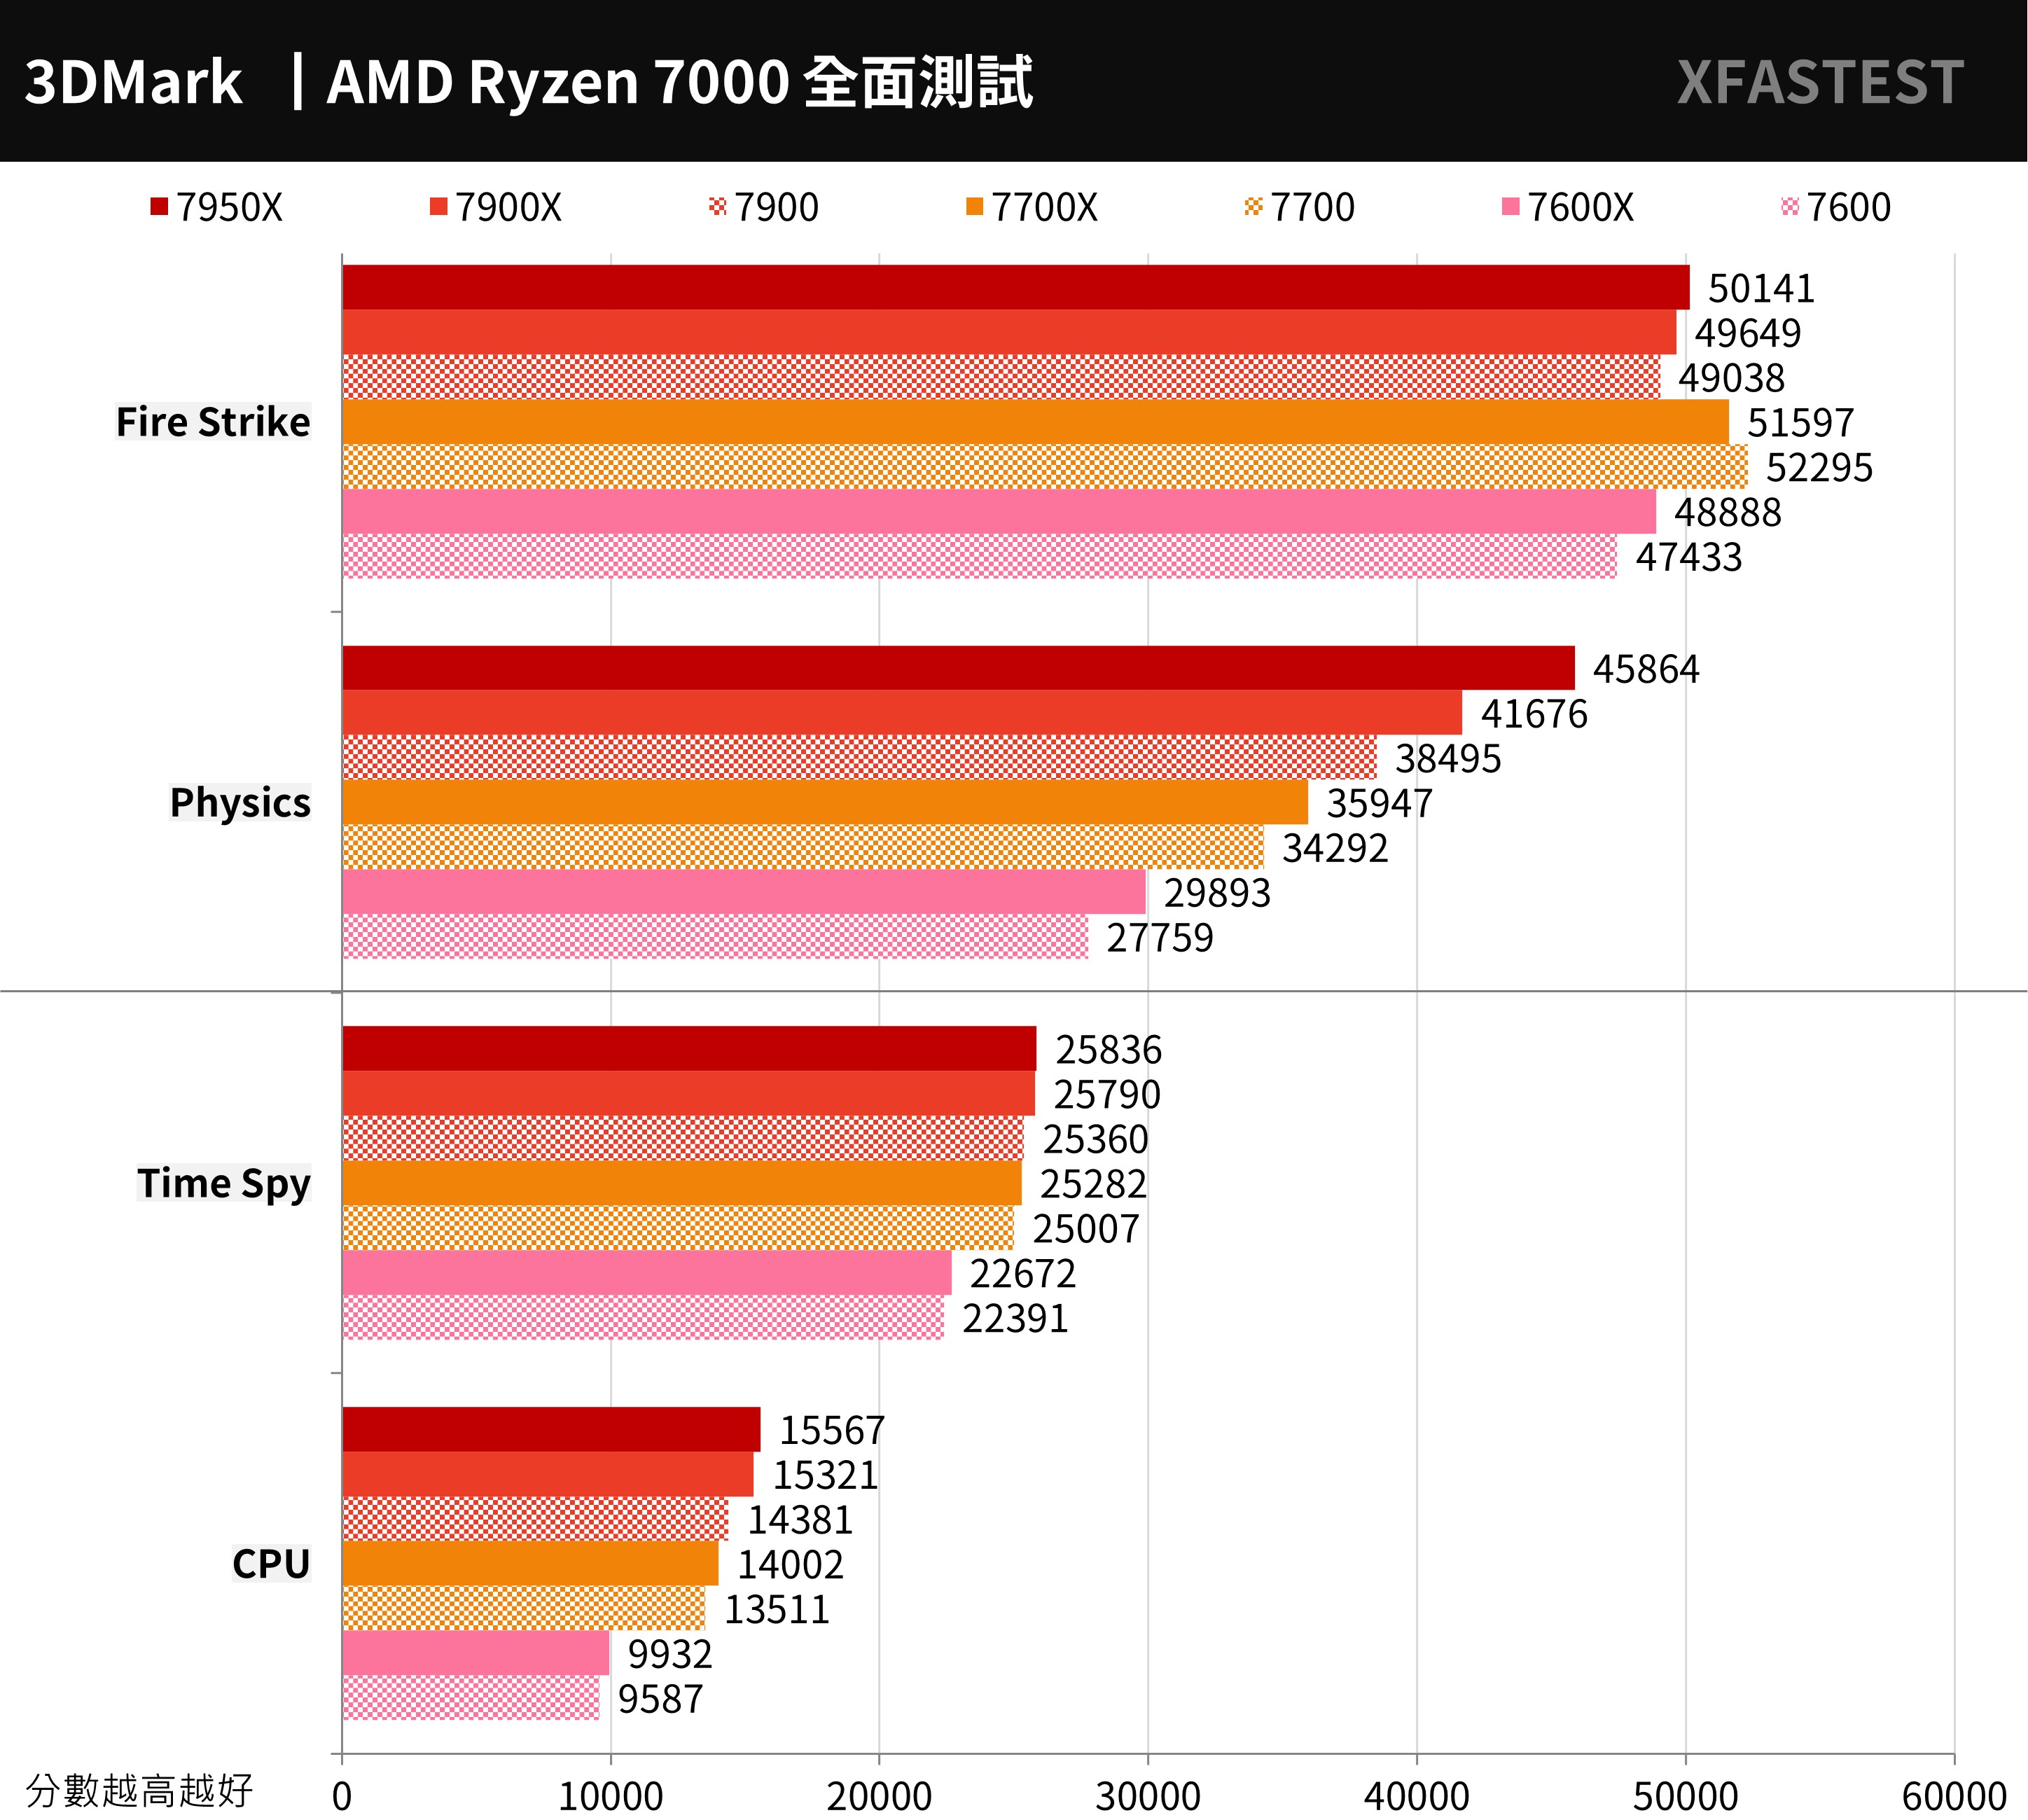
↑ 3DMark, the higher the score, the better.
3DMark CPU The test mainly tests the physical operation and custom simulation of the CPU, and tests the performance of 1, 2, 4, 8, 16 and the maximum execution threads of the processor respectively, and the performance above 16 execution threads will belong to 3D rendering, Audio and video output will be used. Generally, Direct X12 games prefer 8T execution threads, while the following execution threads are the preferences of old games.
The performance of the processors in the 1T-4T test is quite close, but the performance gap begins to widen at 8T, and the processor performance above 7900 can be seen at 16T and above.
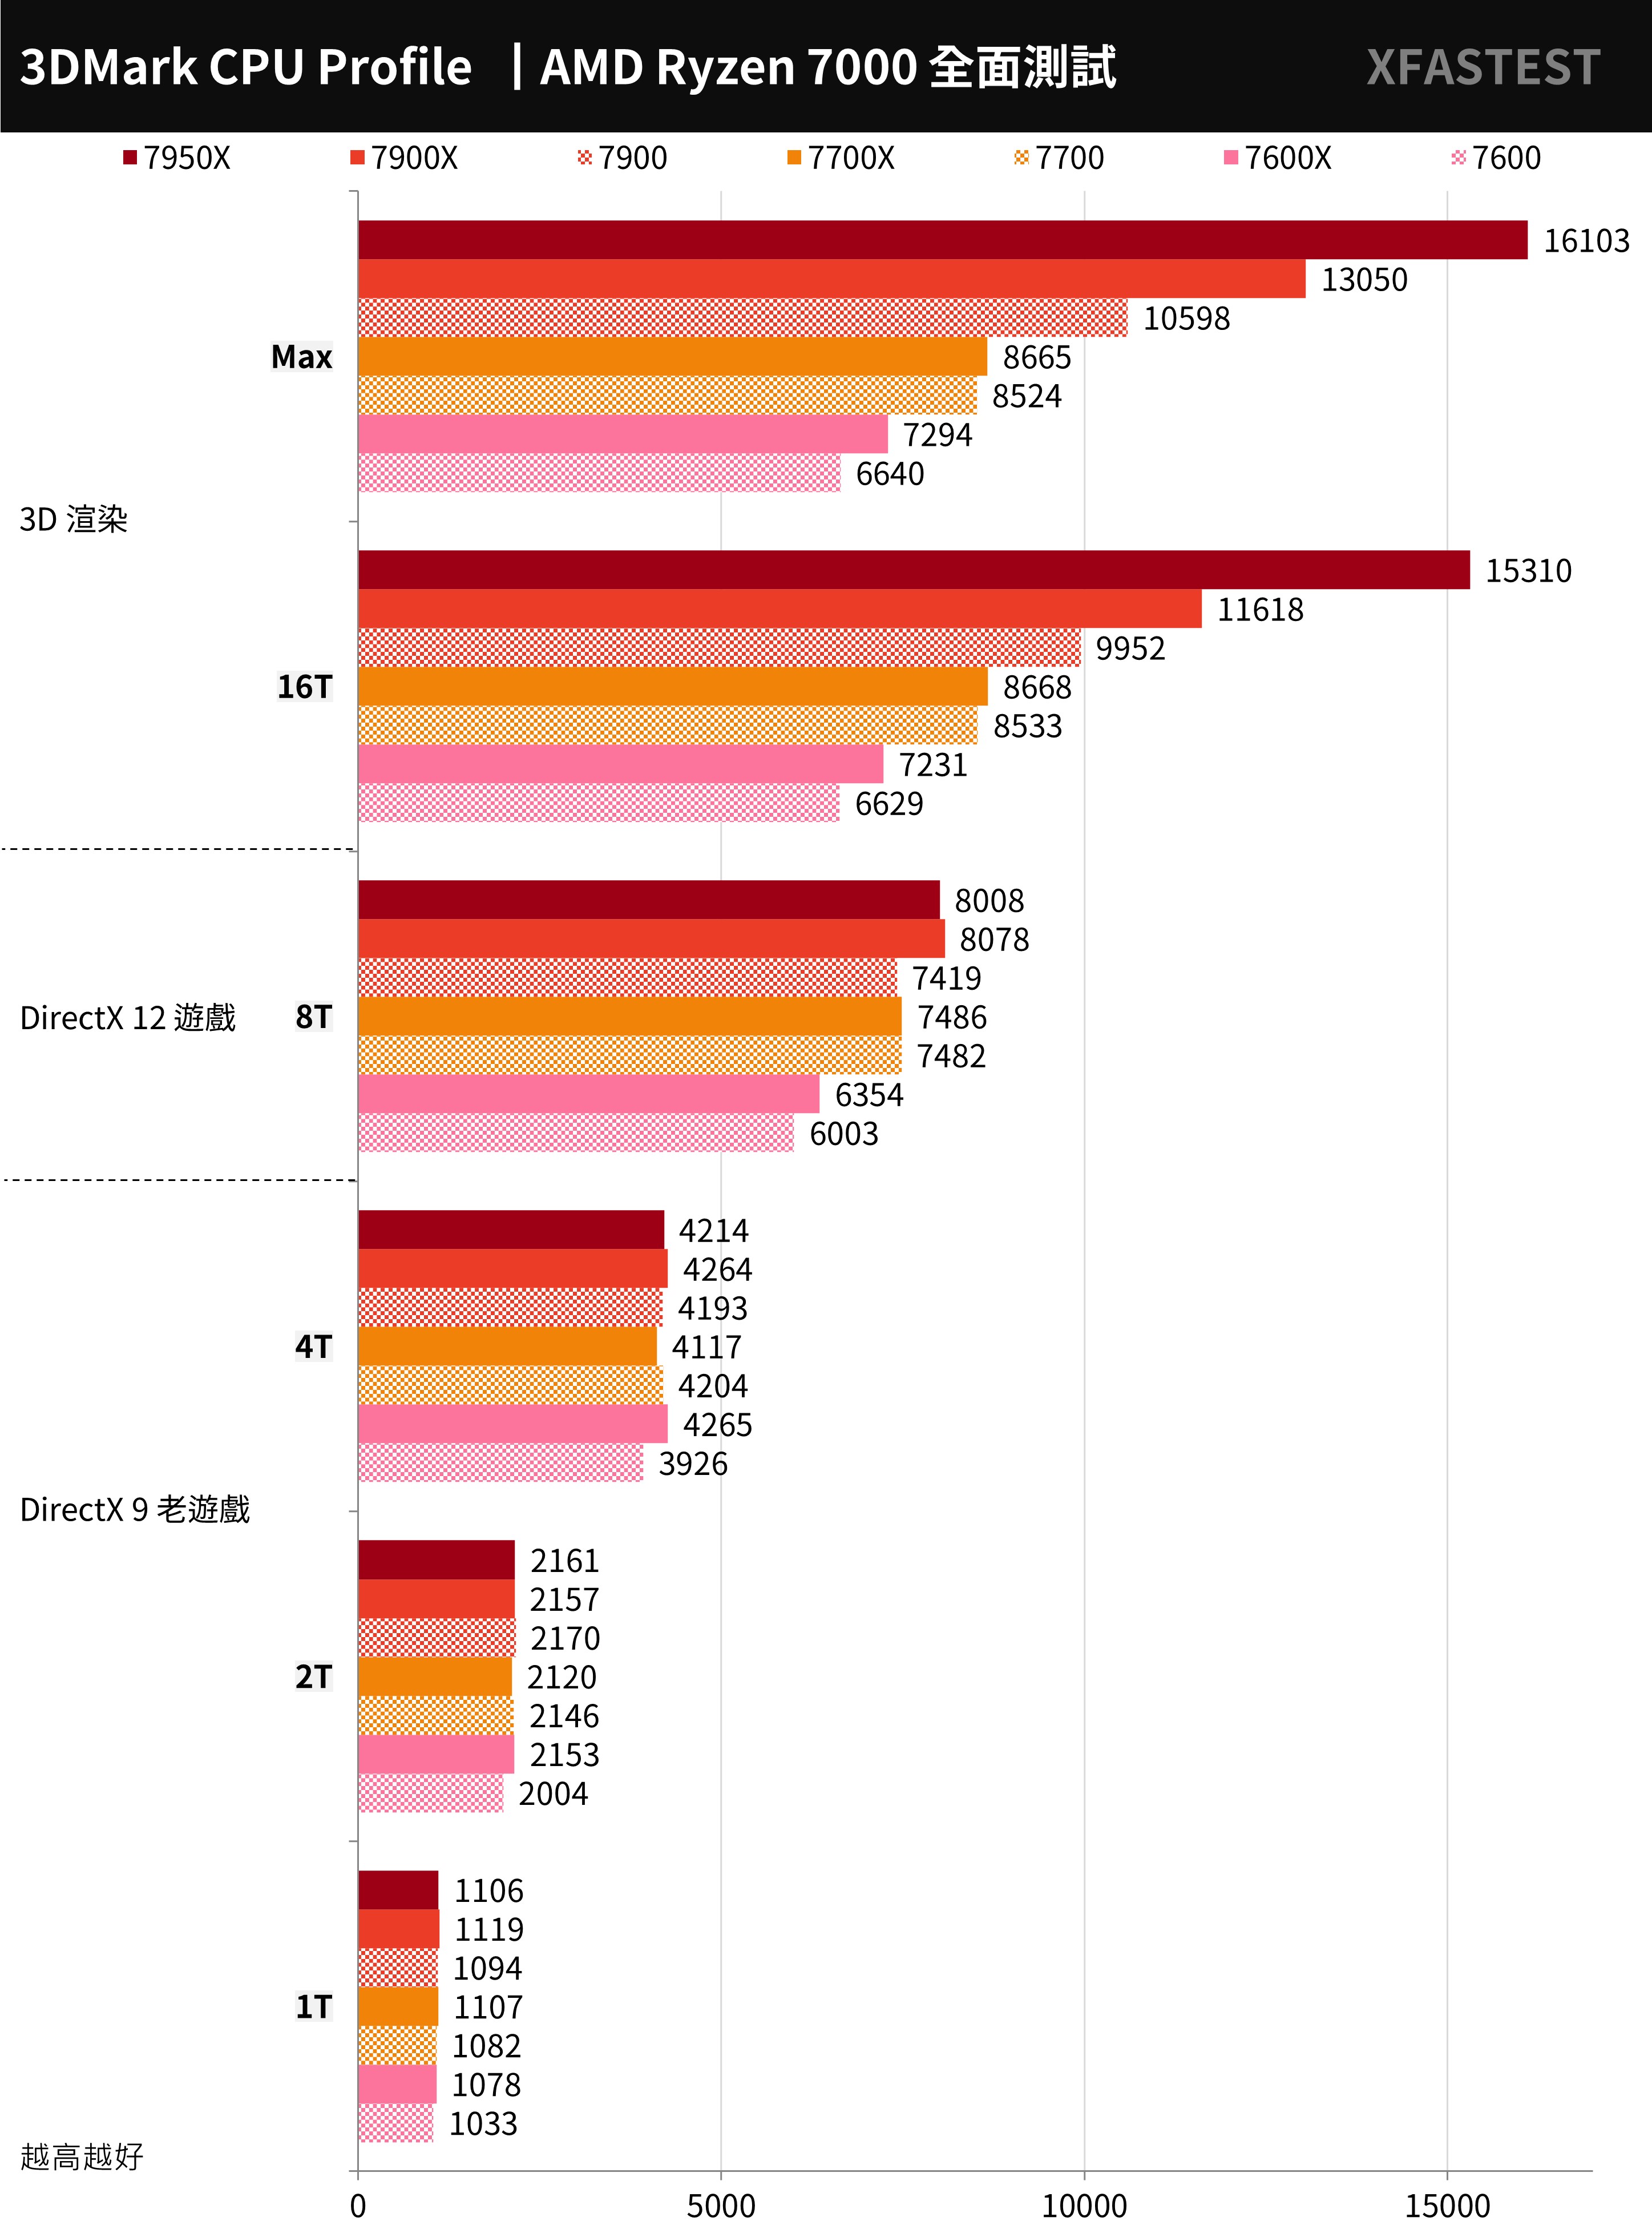
↑ 3DMark CPU, the higher the score, the better.
9+2 AAA e-sports games for processor performance test
9 AAA game performance tests, respectively the entry-level “F1® 22”, “Forza Horizon 5” racing game, the adventurous “Tomb Raider: Shadow”, “Horizon: Waiting for Dawn”, and the performance-heavy “Blue Blood” Wild Kill 2, Assassin’s Creed: Viking Era, and games such as “Polar Trench 6”, “Marvel Interstellar Attack Team” and “Device 2077” that support ray pursuit.
The tests were all performed on the In Game Benchmark test with 1080p resolution and the game’s highest default settings.
Among the 9 games, the 7900 achieved an average of 180.1 FPS, the 7700 achieved an average of 178.5 FPS, and the 7600 achieved an average of 174.3 FPS; the difference in game performance was only about 1%.
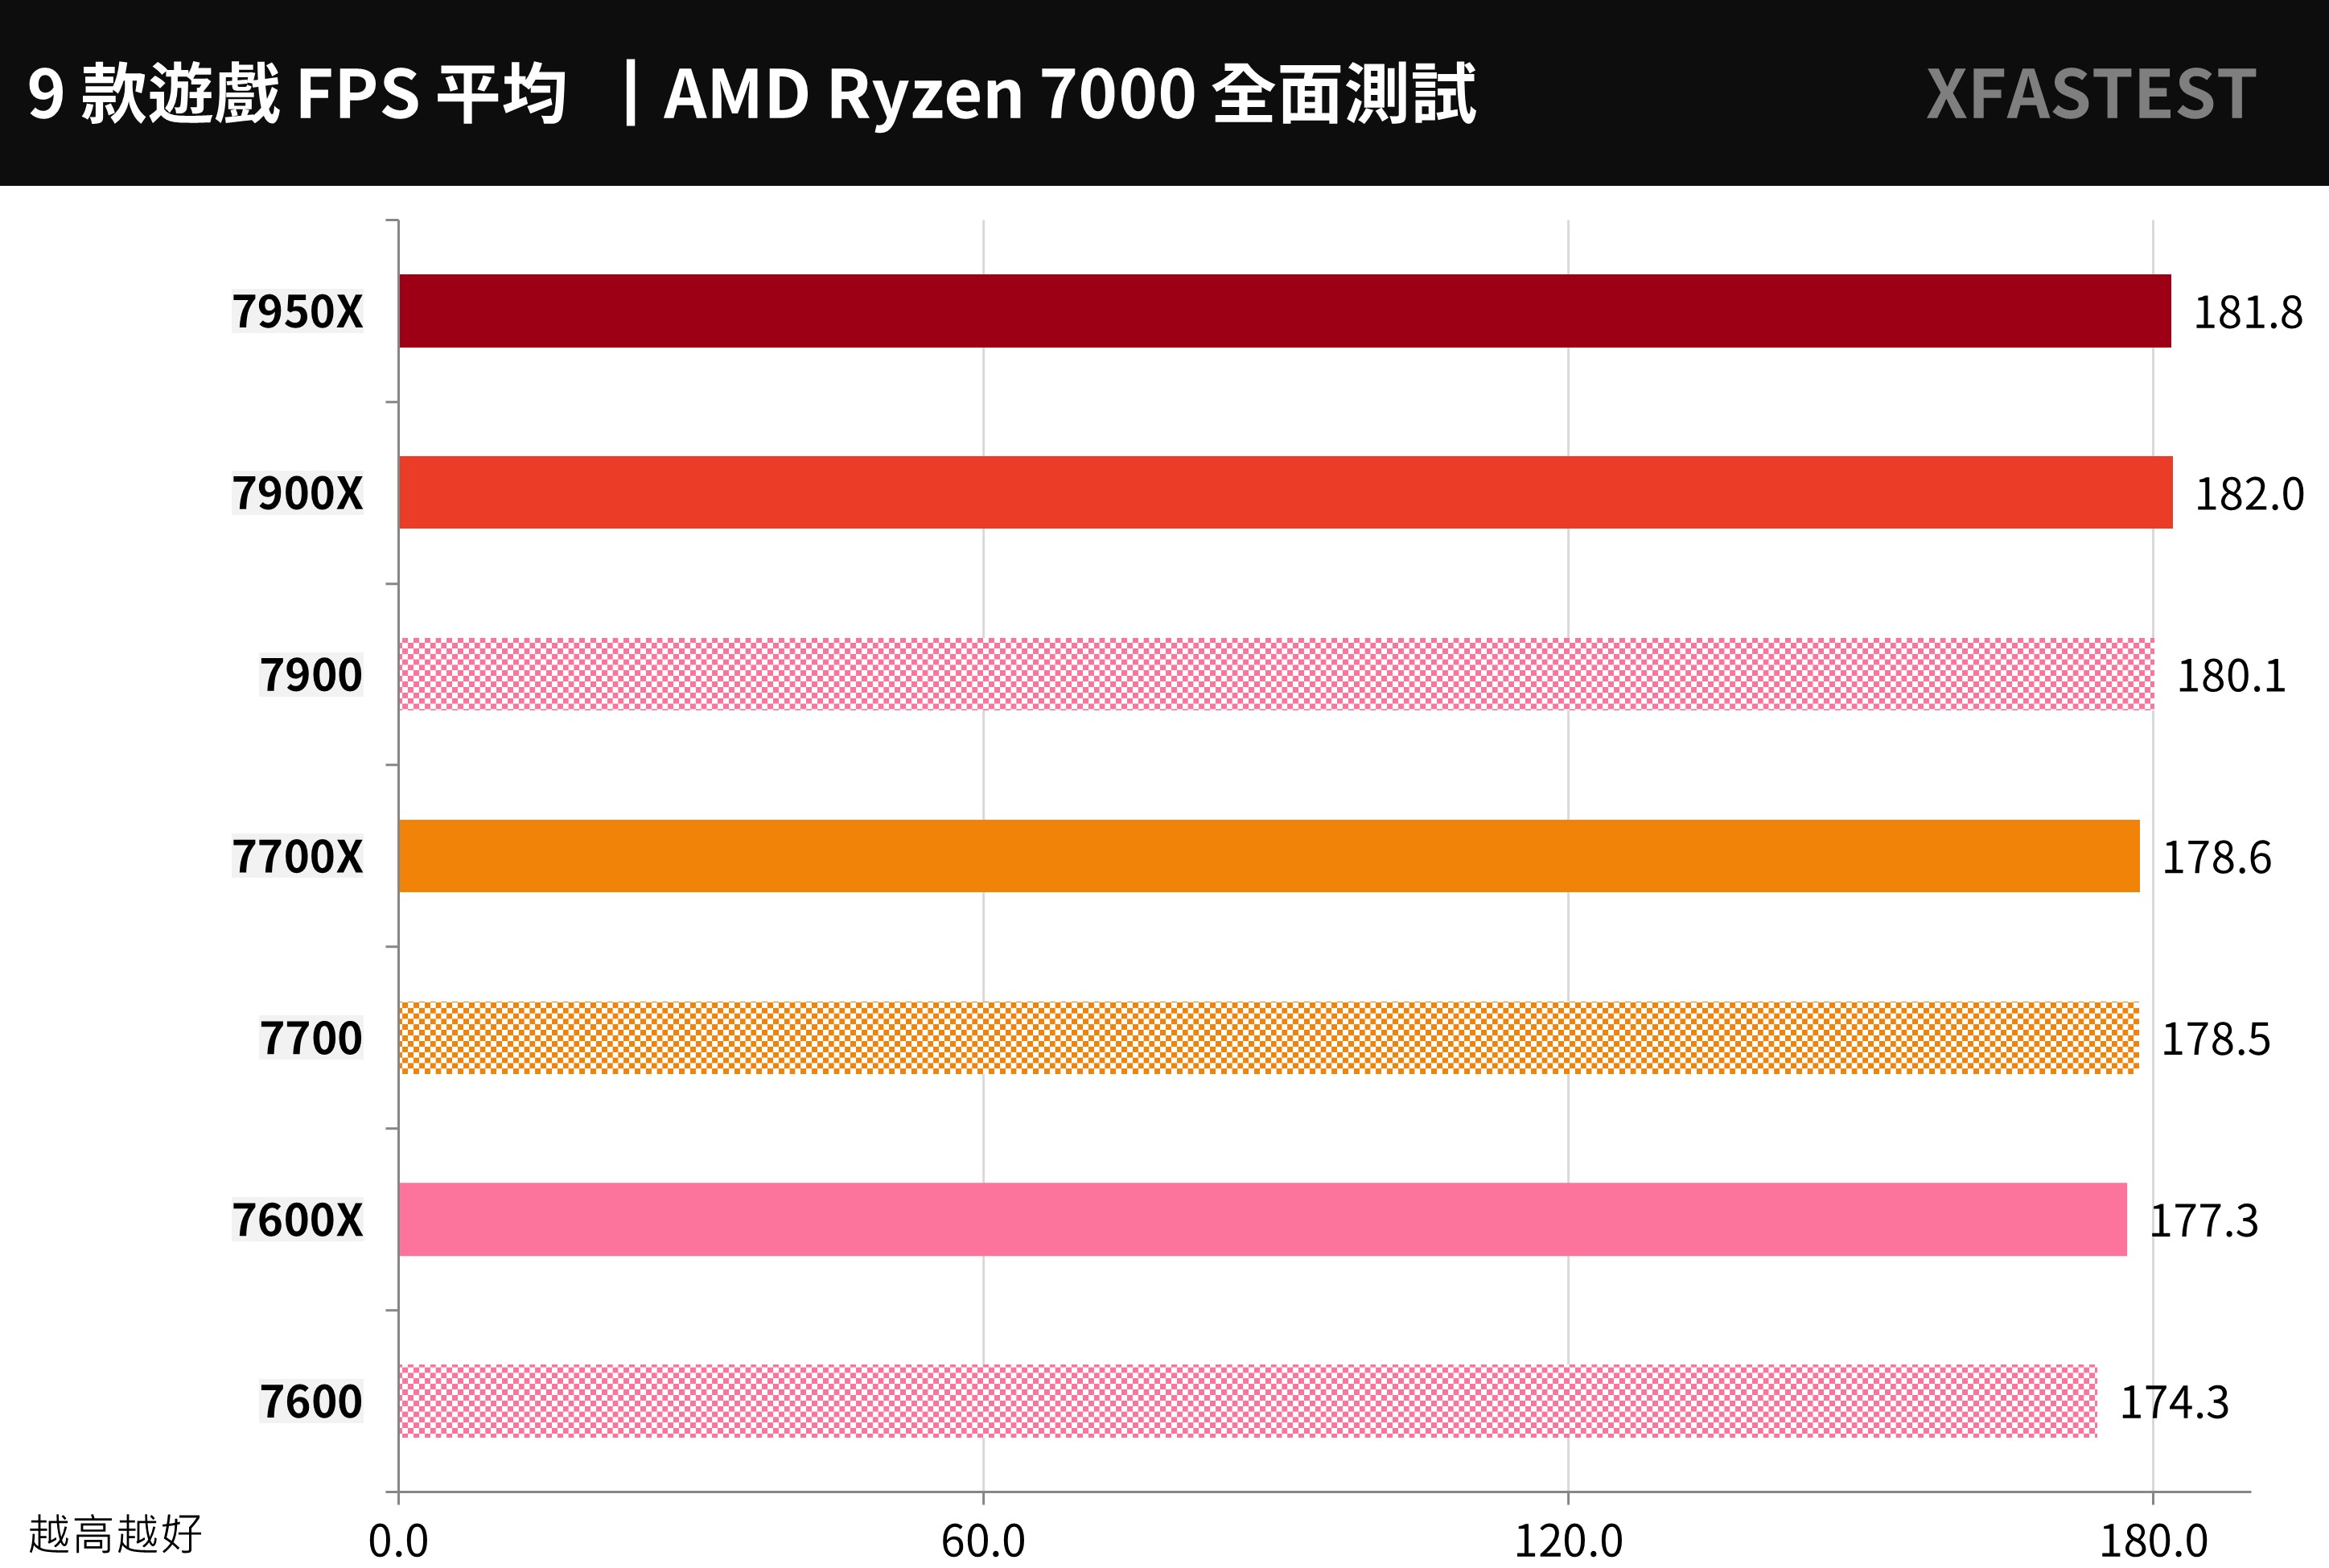
↑ The higher the average FPS of the 9 games, the better.
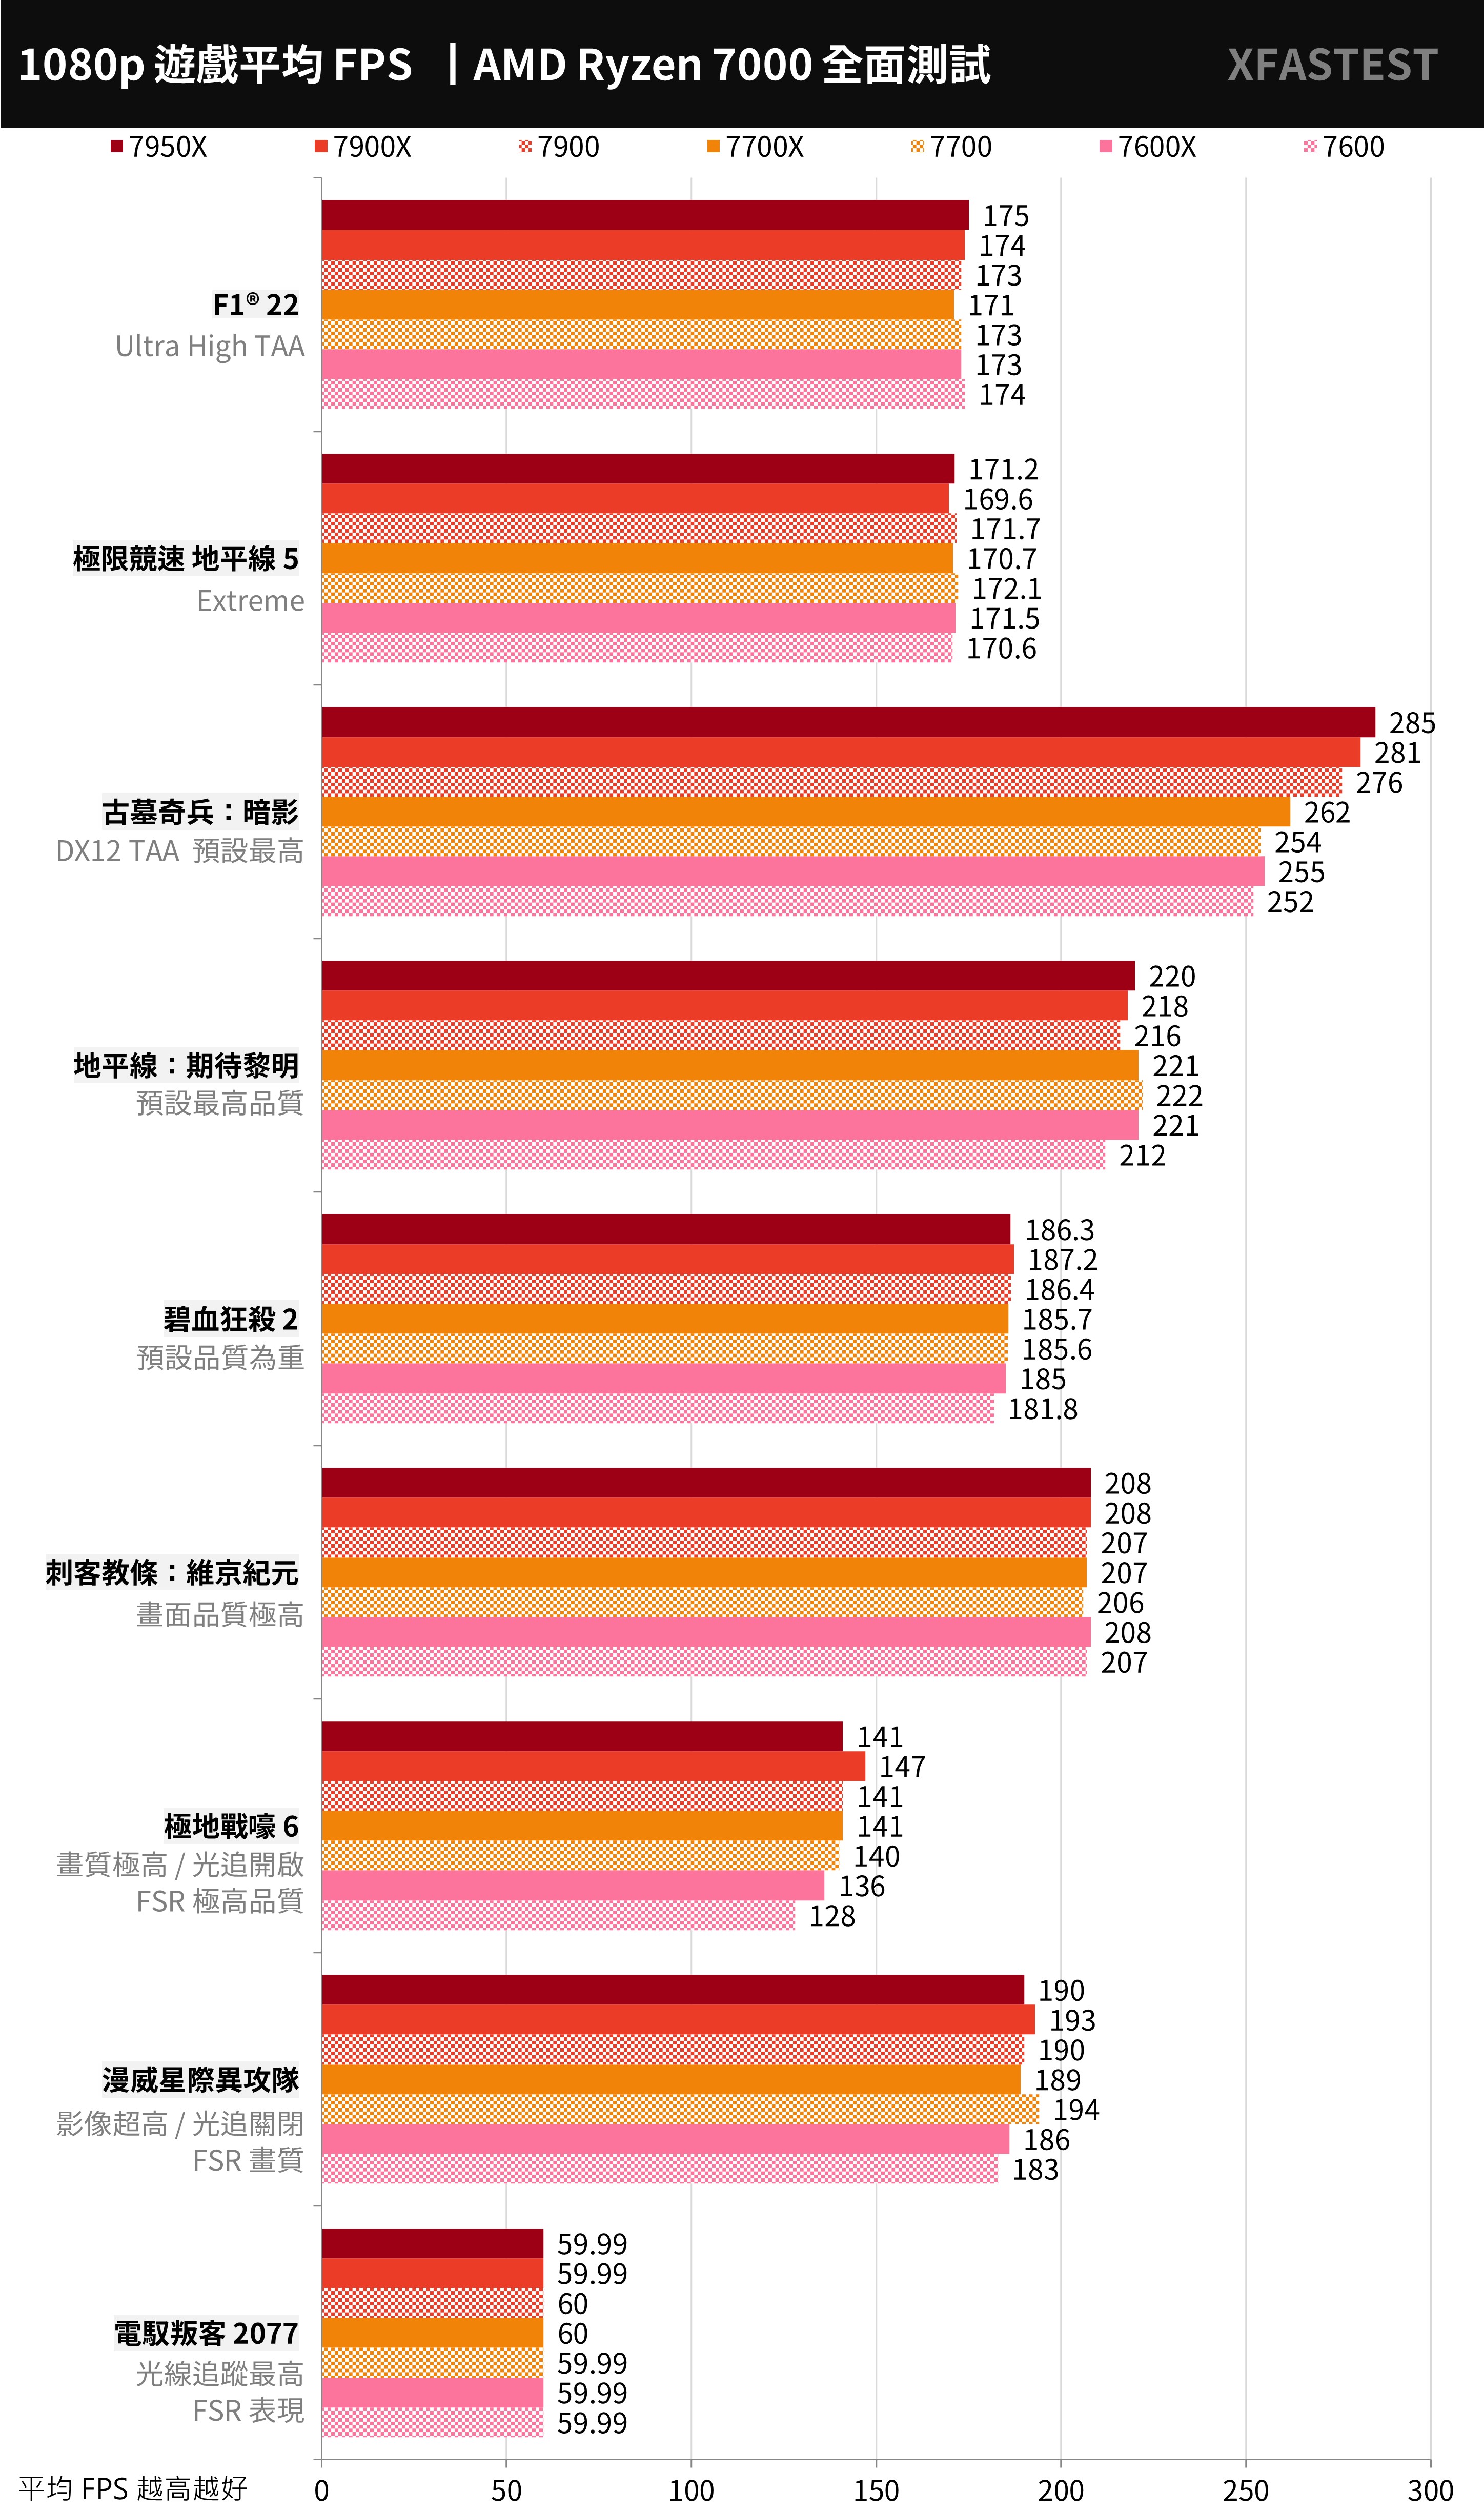
↑ Game test, the higher the average FPS, the better.
E-sports games focus on the tactical and technical competition between players and teams, so they don’t have high requirements for the image quality of the game. This also allows such games to have a fairly high average FPS performance on high-end CPUs and GPUs, especially in 1080p resolution. Under high speed, the improvement of CPU performance and clock can increase the FPS performance of the game.
The test uses two games, “Counter-Strike: Global Offensive” (CS:GO) and “Tom Clancy’s Rainbow Six: Siege” (R6), and tests at 1080p resolution and the game’s highest settings.
CS:GO game 7900 reaches 753.85 FPS, 7700 is 749.22 FPS, 7600 has 742.26 FPS; R6 game 7900 reaches 736 FPS, 7700 is 655 FPS, 7600 has 646 FPS. For e-sports games, it can better reflect the performance gap of high CPU clock speed.
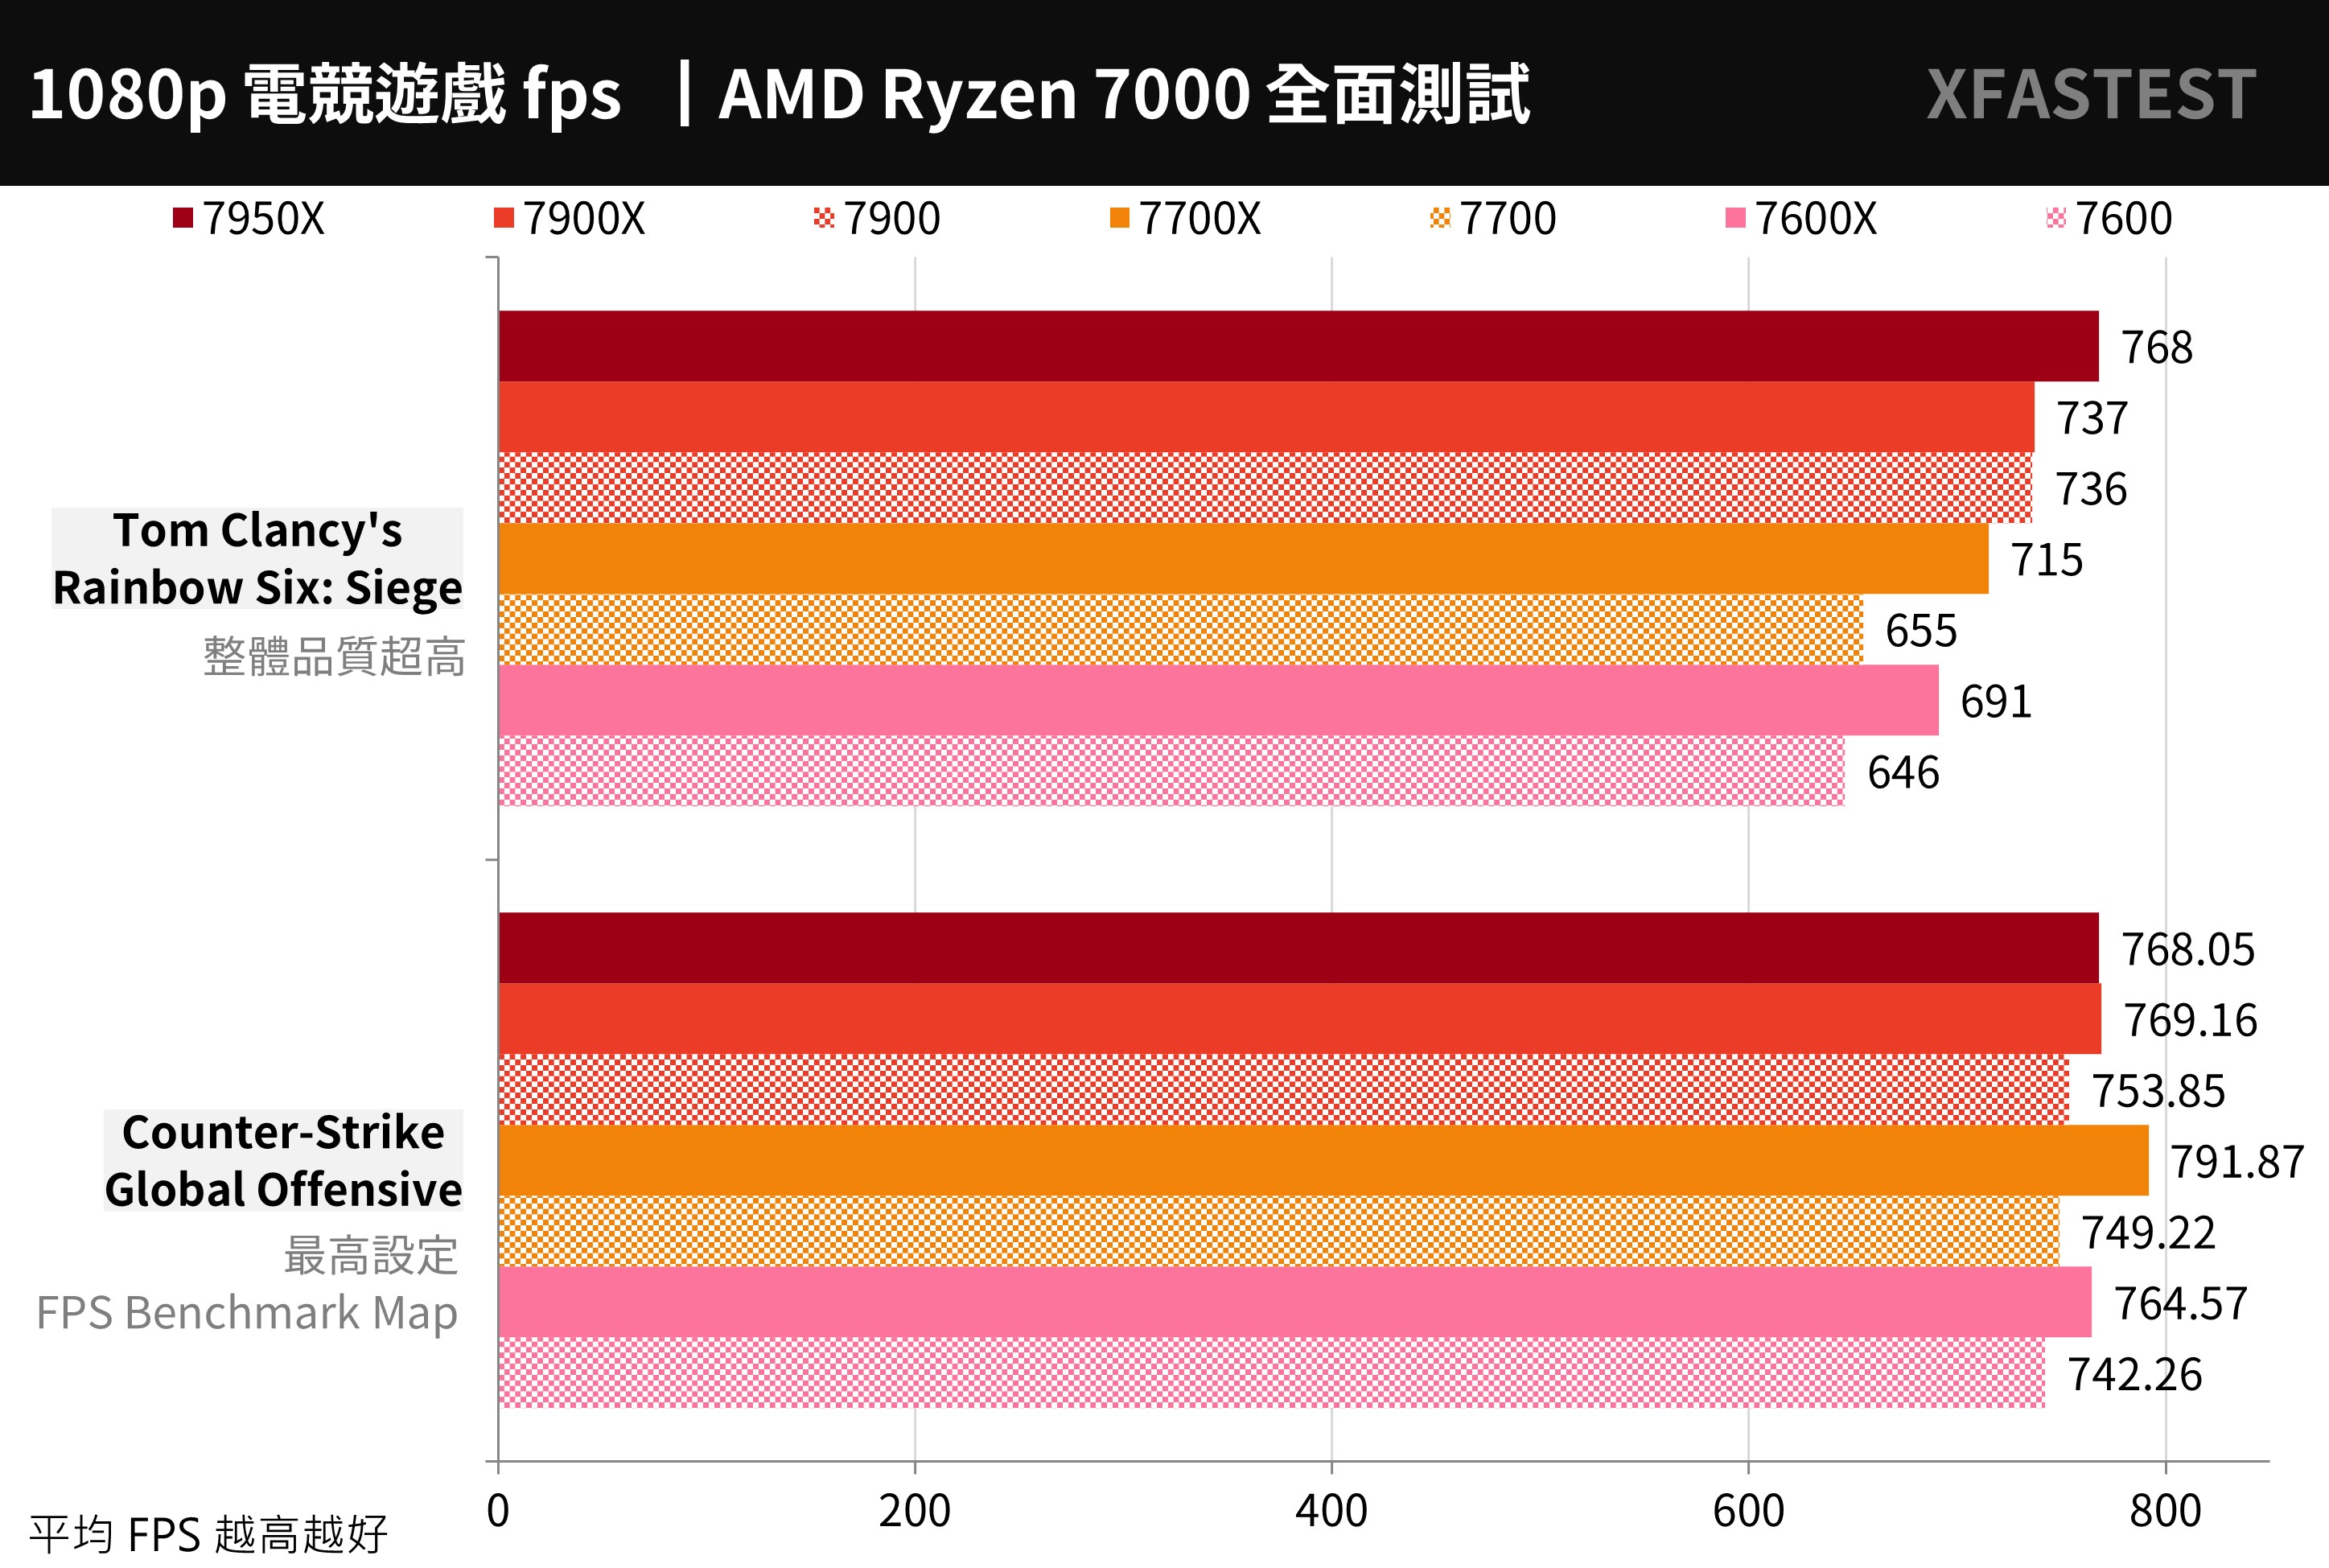
↑ E-sports game test, the higher the average FPS, the better.
Ryzen 7900, 7700, 7600 processor temperature and power consumption test
In terms of stress testing, Ryzen 7900, 7700, and 7600 all use original radiators, while X series uses 360mm AIO, fans and water pumps set at full speed to compare AIDA64 CPU and FPU burn-in respectively; for general computer use, the temperature is closer to the AIDA64 CPU test temperature performance, while the FPU test is the highest load and higher power consumption.
AIDA64 CPU stress test, 7900 is pressed at 61.9°C / 5.06GHz, 7700 is pressed at 69.5°C / 5.26GHz, 7600 is 82°C / 4.98GHz; then using FPU stress test, 7900 is pressed at 59.3°C / 3.66GHz , 7700 at 72.8°C / 4.44GHz, 7600 at 95°C / 4.39GHz
The Cinebench R23 stress test temperature is similar to that of the FPU test. It can be seen that the AMD Wraith Prism RGB cooler paired with the 7900 and 7700 does have a good heat dissipation capability, allowing the CPU to run at full basic Boost performance; but the Wraith Stealth cooler for the 7600 is not It seems a little insufficient.
Simply put, Ryzen 7900, 7700, and 7600 use the original radiator to meet the preset Boost performance requirements of the processor, but if you want to perform PBO overclocking, it is recommended to replace the tower fan or water-cooled radiator.
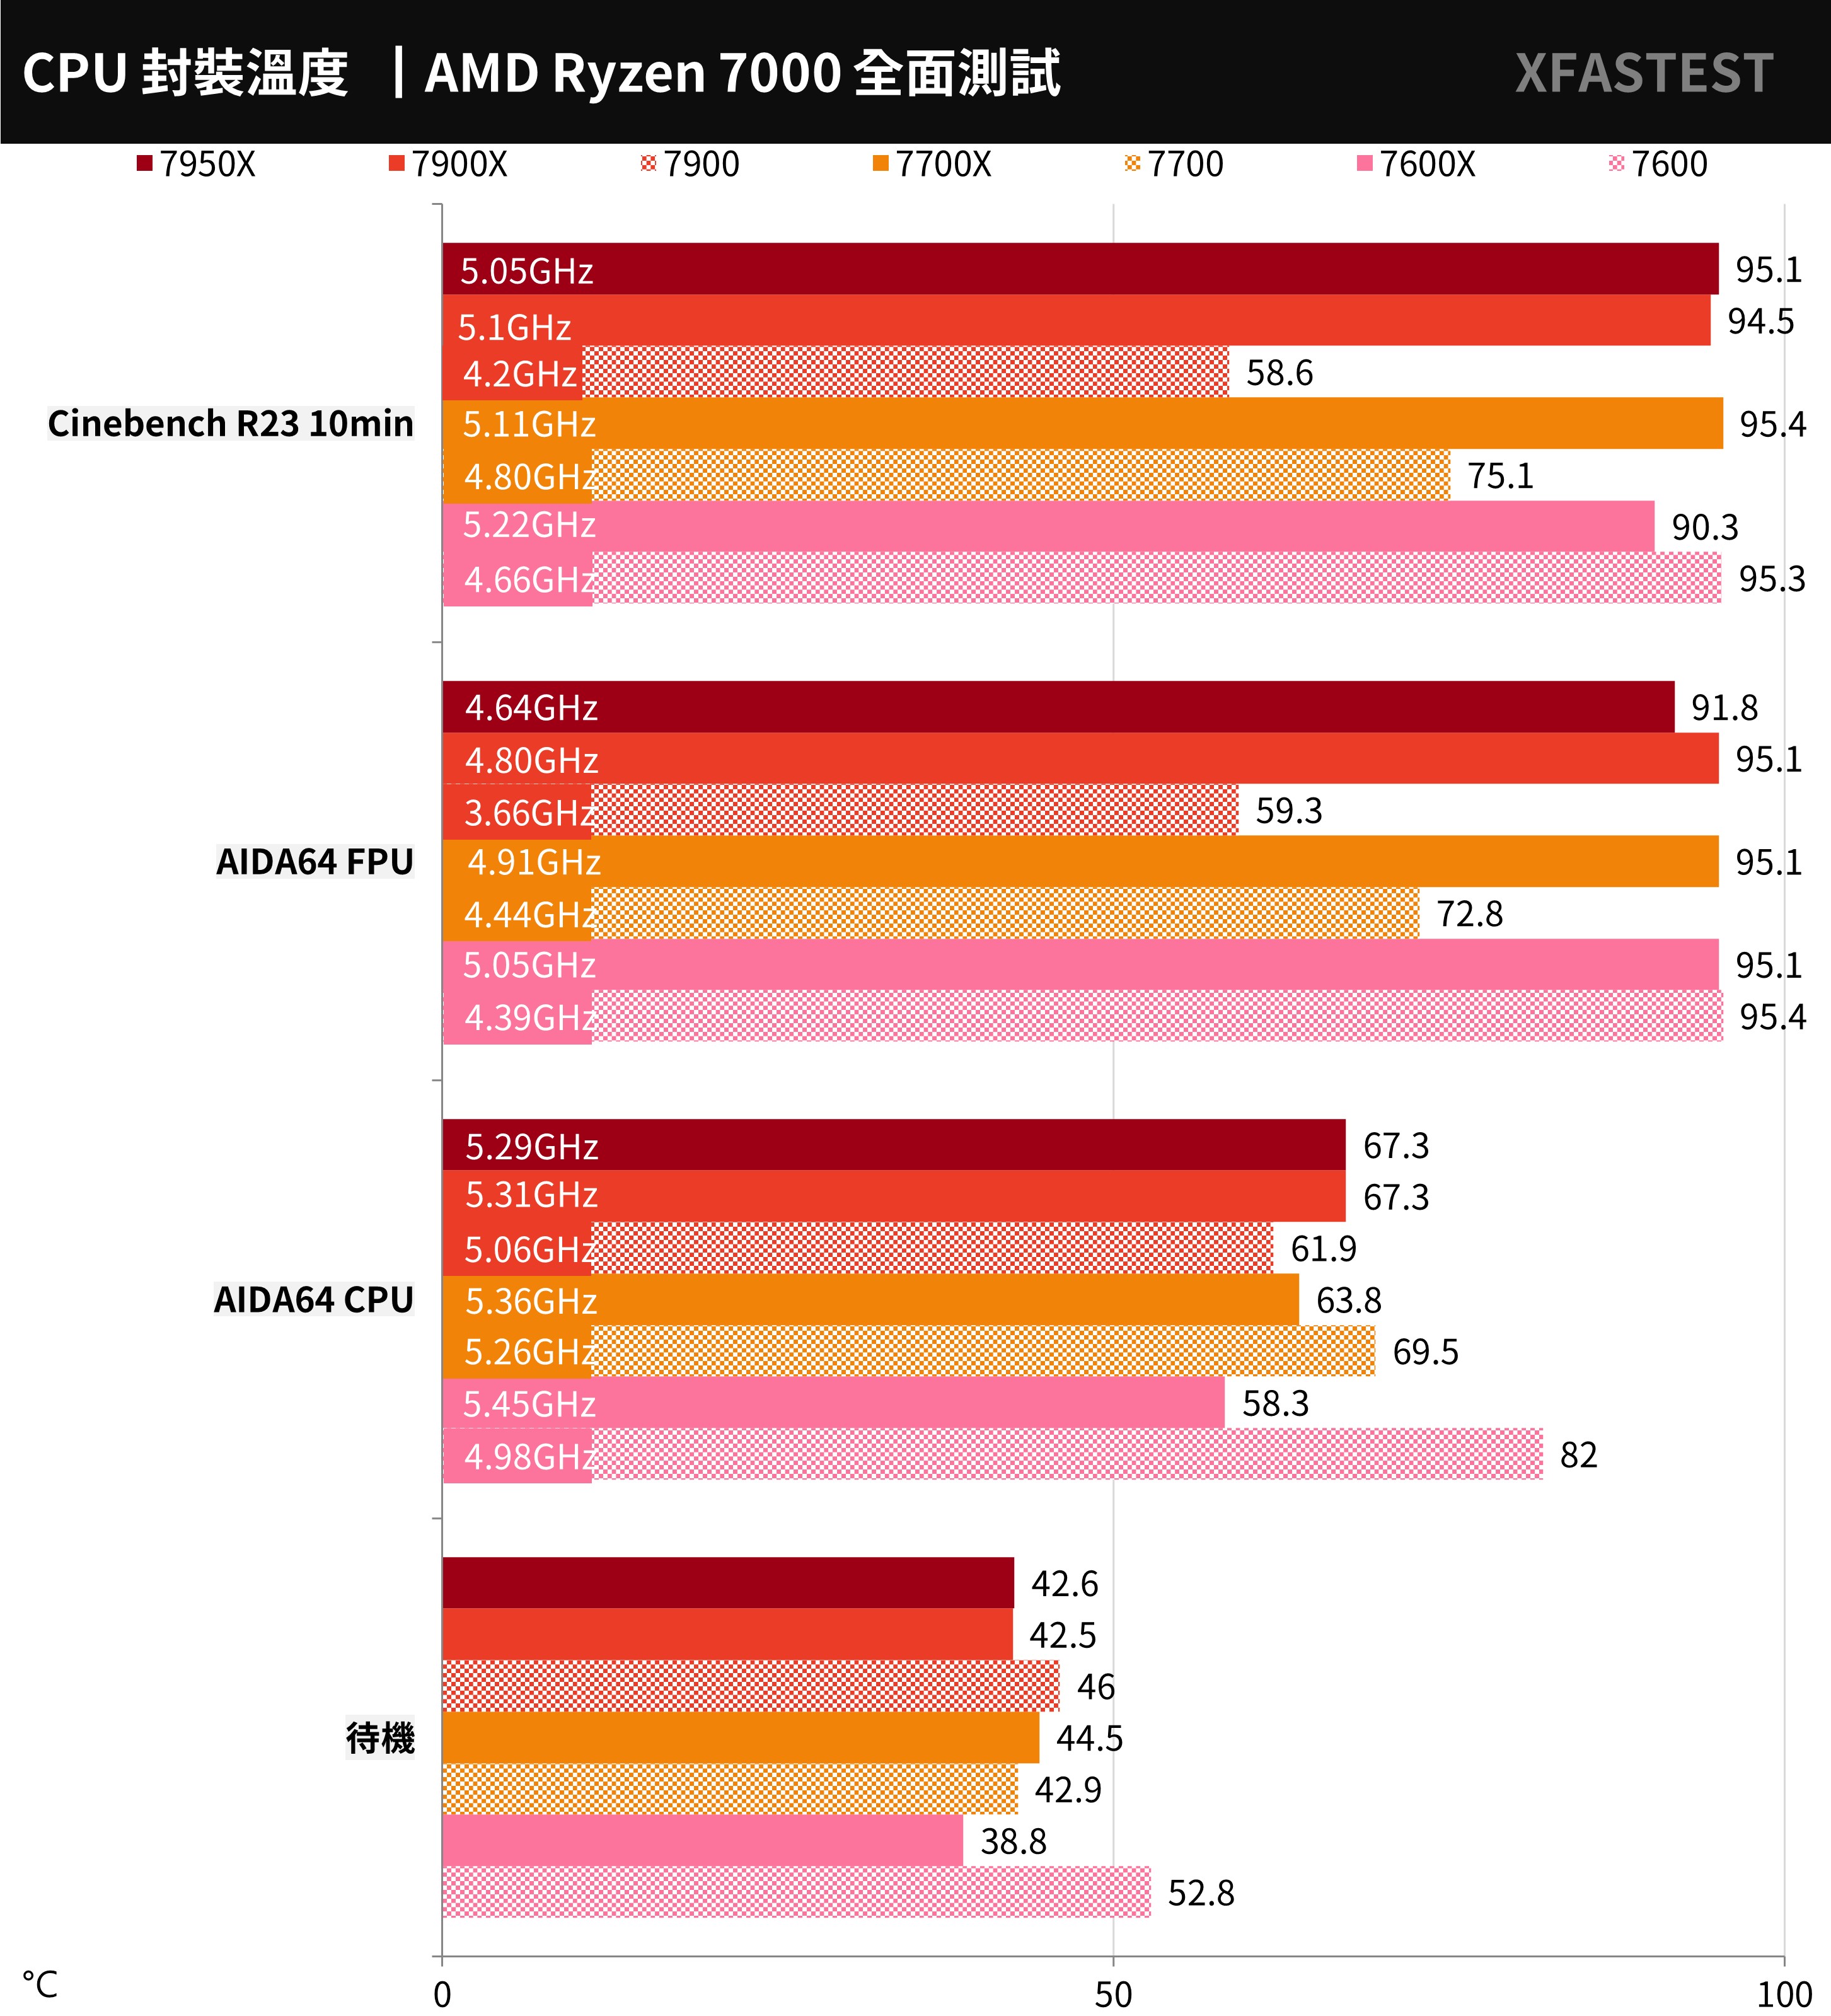
↑ CPU temperature test.
As for the CPU power consumption, it is mainly based on CPU Package Power. Under the AIDA64 CPU test, 7900 reaches 90.1W, 7700 reaches 79.6W, and 7600 only 69W; FPU test, 7900 also reaches 90.1W, 7700 also reaches 90.1W, and 7600 reaches 90.1W. Only 83.1W.
That is to say, Ryzen 7900, 7700 and 7600 have a maximum power consumption of about 90W by default, unless the player turns on PBO or manually overclocks to exceed the preset power consumption limit.
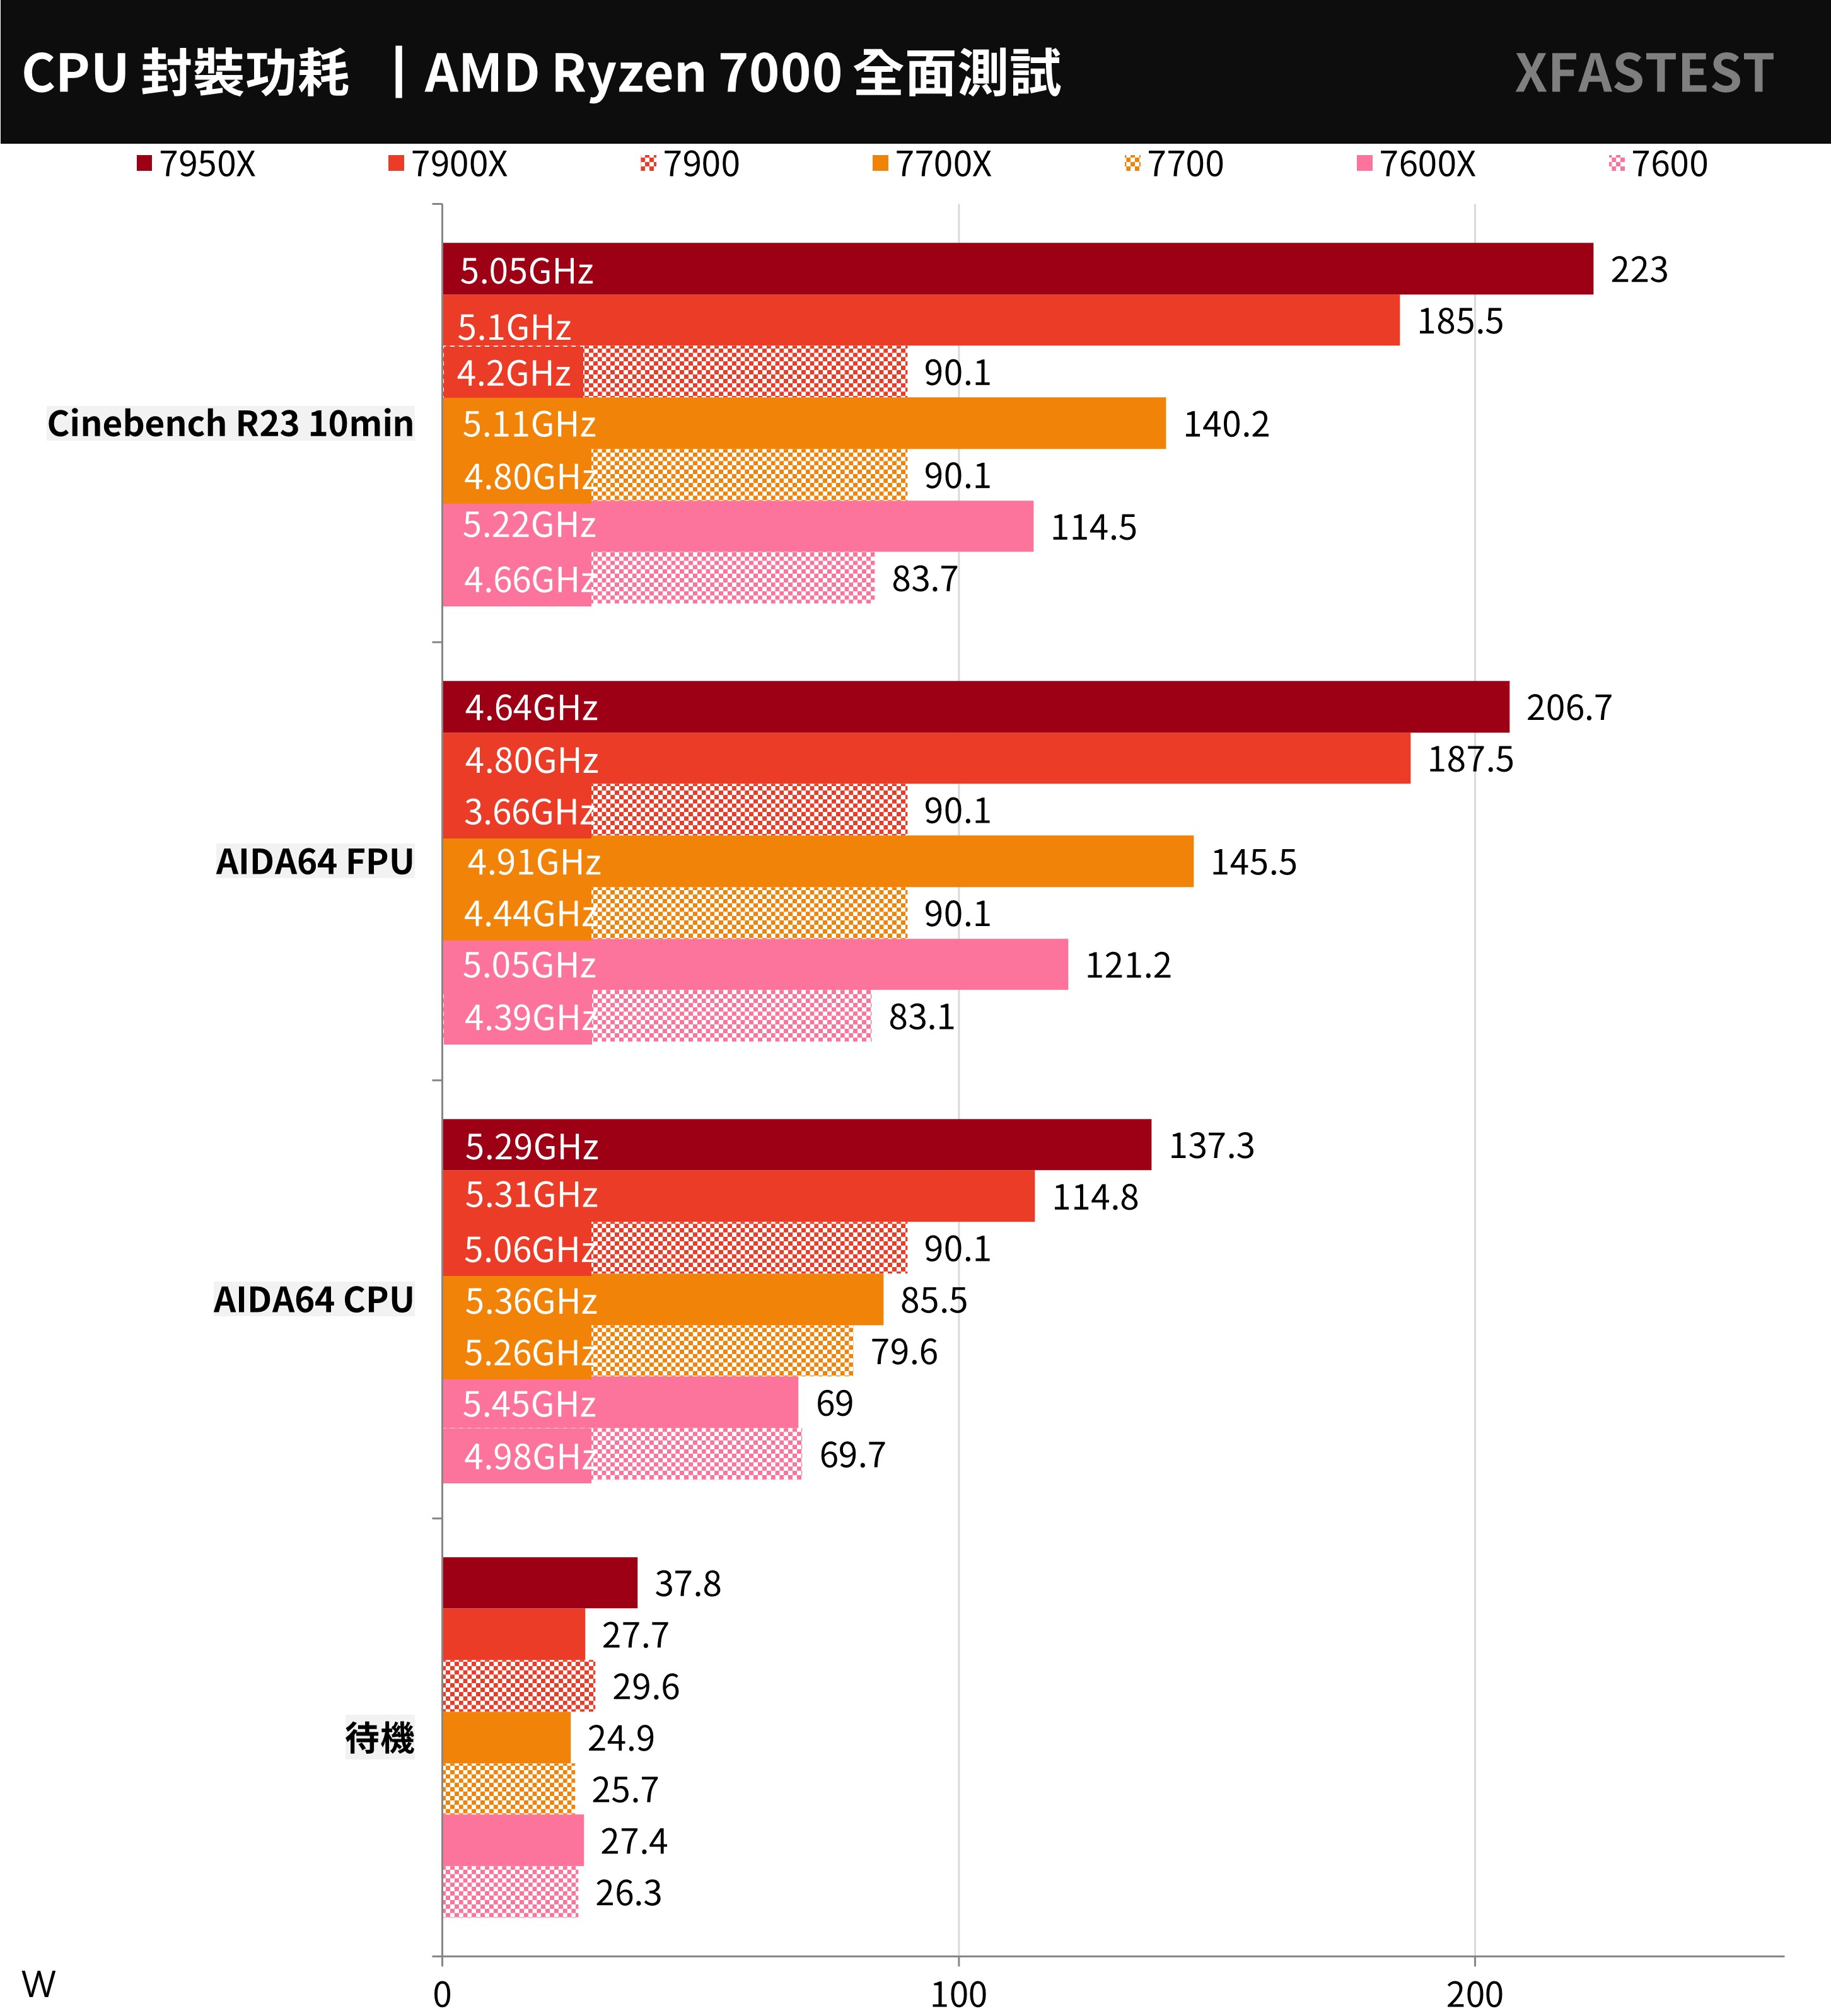
↑ CPU power consumption test.
Ryzen 7900, 7700, 7600 overclocking with water cooling and PBO
If players have enough budget for the installation, they can also replace Ryzen 7900, 7700 and 7600 with better radiators to unlock PBO overclocking and get better performance. In the test, after 7900 uses 360mm AIO water cooling to enable PBO overclocking, Cinebench R23 CPU The score can reach 29111 points, about 21% improvement.
But turning on PBO overclocking mainly significantly improves the multi-core performance. The difference between the overall performance of the computer and single-core is relatively small. After turning on PBO, the multi-core performance of 7700 is 5%, and that of 7600 is 4%. In other words, if you choose 7900 to turn it on The performance of PBO is indeed more cost-effective.
Players can easily enable the PBO overclocking function through BIOS or Ryzen Master, even the entry-level processor AMD still provides the possibility of CPU and DRAM overclocking.
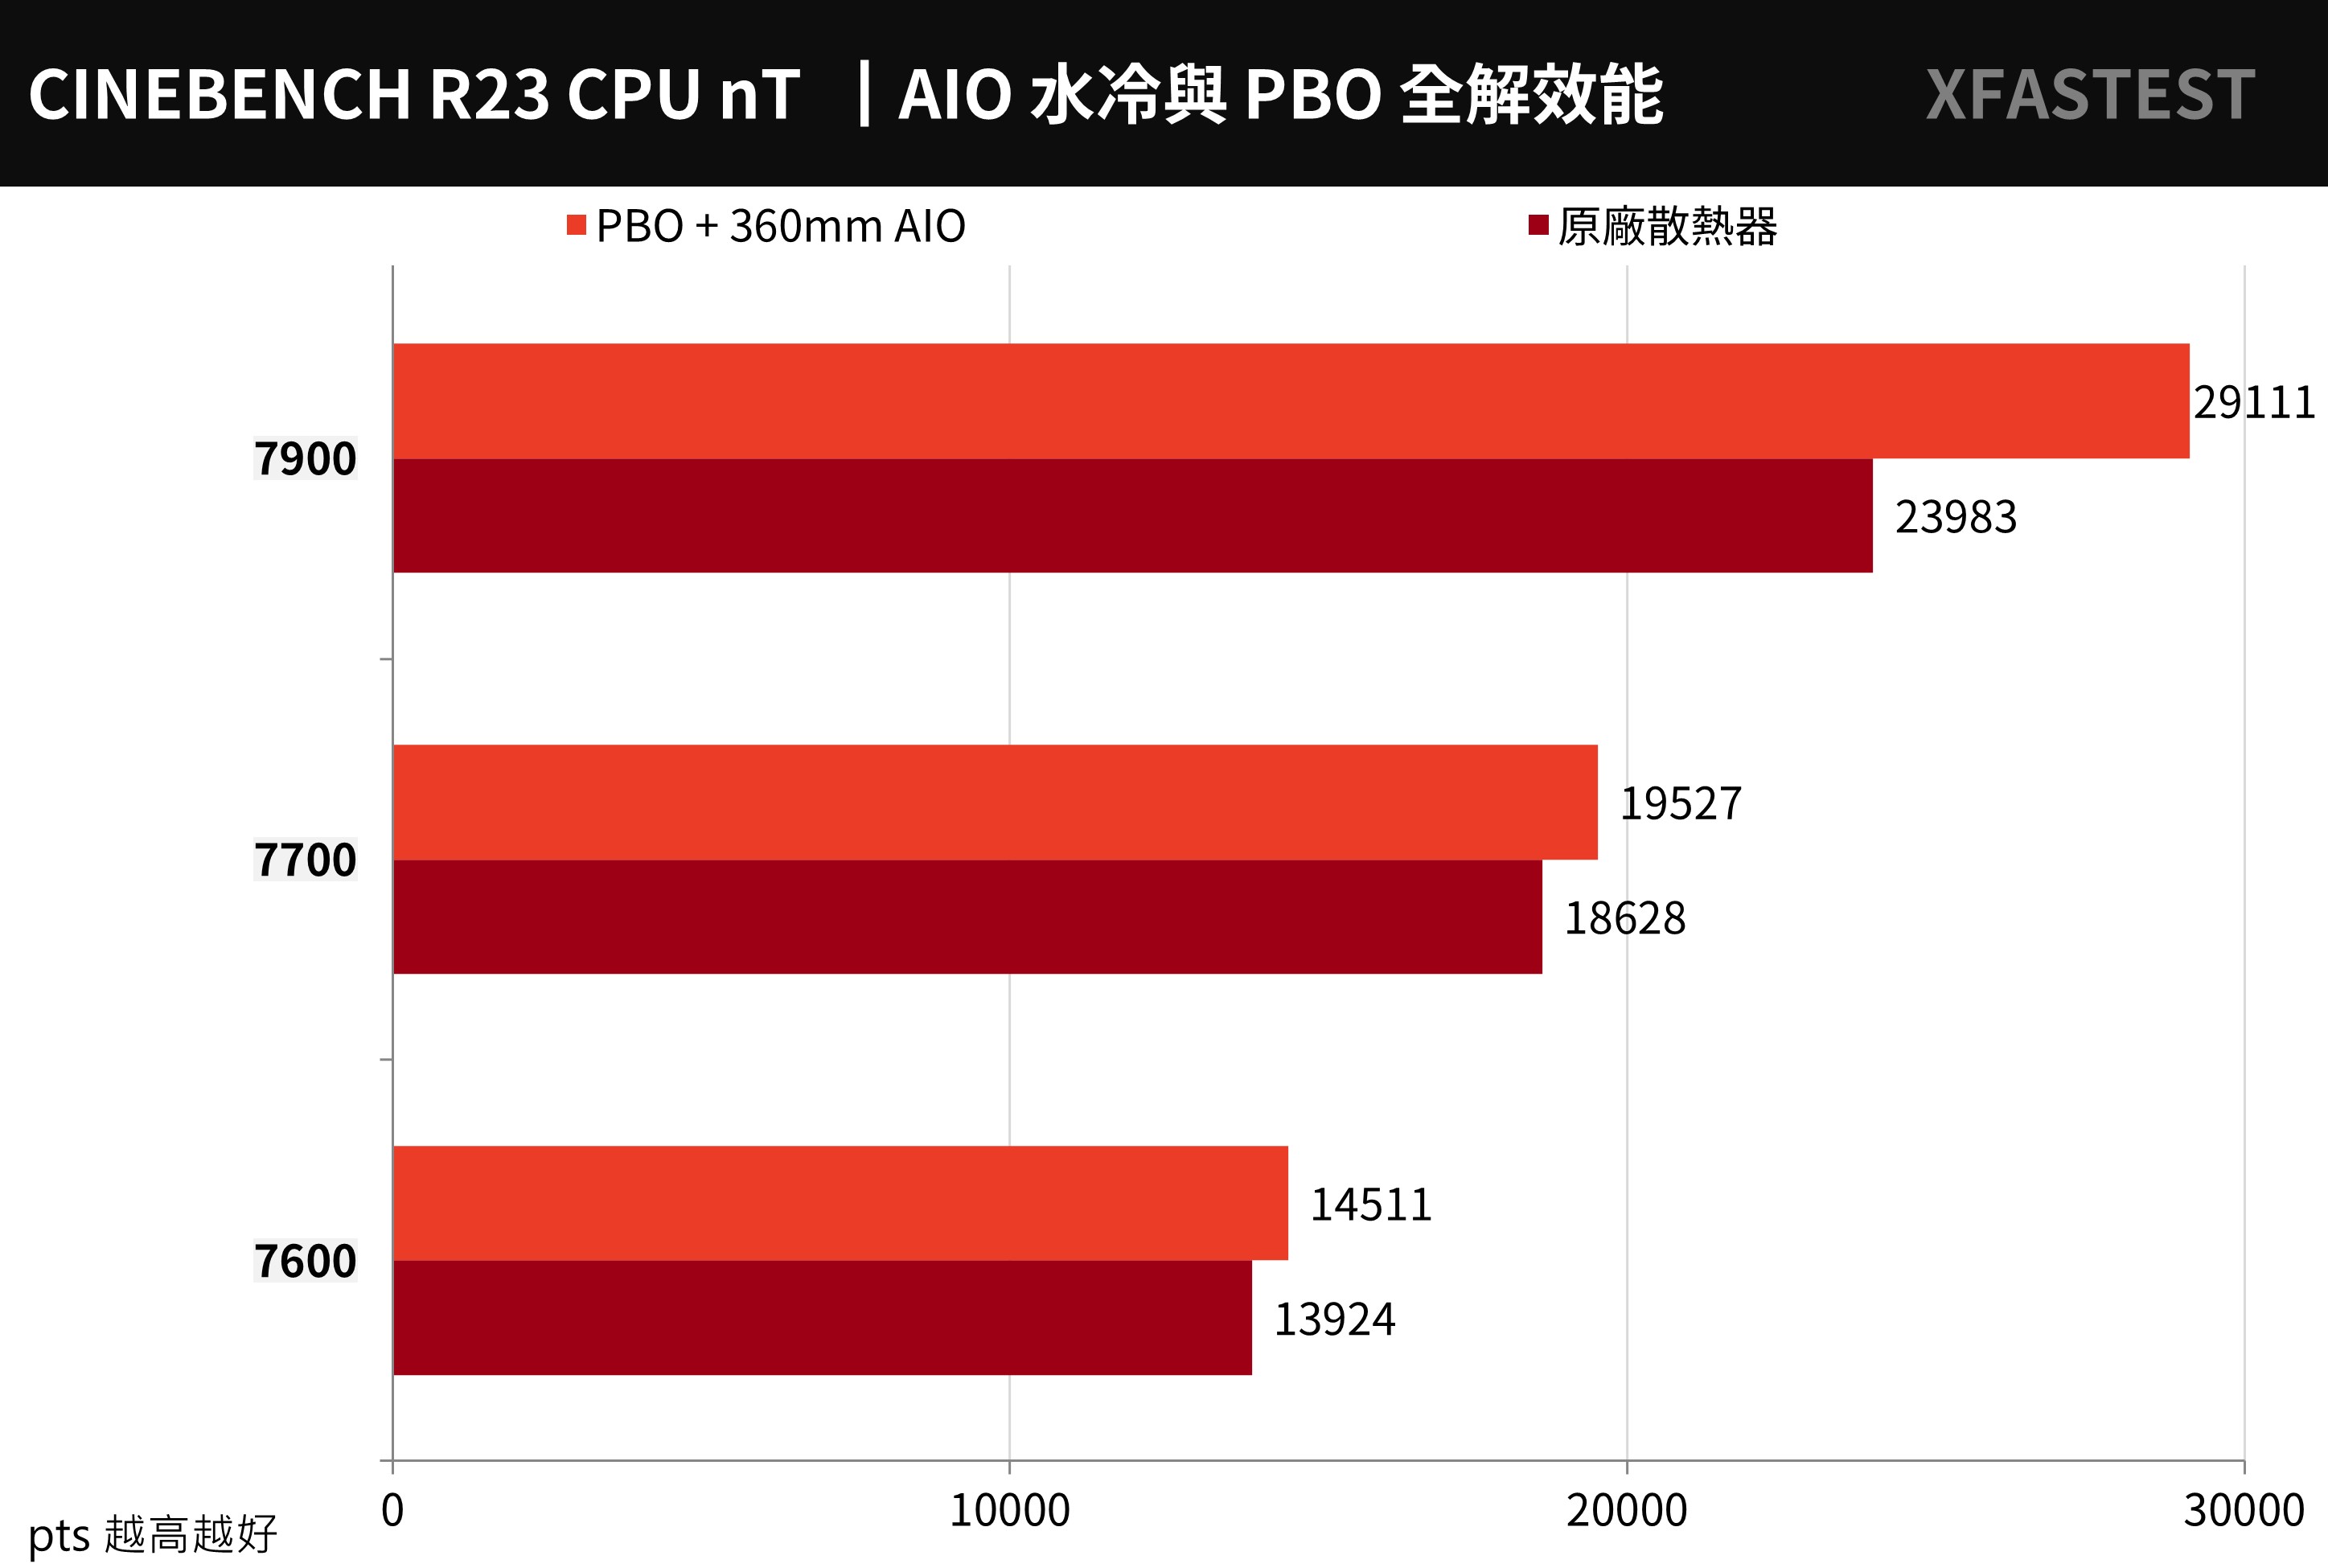
↑ 360mm water cooling + PBO multi-core performance improvement.
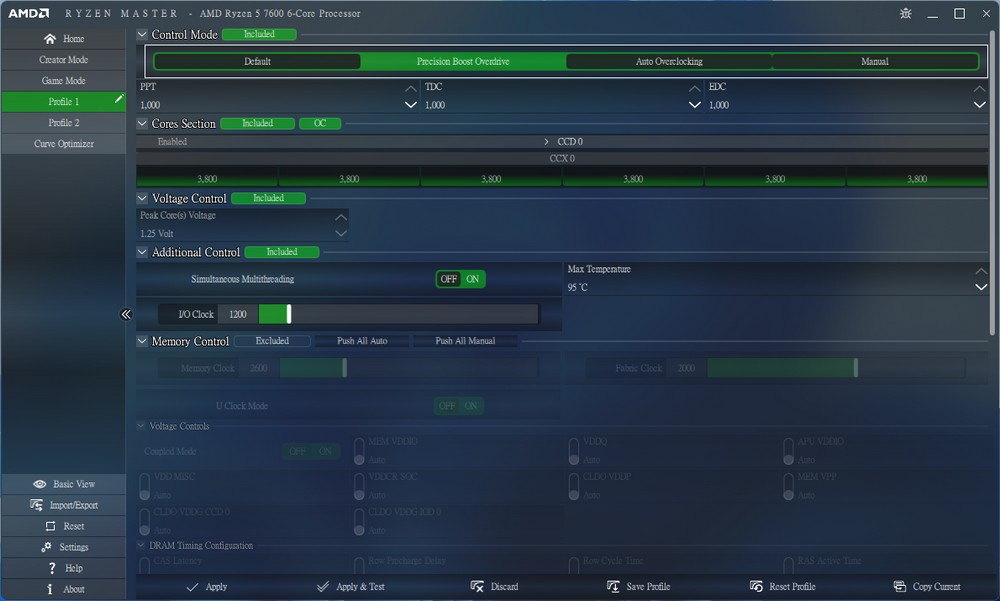
↑ Ryzen Master PBO overclocking.
Summarize
The AMD Ryzen 7000 65W processor is updated, complementing 7900, 7700 and 7600 and other entry-level options, so that entry-level and mainstream installed players have a more cost-effective choice. The performance is slightly weaker than the X-series, but the original fan can satisfy Basic performance requirements, if you want to play PBO, manual overclocking, it is recommended to use a better air-cooled or water-cooled radiator.
As for the future, players can look forward to the Ryzen 7000X3D processor that will debut in February, which will accelerate game performance by stacking 3D Cache. Then we will see if AMD can regain the title of the strongest game processor.
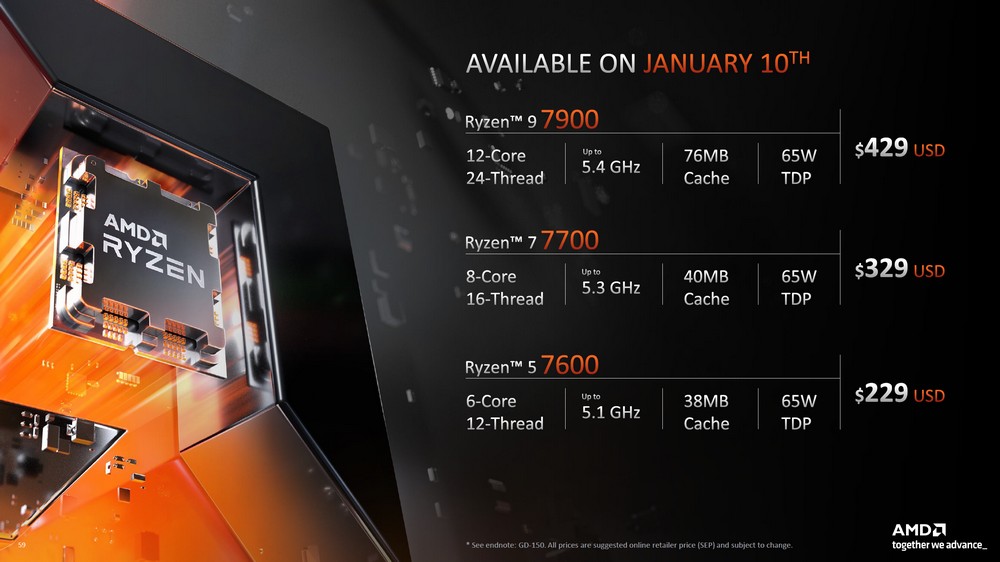
↑ AMD Ryzen 7000 65W processor prices.
Further reading: