
Although the game performance is not comparable to Ryzen 7950X3D, but compared to the game performance per yuan, this is definitely a new choice for the ultimate game processor. AMD Ryzen 7 7800X3D processor, with the 3D V-Cache super-large 96MB L3 cache, can improve the performance of 1080p games by 15.7%, but stacking the cache on the core also makes the processor clock rate slightly lower , Multi-core performance is slightly reduced, but it can be exchanged for better gaming and power consumption performance.
AMD 3D V-Cache best deal game processor Ryzen 7 7800X3D
A while ago, the high-core 3D V-Cache processors AMD Ryzen 7950X3D and 7900X3D have been launched. This time, the 8-core Ryzen 7 7800X3D is added. Through the “3D V-Cache” packaging technology, 64MB L3 chips are stacked on the core chip CCX. to enhance 1080p gaming performance.
Ryzen 7 7800X3D has 8 cores, 16 execution threads, up to 5.0GHz Boost clock, and increases TDP to 120W, priced at $449 in US dollars. Compared with the 7700X with the same core specifications, the main reason is that the clock frequency is reduced and the TDP is increased, but the relative price is also $50 more. However, the TjMax of the 7800X3D is set at 89°C, which is lower than the 95°C of the general X processor.
The 7800X3D processor is expected to be released at 9:00 pm on April 6. The price in Taiwan may be between 7700X and 7900X, but if the price is too high, it will be difficult for 1080p gamers to pay.
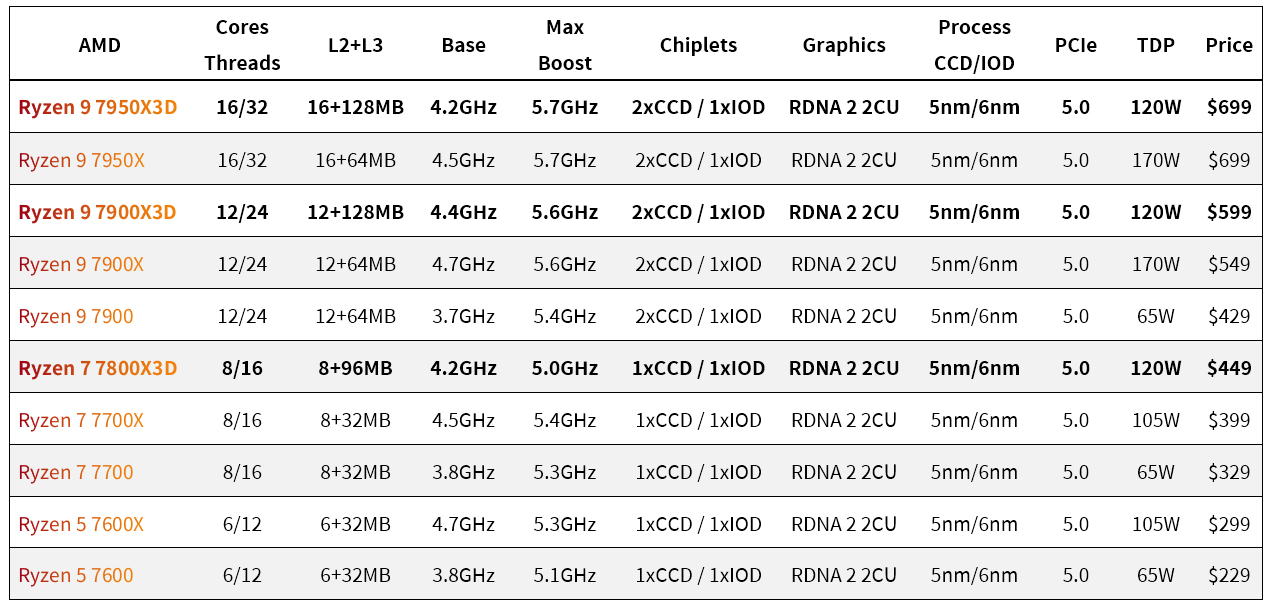
↑ AMD Ryzen 7000 full series specifications.
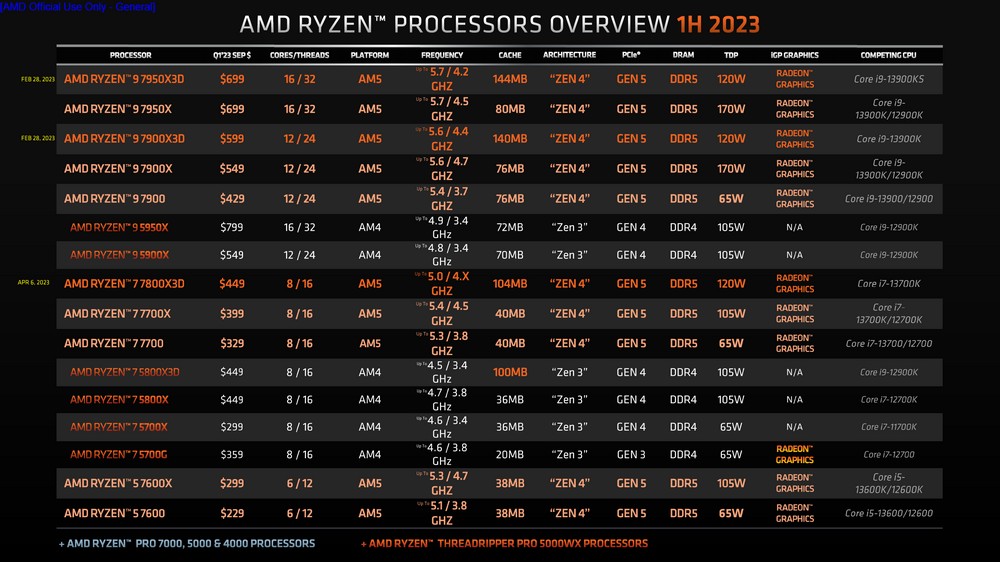
↑ Ryzen 5000, 7000 and rivals marked.
Windows Game Mode, 3D V-Cache optimization and PPM exclusive driver update
For the Ryzen 7950X3D and 7900X3D with two independent CCX configurations, in addition to installing the latest chipset driver, it is also necessary to match the Game Mode mode enabled by Windows default, so that the game can first use the CCX with 3D V-Cache to accelerate performance .
However, if the 7800X3D is only equipped with a single CCX, there is no need to additionally schedule cores through the system and drivers, but the AMD PPM Provisioning File Driver and AMD 3D-Vacche Performance Optimizer Driver functions will be included when the chip driver is installed. Therefore, when players buy a Ryzen 7000X3D processor, in addition to upgrading the motherboard BIOS, they also need to install the latest driver chips to fully utilize the performance of the processor.
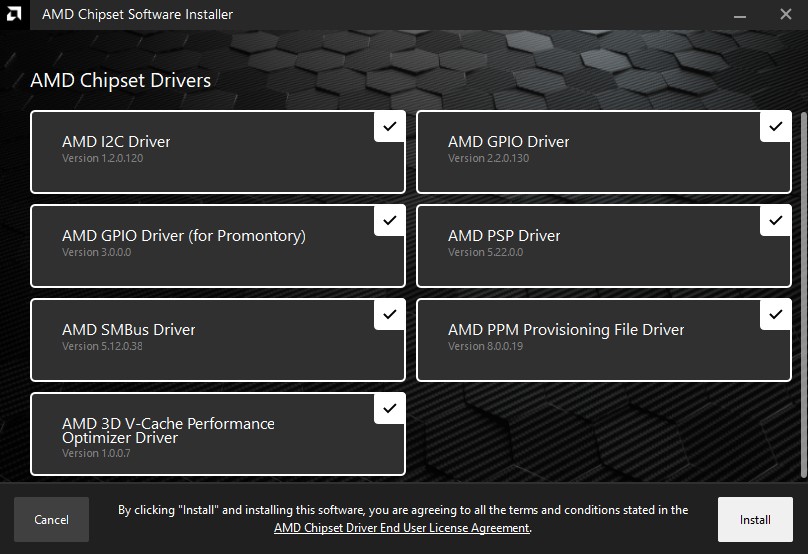
↑ AMD Chipset Driver.
Test platform and settings
This test mainly focuses on the game performance of AMD Ryzen 7 7800X3D, and compares it with Intel Core i9-13900K and AMD Ryzen 9 7950X, 7700X processors; the radiator uses AIO 360mm water-cooled radiator uniformly, and is set to the motherboard default Auto unlock Power consumption limit, using DDR5-6000 EXPO memory; the test platform is provided as follows for your reference.
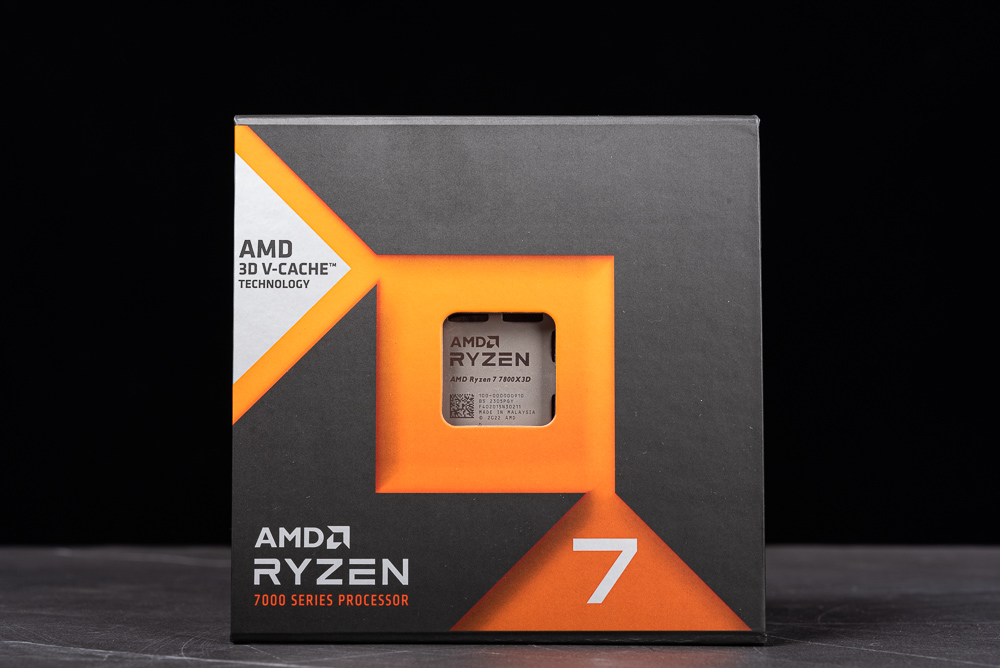
↑ AMD Ryzen 7 7800X3D processor box.
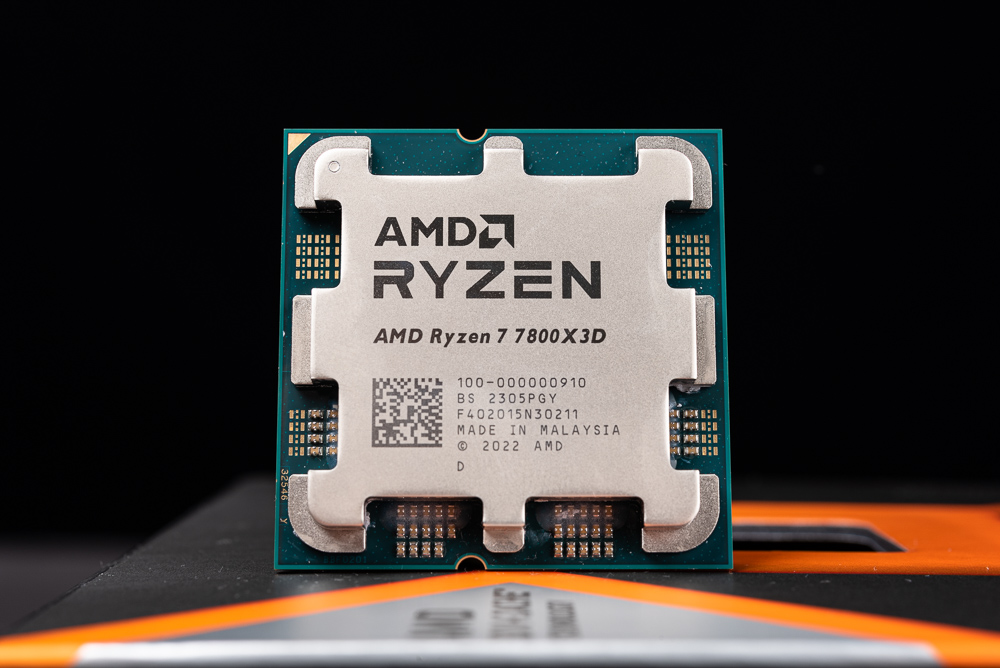
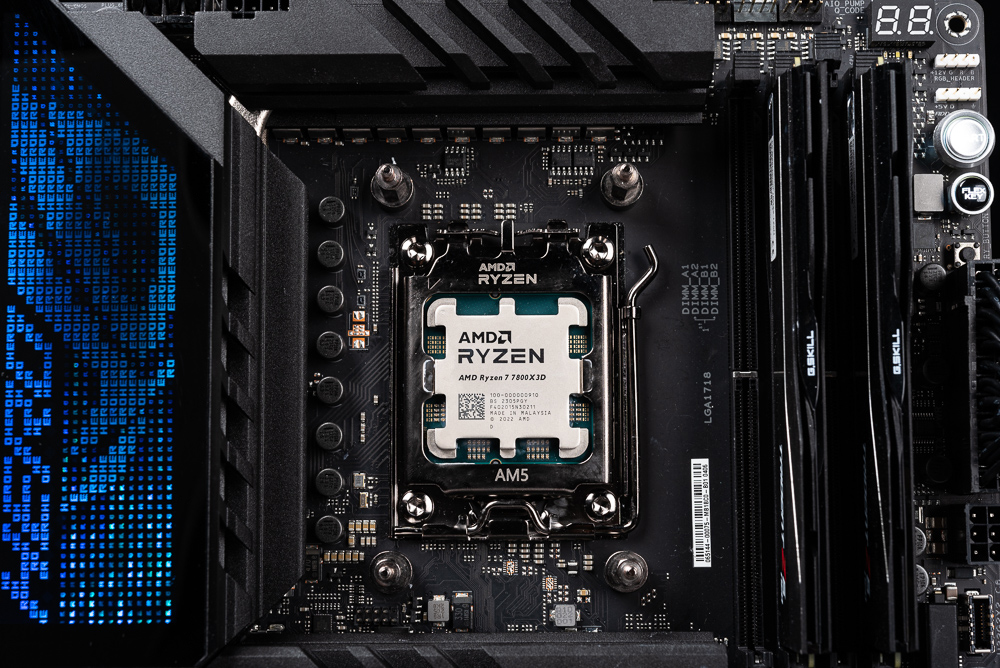
↑ AMD Ryzen 7 7800X3D Processor.
testing platform
Processor: AMD Ryzen 9 7950X3D / 7800X3D / 7700X, Intel Core i9-13900K
Motherboard: ROG CROSSHAIR X670E HERO, ASRock Z790 Taichi
Memory: G.SKILL TRIDENT Z5 NEO DDR5-6000 16GBx2
Graphics Card: NVIDIA GeForce RTX 4090
System drive: Solidigm P41 Plus 1TB PCIe 4.0 SSD
Radiator: 360mm AIO liquid cooler
Power supply: Seasonic PRIME PX-1000
OS: Windows 11 Pro 22H2
CPU-Z Check the AMD Ryzen 7 7800X3D processor information, code-named Raphael, 5nm process, TDP 120W, with 8 cores, 16 execution threads, the tested motherboard is ROG CROSSHAIR X670E HERO, and the memory is DDR6 6000 16GBx2.
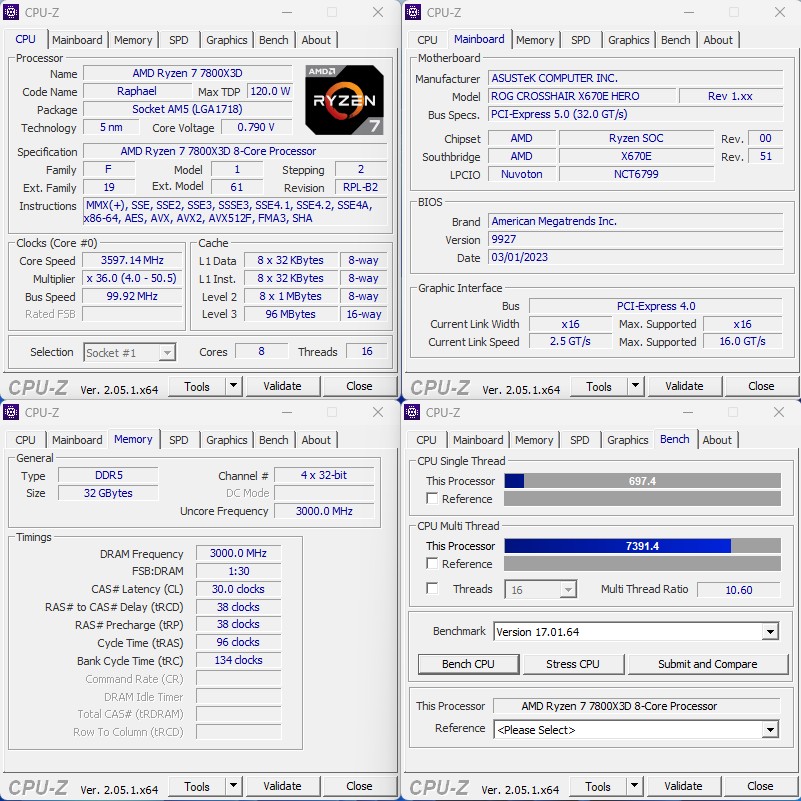
↑ CPU-Z。
Processor computing performance Cinebench, VRay rendering test
CINEBENCH R20developed by MAXON based on Cinema 4D, can be used to evaluate the 3D rendering performance of computer processors. It is also a reliable test software that can quickly evaluate the performance of CPU multi-core computing.
nT multi-thread 7800X3D achieves 7080 points, 1T single-thread 704 points, compared with 7700X, multi-core performance is reduced by -6.6%, and single-thread performance is reduced by -9.2%.
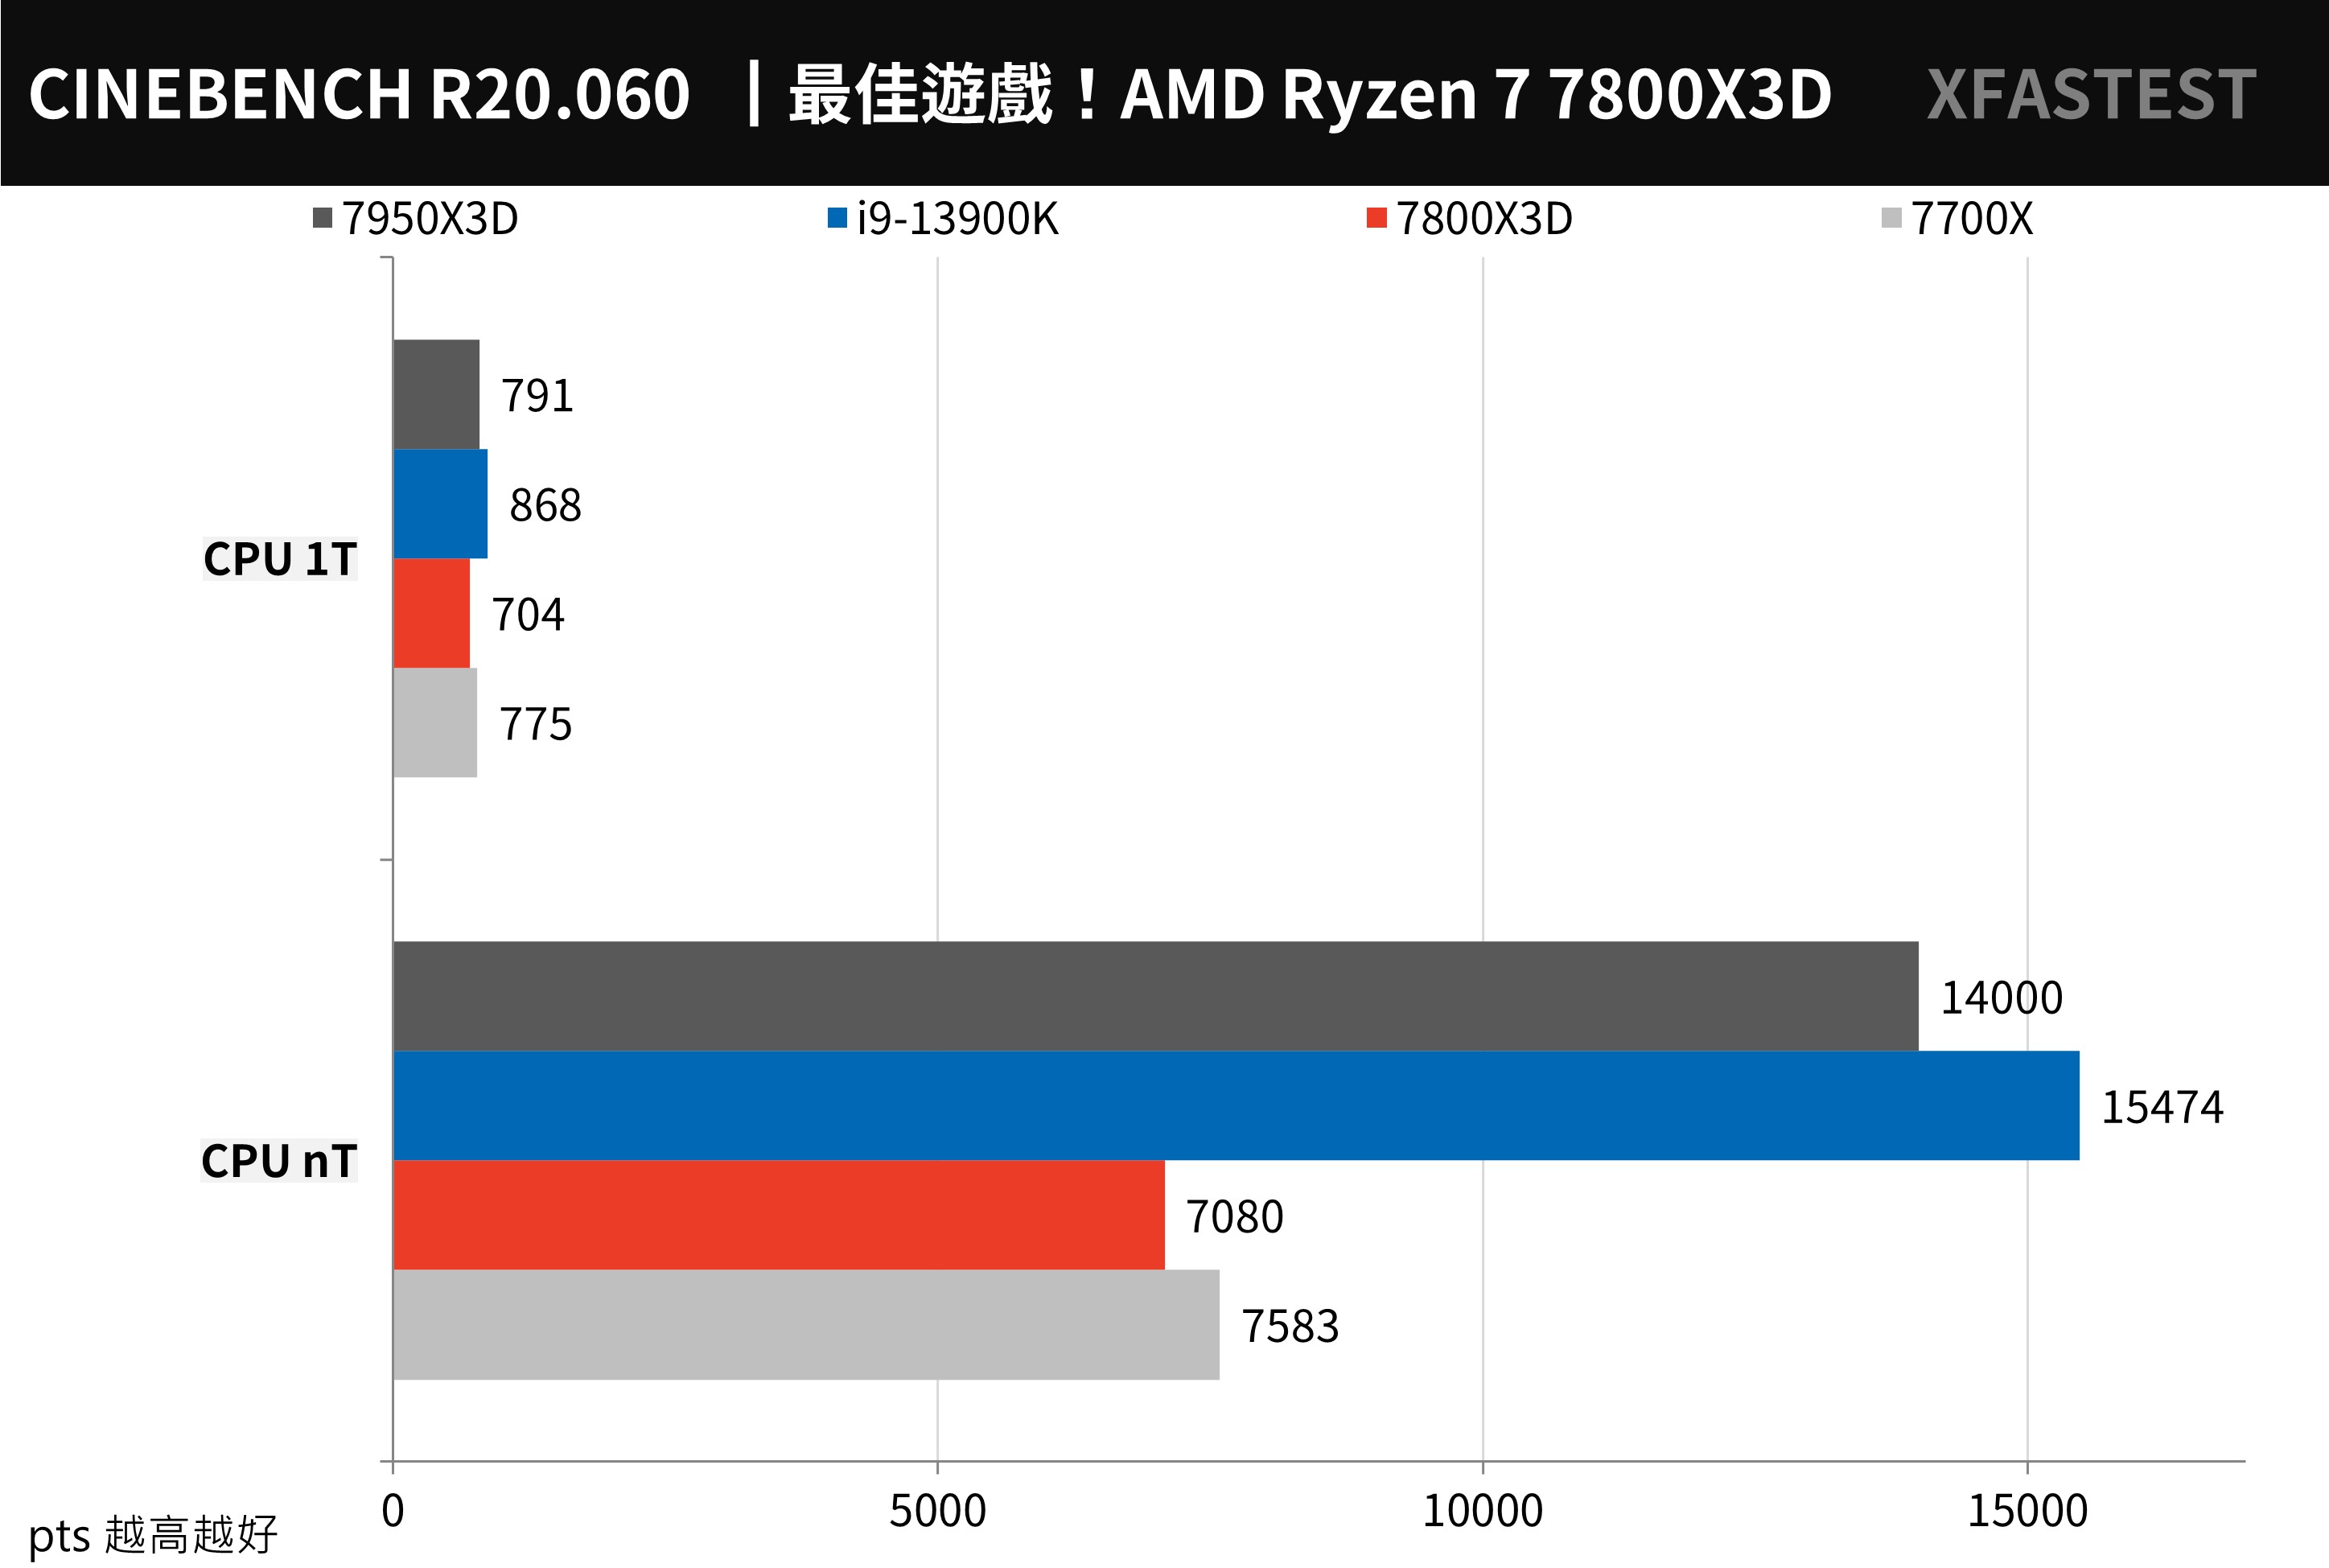
↑ CINEBENCH R20, the higher the score, the better.
CINEBENCH R23 The test scenario is the same as R20, with a new compiler and a stress test function. Players can customize the Minimum Test Duration time, such as 10 or 30 minutes to test the stability of the computer; however, the results of R23 cannot be compared with R20.
nT multi-thread 7800X3D achieves 18184 points, 1T single-thread 1807 points, compared with 7700X, multi-core performance is reduced by -8%, and single-thread performance is reduced by -9.5%.
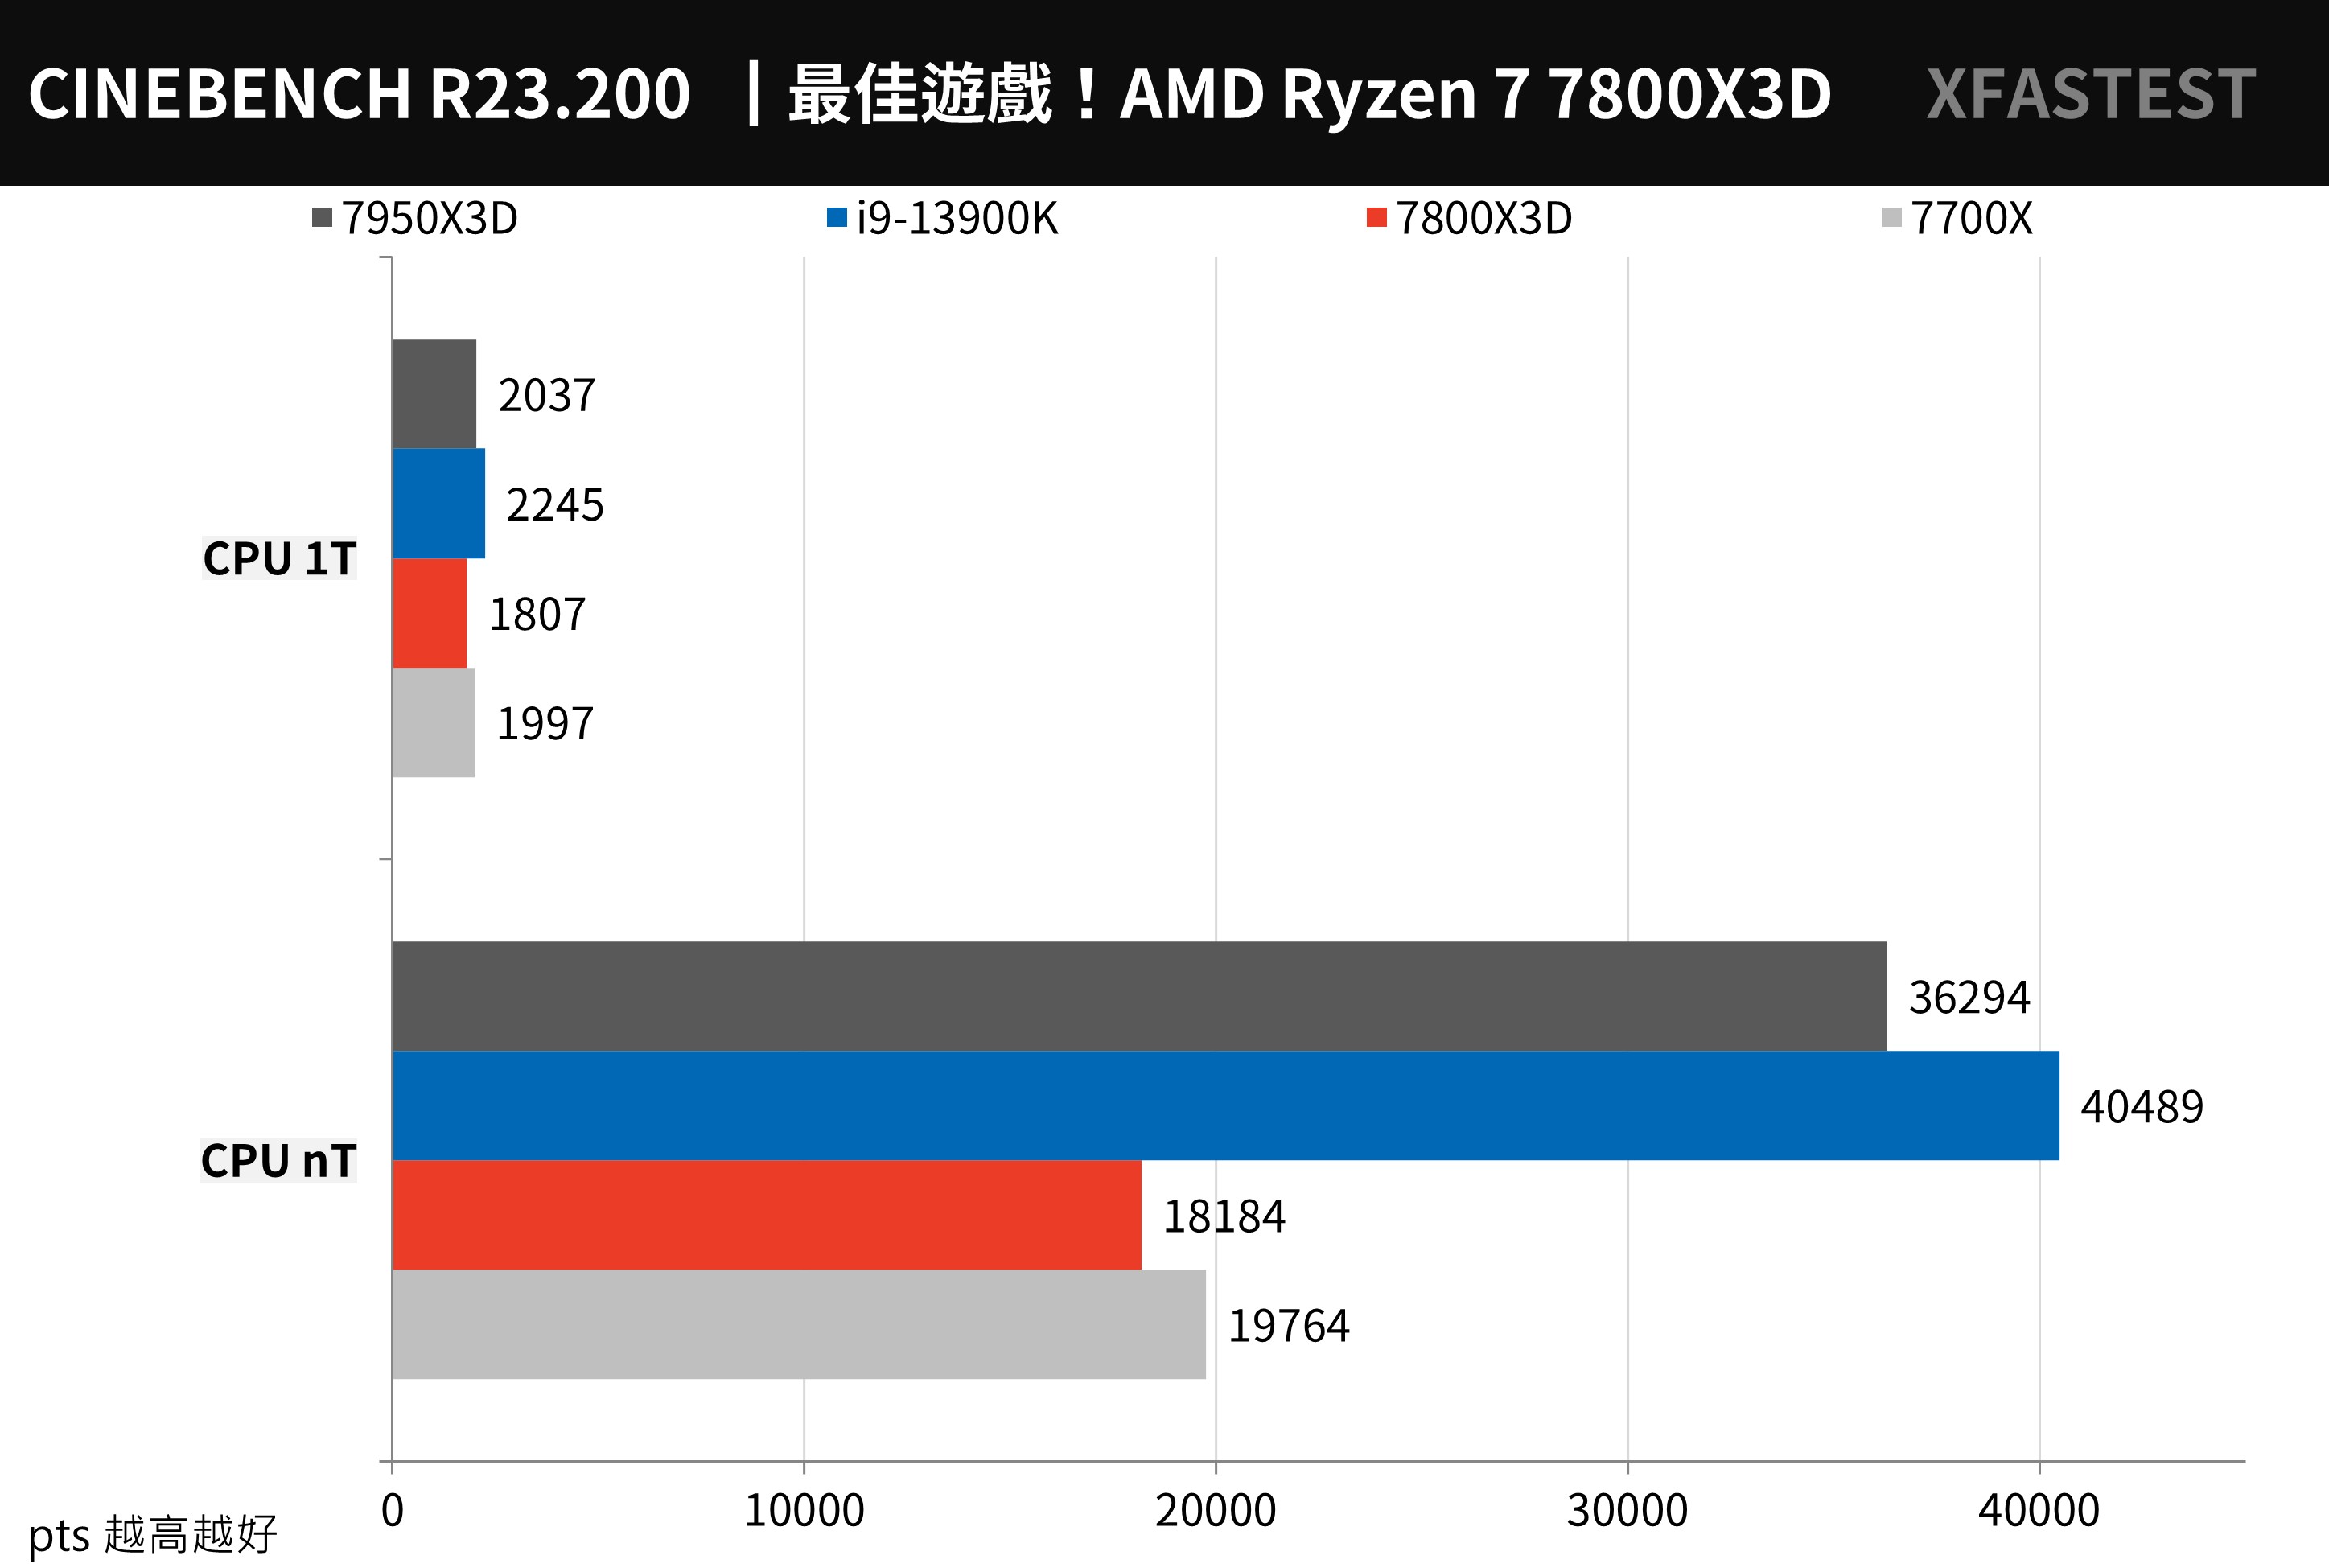
↑ CINEBENCH R23, the higher the score, the better.
V-Ray Benchmark Developed by Chaos Group, V-Ray is a ray rendering software designed based on the laws of physics. This tool can test the computing performance of the rendered image for ray tracing on the CPU. The CPU score is calculated in units of vsamples per second.
The 7800X3D achieved a score of 14443 points, compared to the 7700X, which reduced the computing performance by -4.4%.
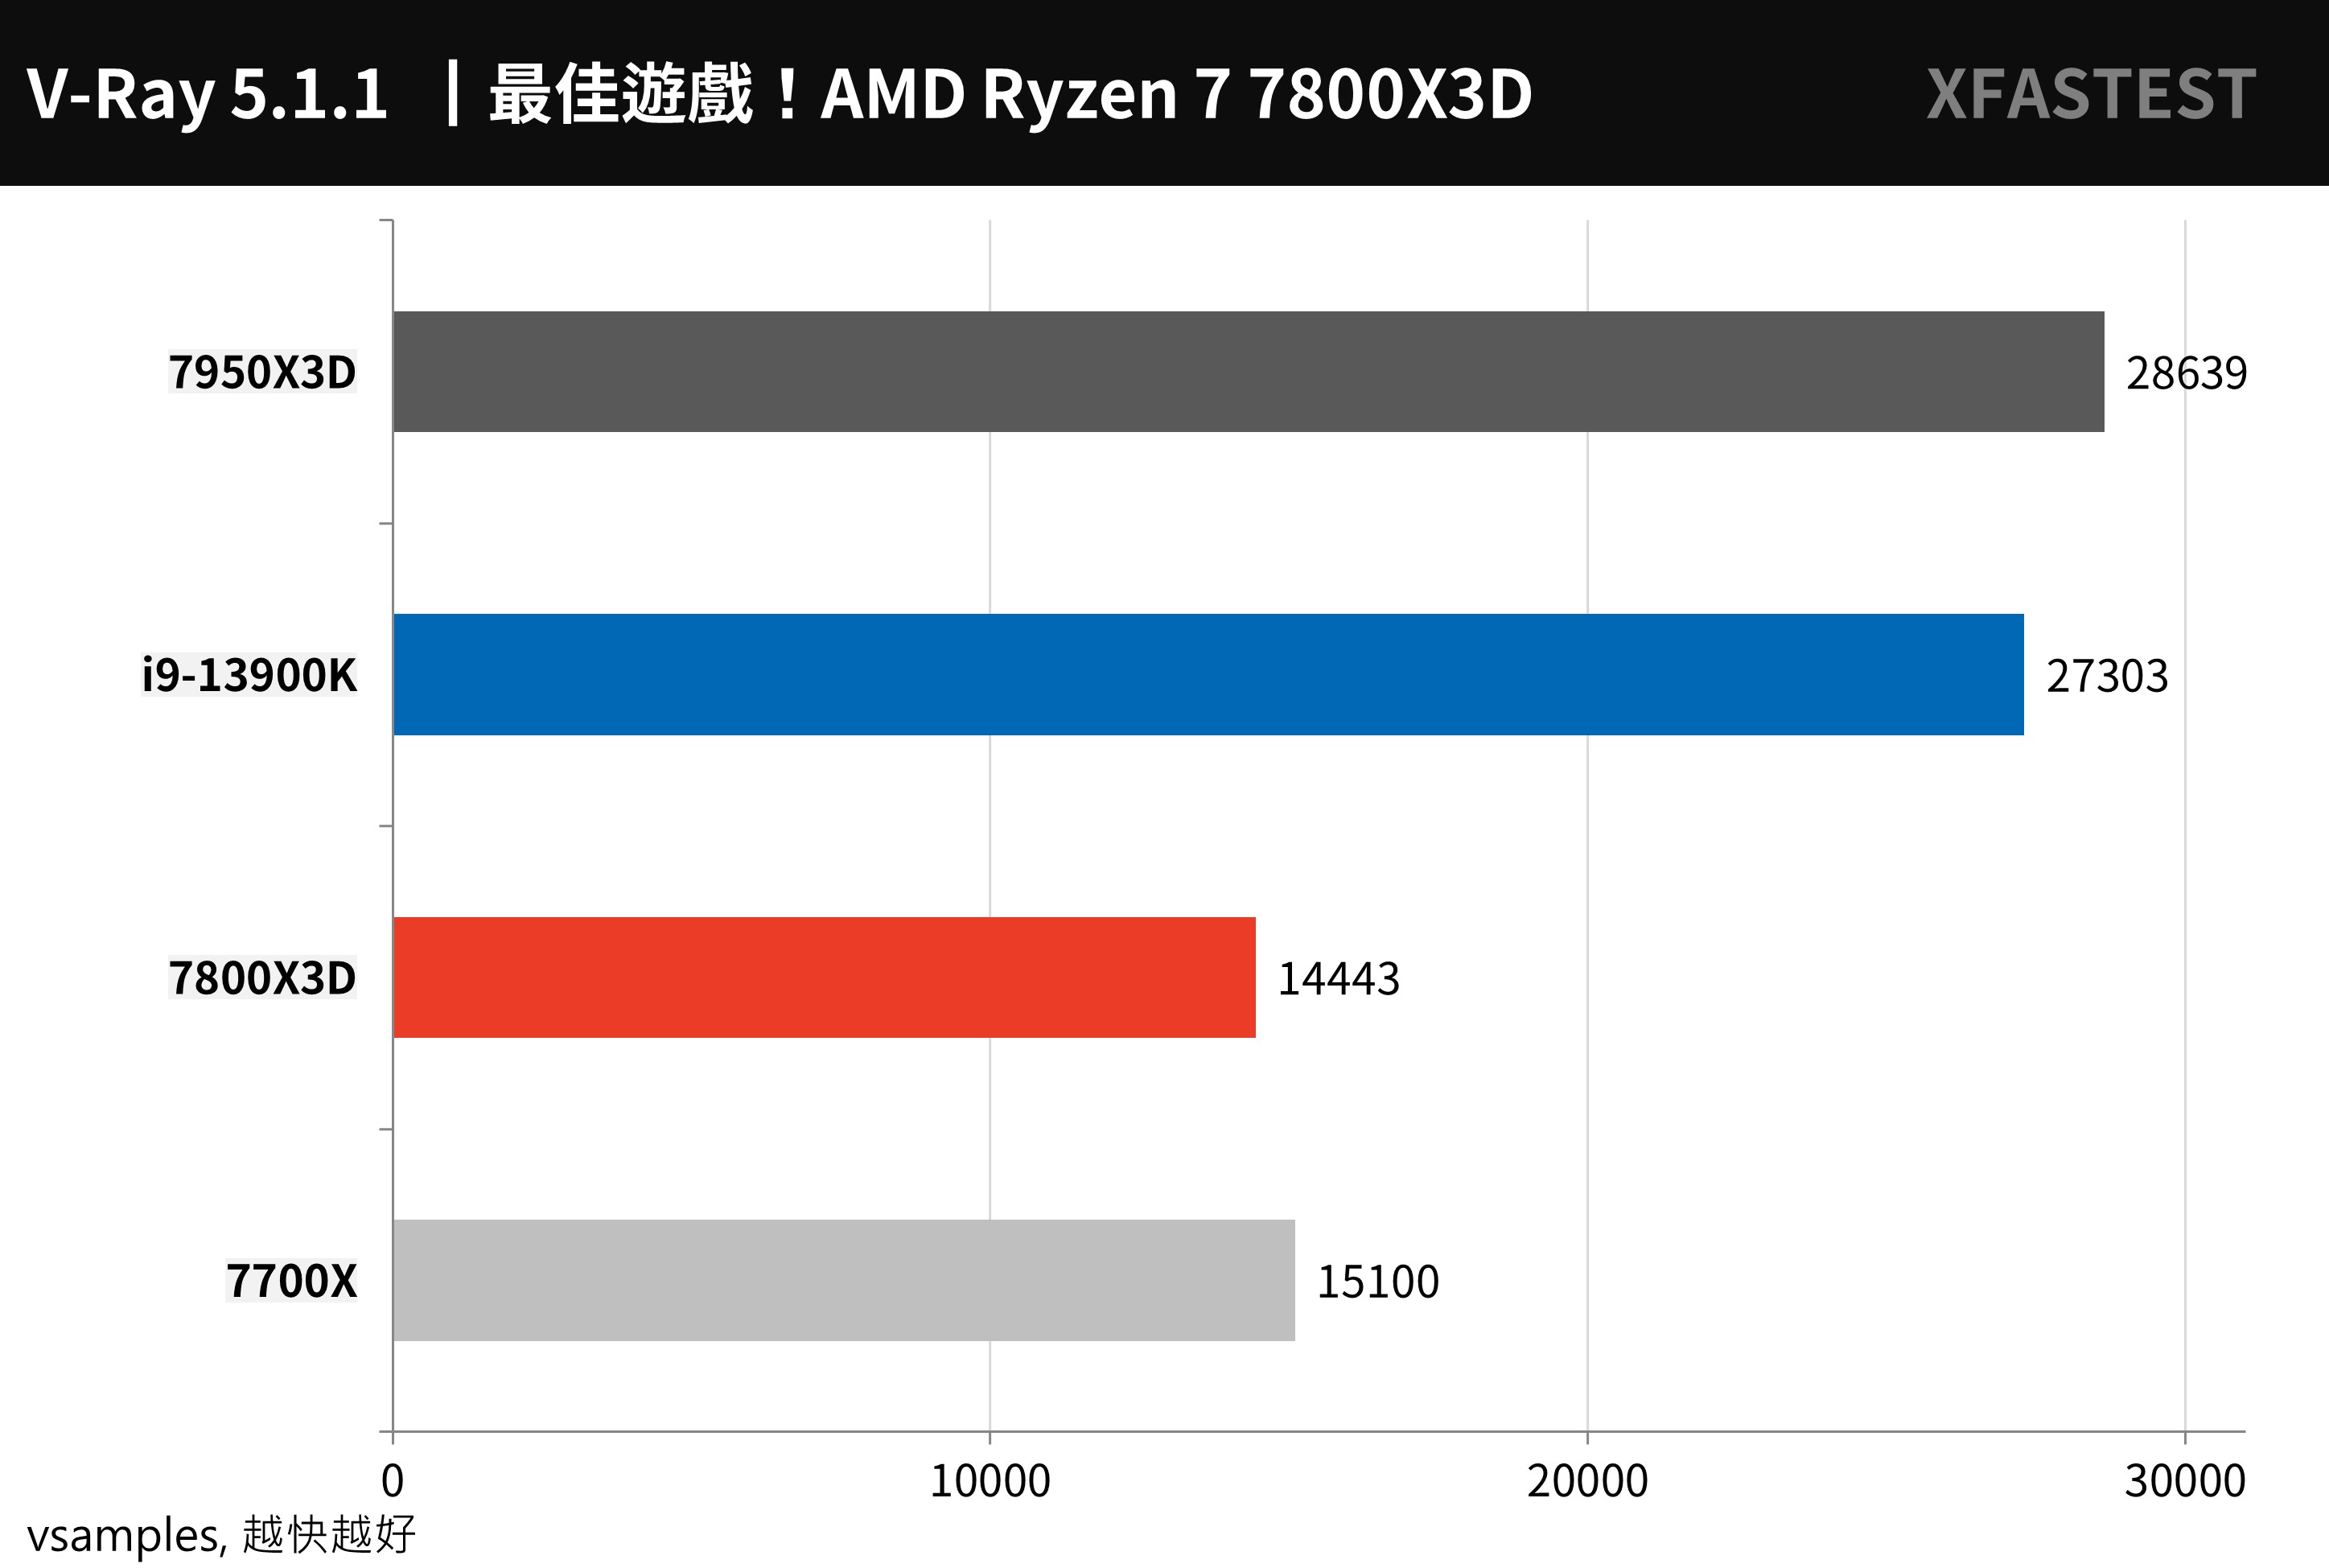
↑ V-Ray Benchmark, higher scores are better.
POV-Ray It is another set of free ray tracing 3D rendering tools, which uses the computing power of multi-core CPU to calculate the rendering of light and shadow and 3D images.
The 7800X3D achieves 6078.14 PPS, which is -11% lower than the 7700X.
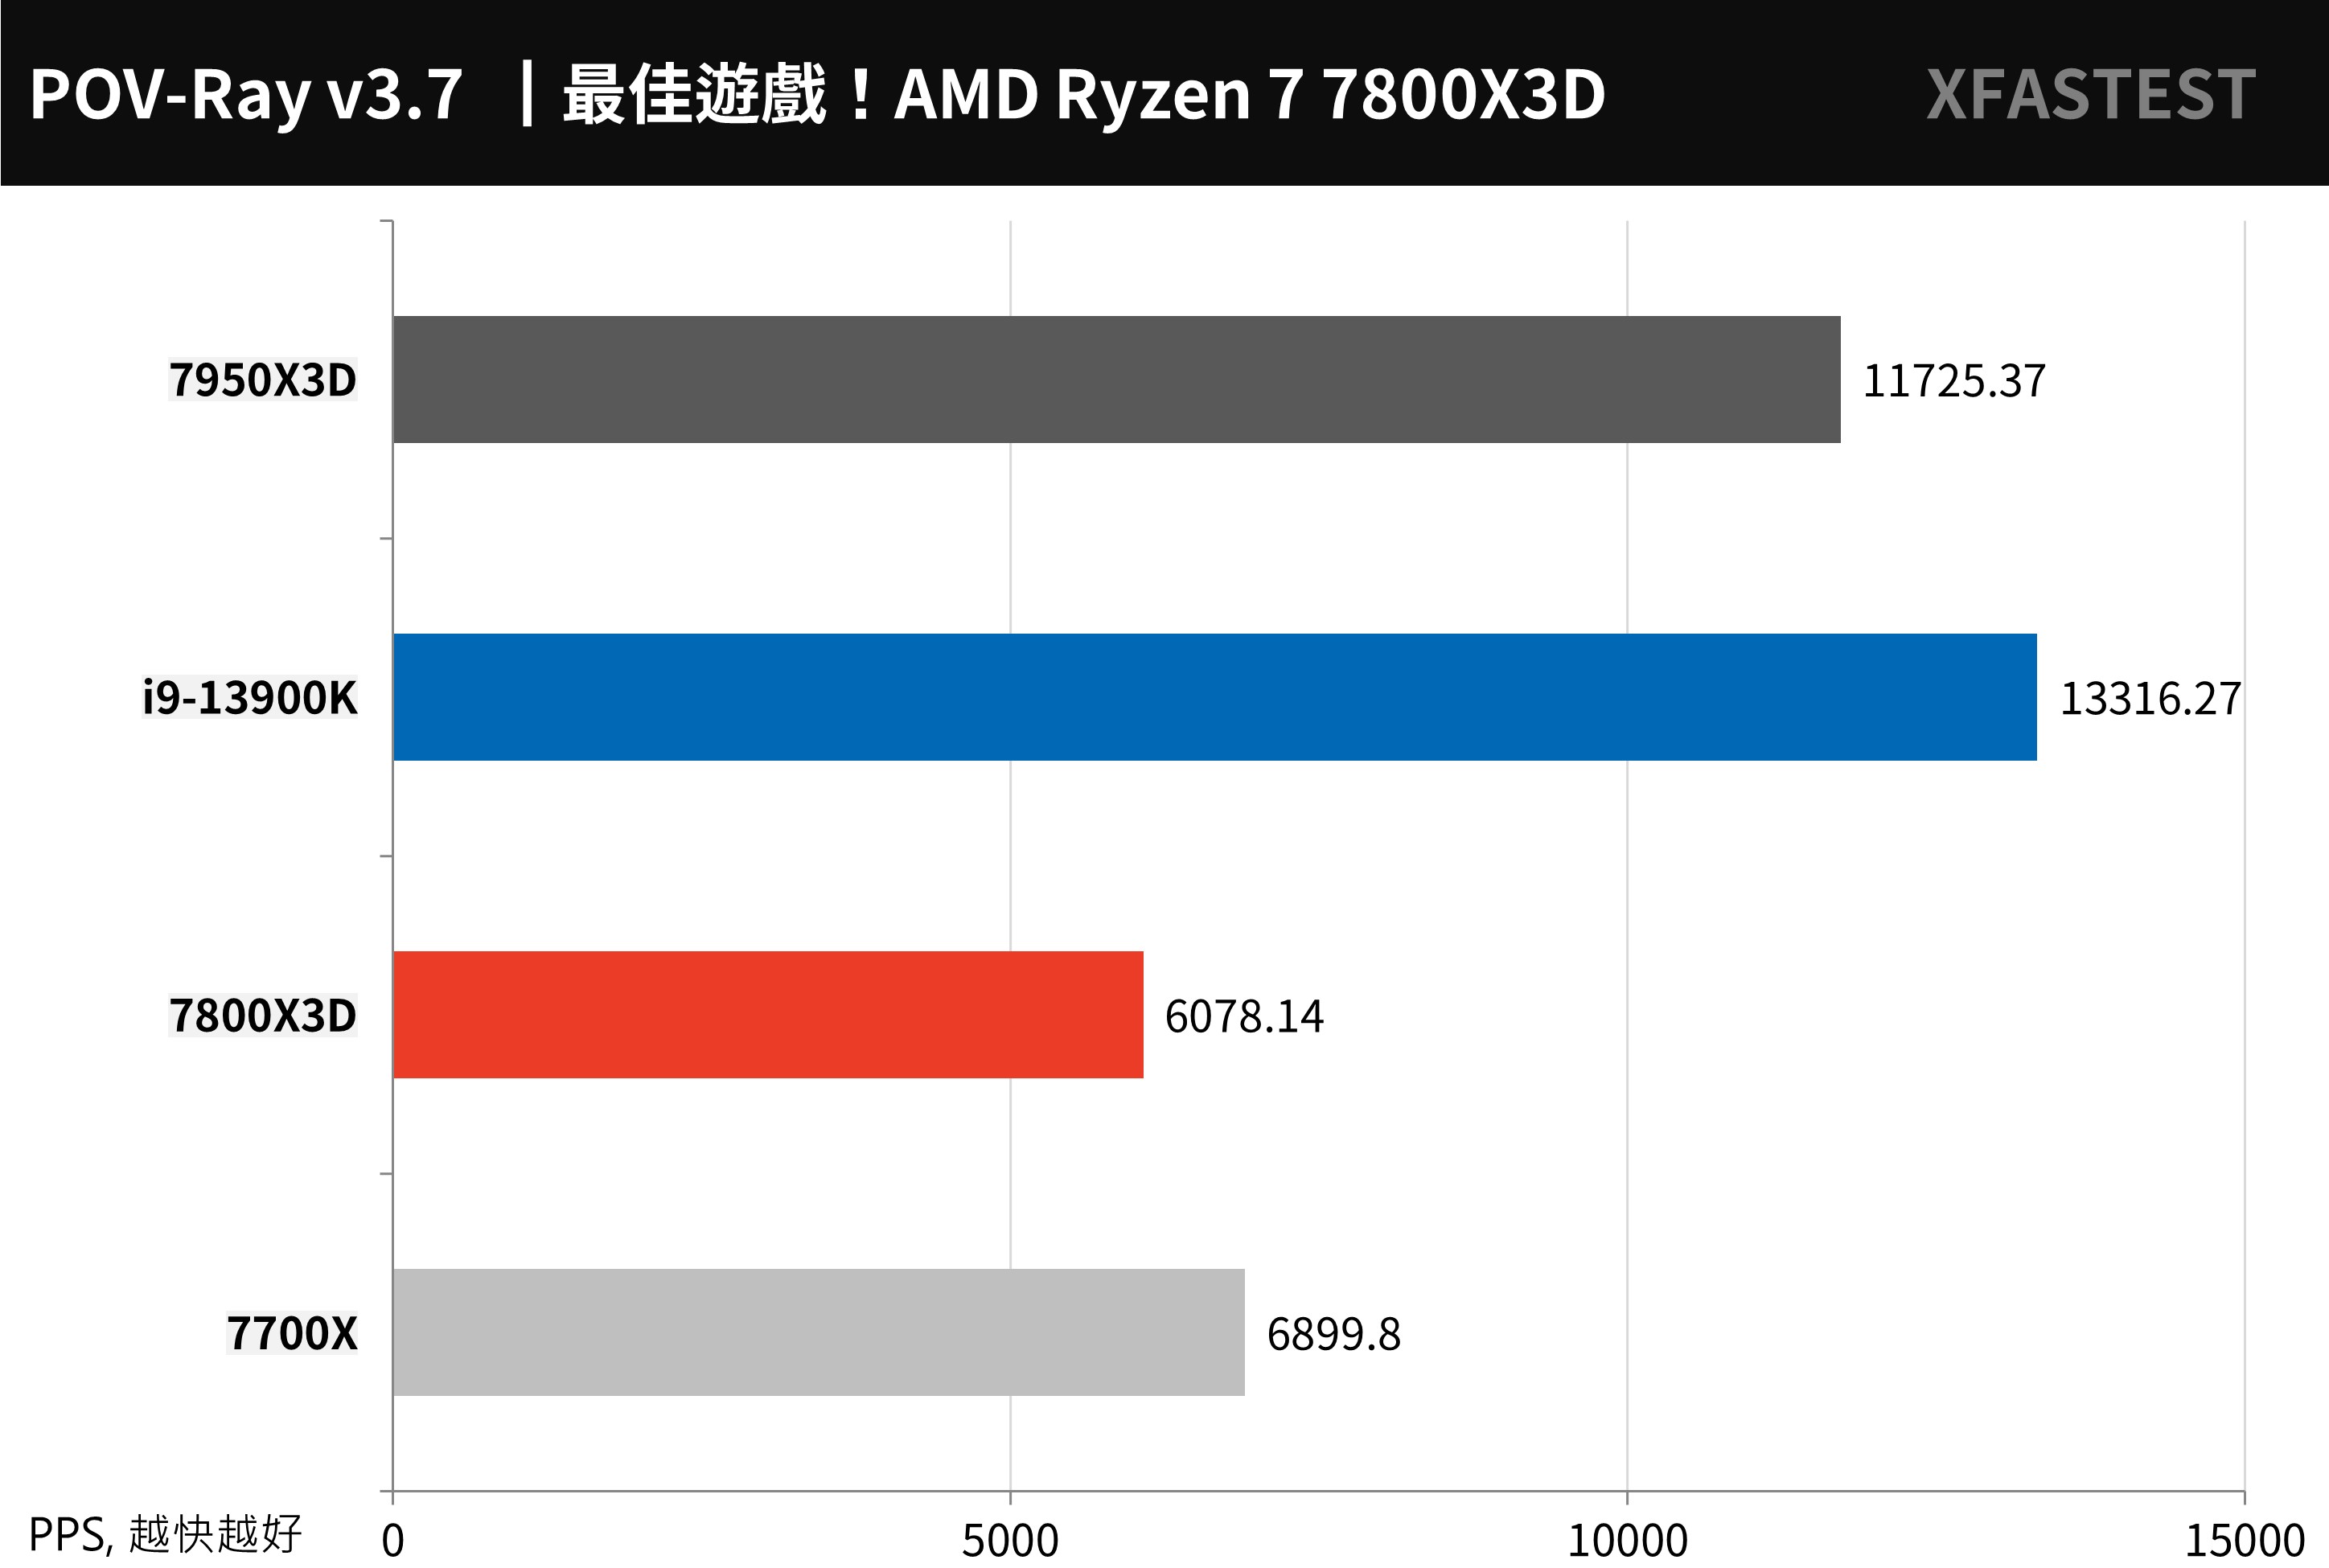
↑ POV-Ray, the higher the score the better.
Blender It is a cross-platform, open-source 3D creation tool that supports CPU and GPU rendering acceleration functions, as well as various 3D operations: Modeling, Rigging, Animation, Simulation, Rendering, Compositing and Motion Tracking, etc.
The performance of 7800X3D in classroom 63.088, junkshop 85.45, and monster 131.928 is -4.6% lower than that of 7700X.
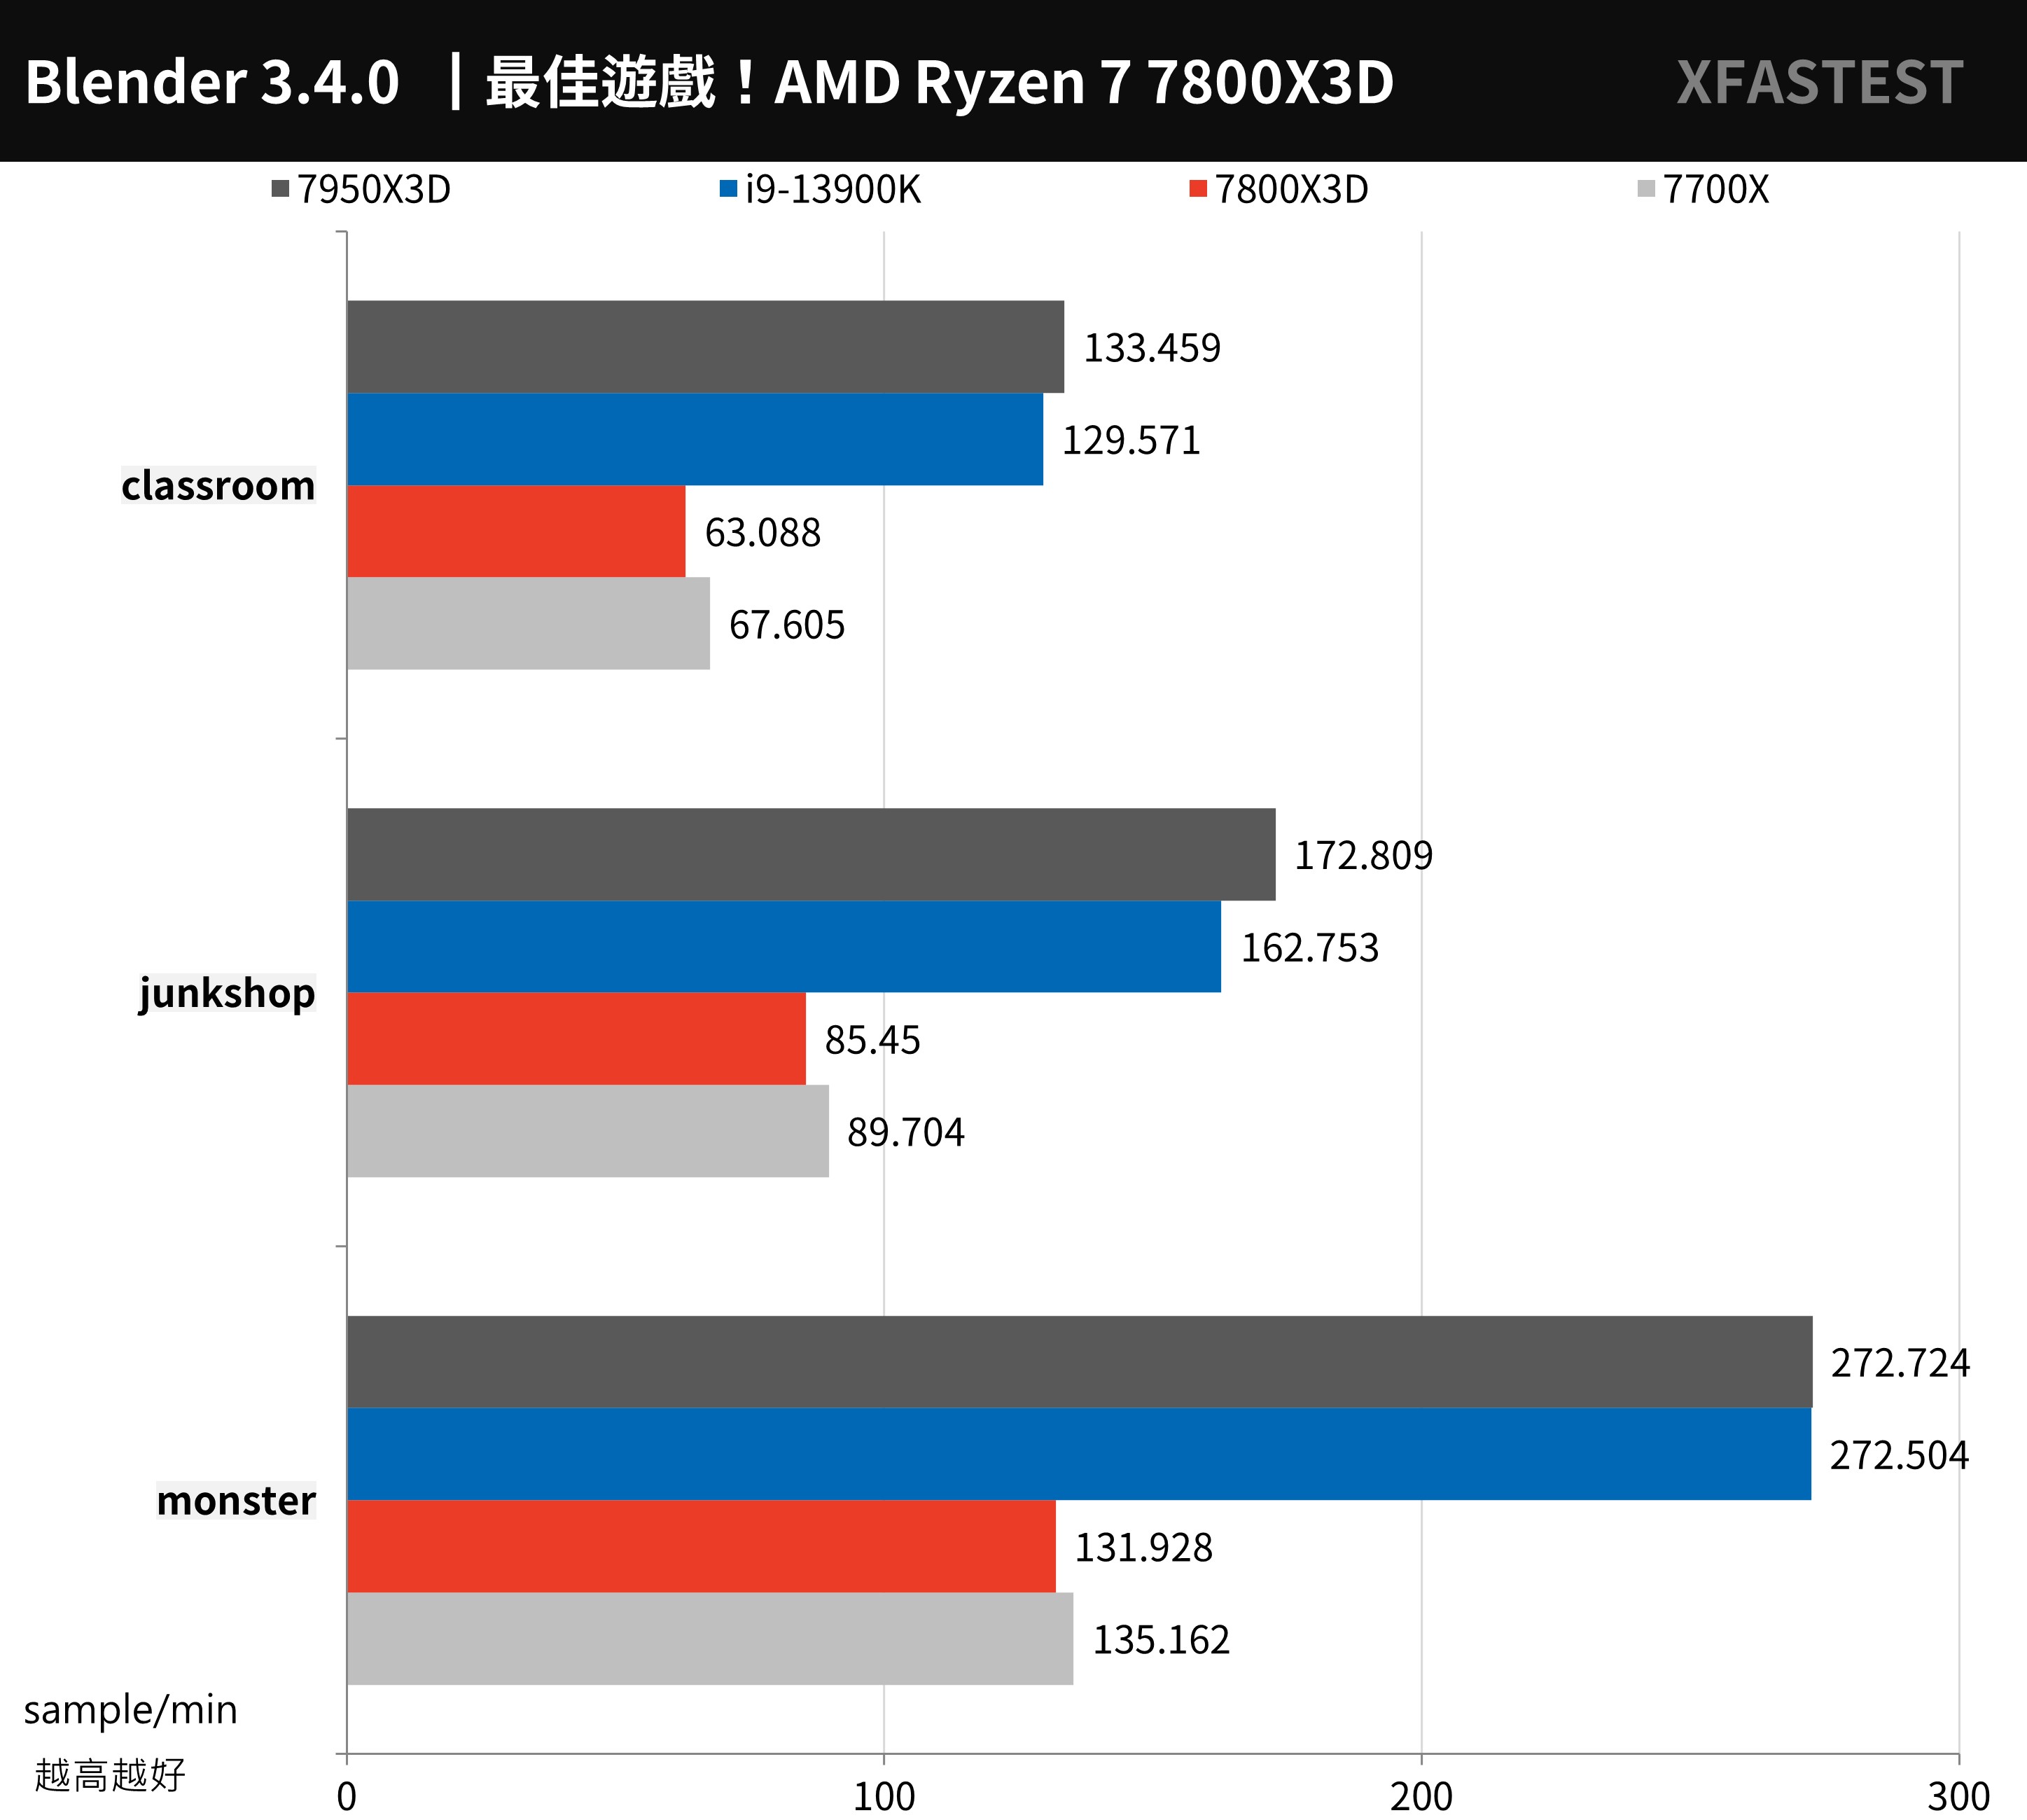
↑ Blender, the higher the score the better.
Creative PR image output, LR and PS photo editing performance test
For the conversion output test of Adobe Premiere Pro 2020, this time using UL Procyon Video Editing Benchmark Test tool, the test scenario is to use 2160p 30/60 FPS video, output as H.264 – YouTube 1080p Full HD and HEVC (H.265) – 4K UHD format respectively, and compare the output performance of pure CPU output and adding GPU acceleration .
The 3D output performance of 7800X is 8670 points, which is slightly slower than 7700X, but the difference in performance is even smaller if GPU acceleration is added.
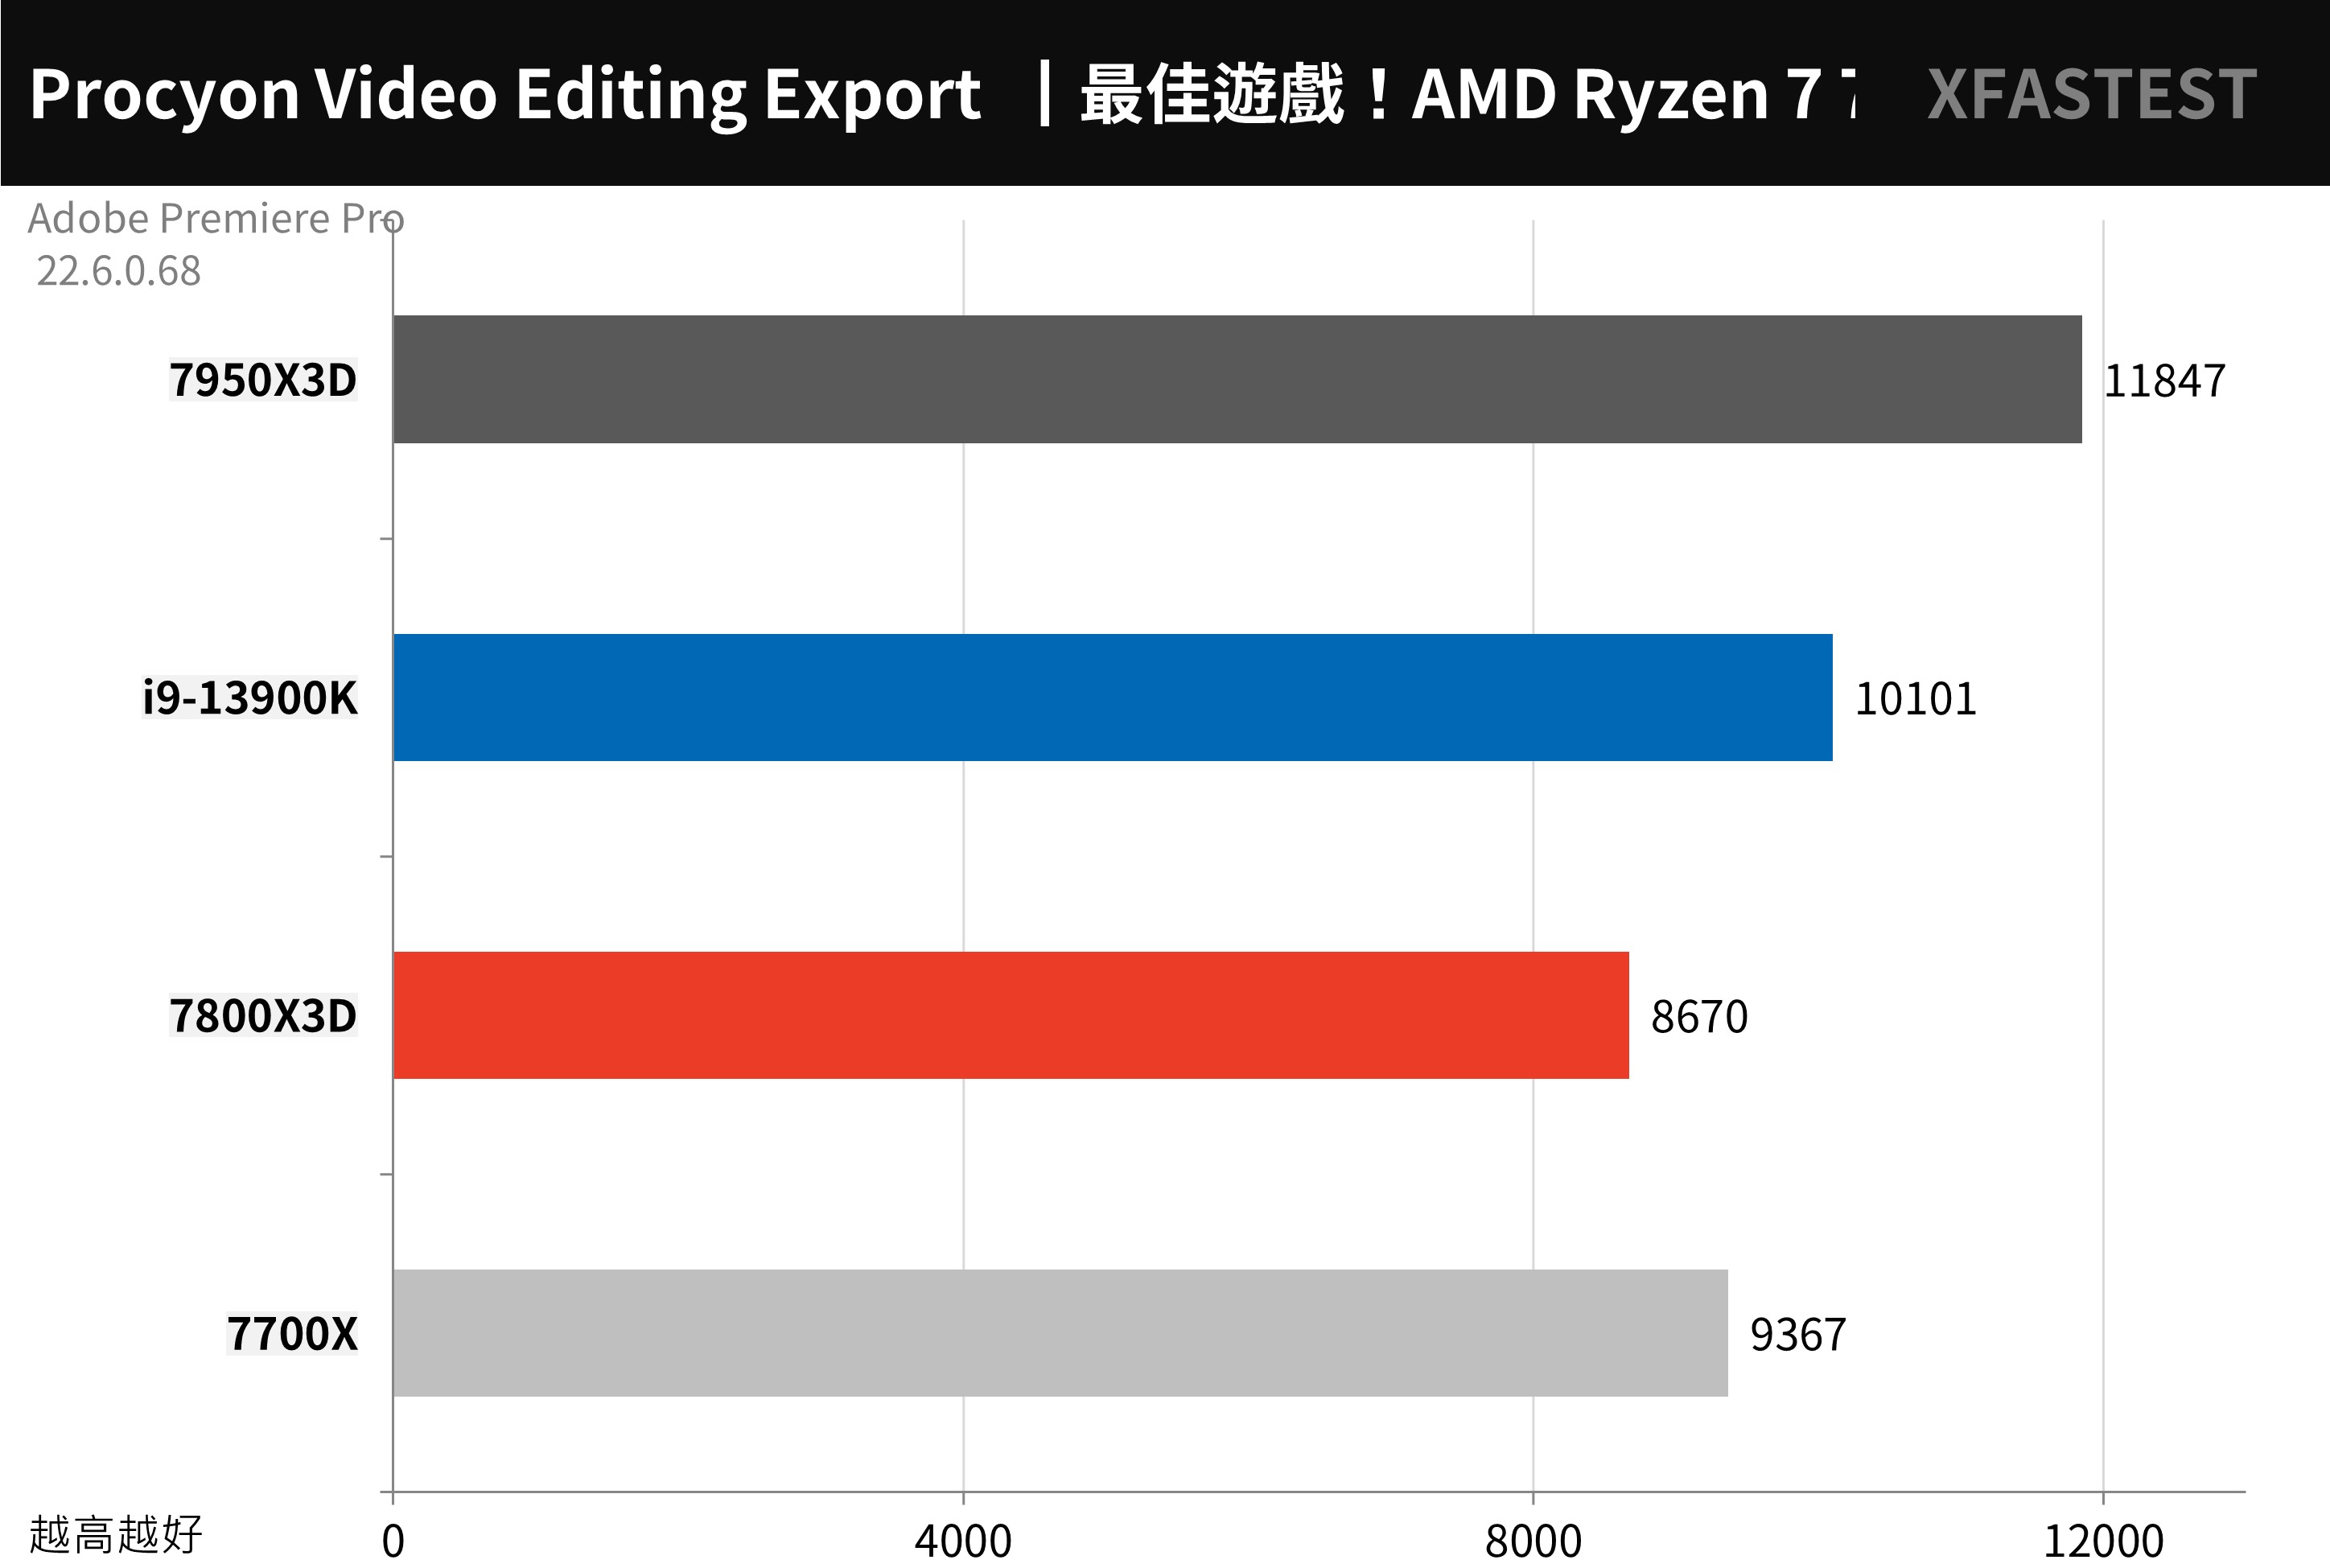
↑ UL Procyon Video Editing Benchmark, the higher the score, the better.
Adobe Photoshop and Lightroom Classic through UL Procyon Photo Editing Benchmark Test tool; the two working conditions of the test, Image Retouching test is to use Photoshop to retouch photos, and record the time of each step, while Batch Processing test is to use Lightroom to adjust and output a large number of photos in batches.
7800X3D got a total score of 11457 points, but still lost to 7700X in terms of overall performance.
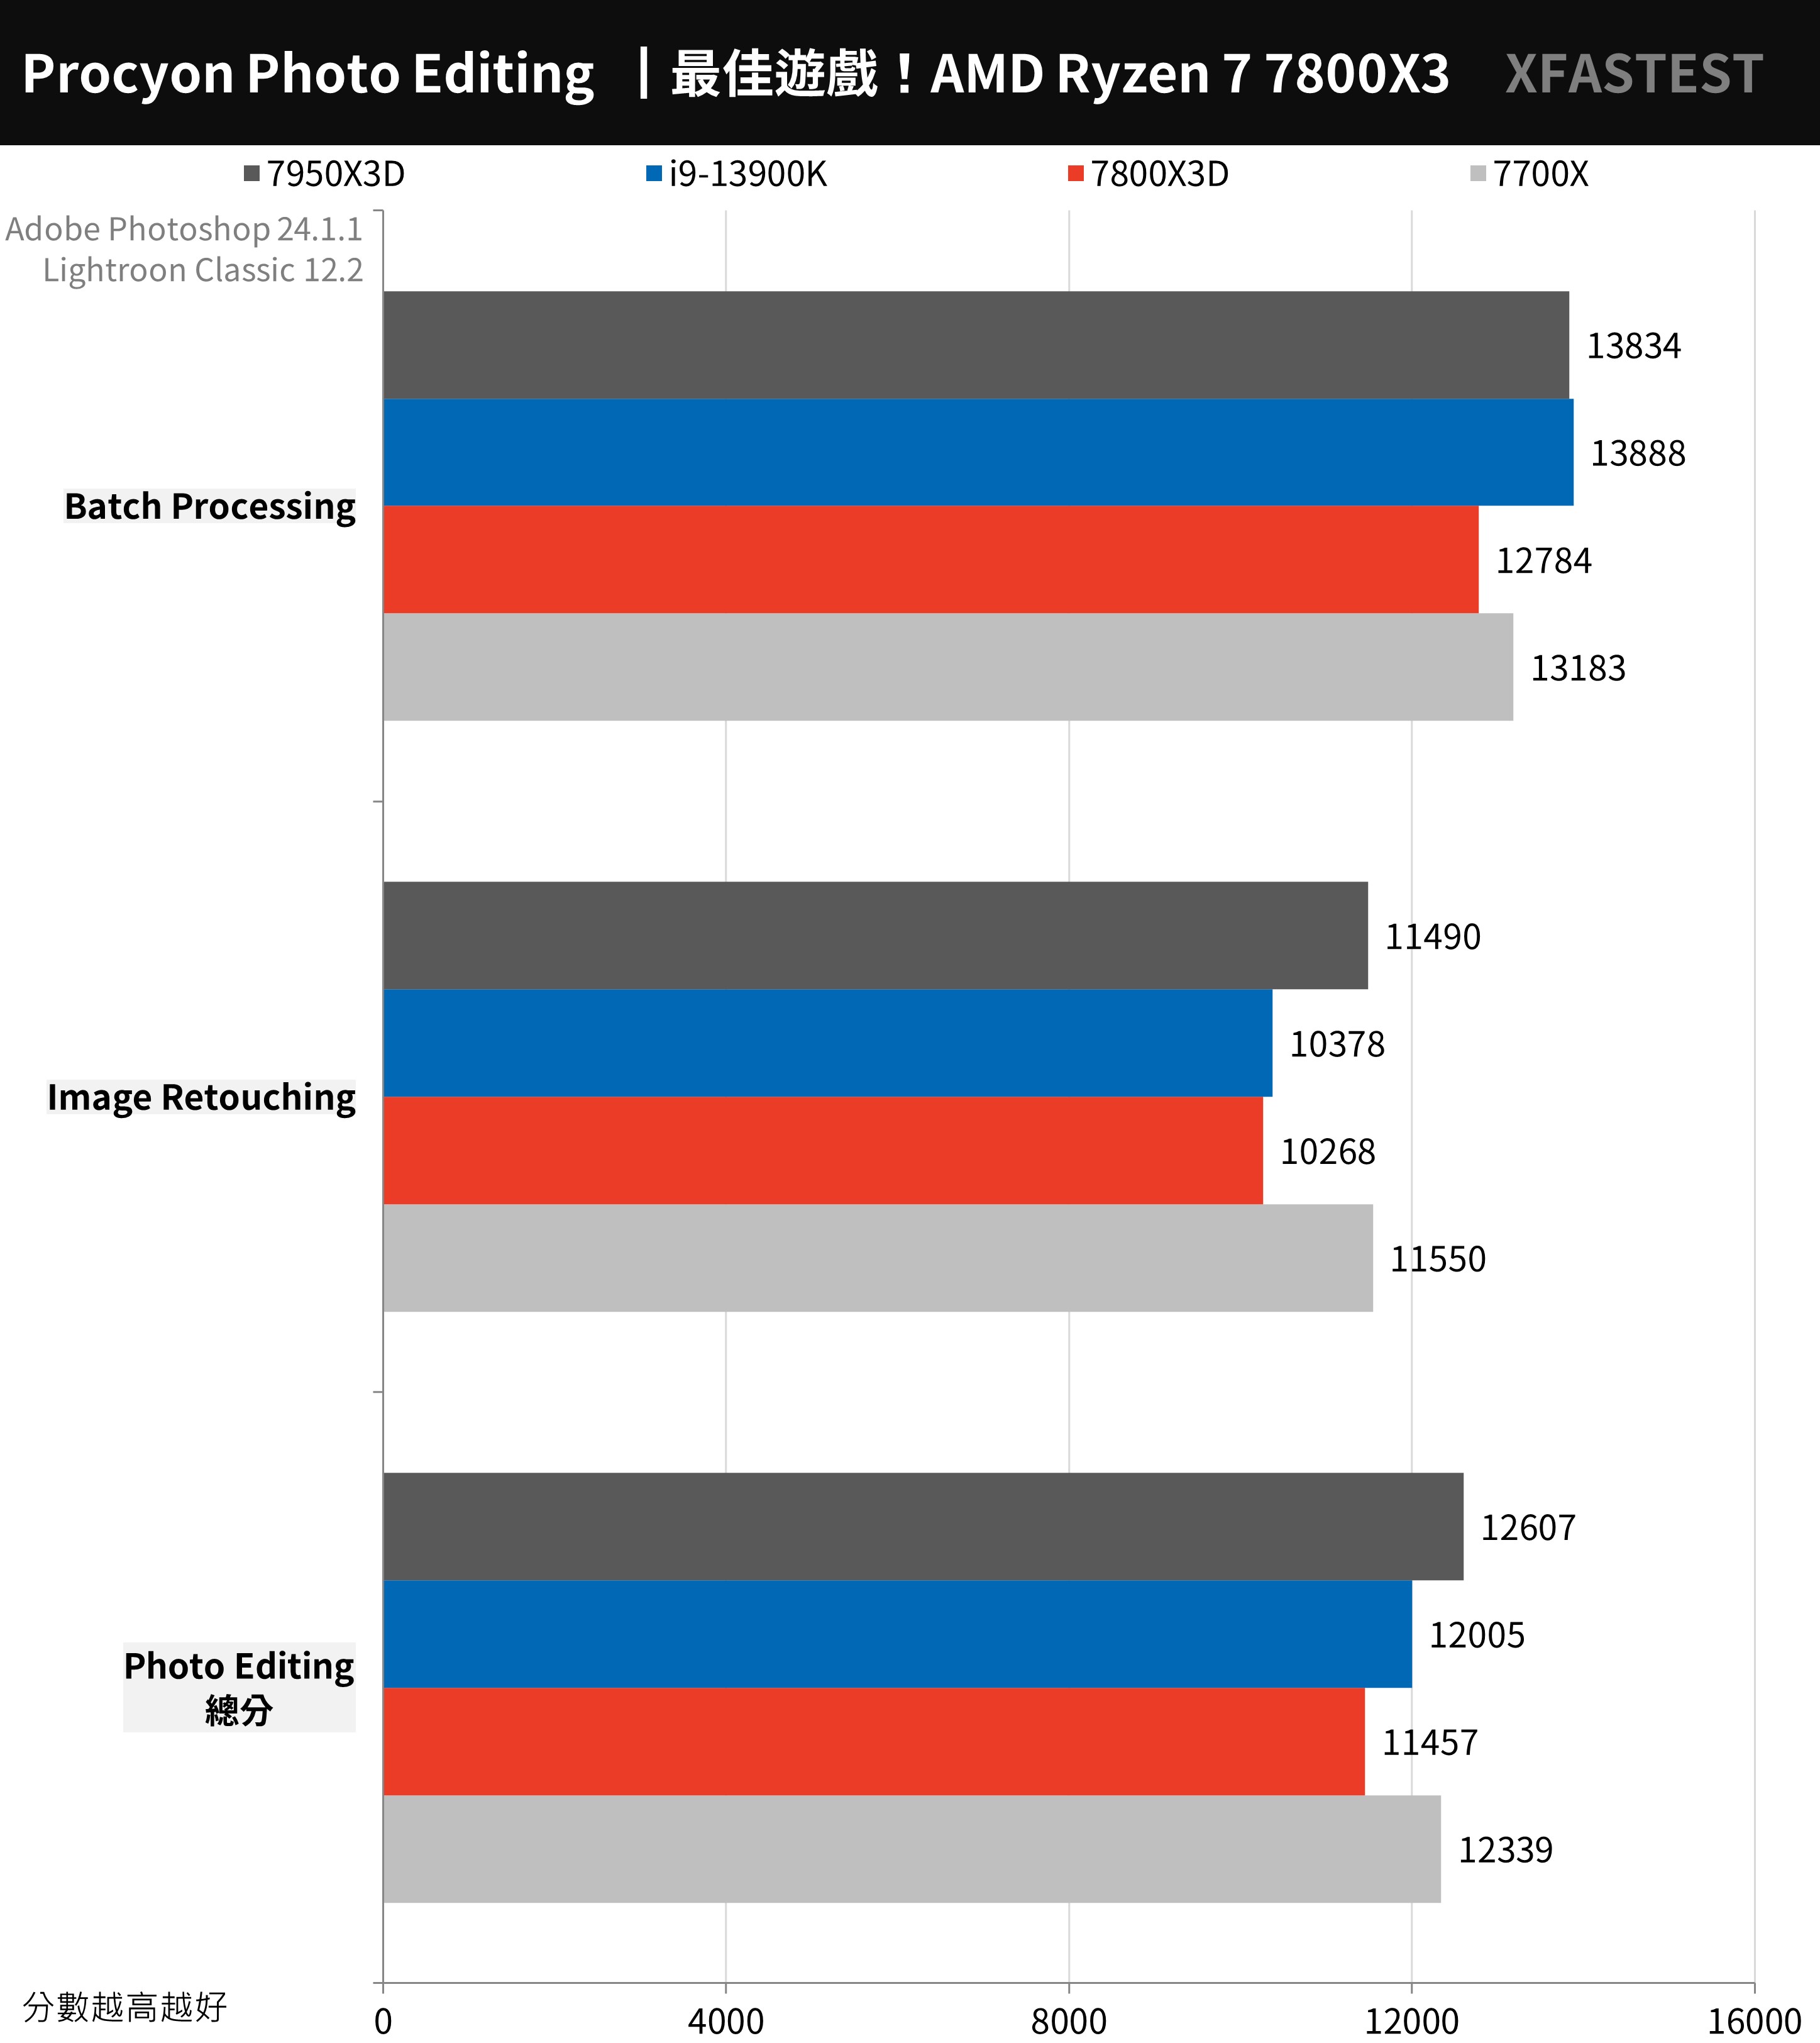
↑ UL Procyon Photo Editing Benchmark, the higher the score, the better.
AIDA64 processor memory, 7-Zip compression test
Memory tests use AIDA64 To carry out, use G.SKILL TRIDENT Z5 NEO DDR5-6000 16GBx2 memory.
The memory performance of the 7800X3D is comparable to that of the 7700X, reading 59500 MB/s and writing 80781 MB/s. In terms of memory delay, 7800X3D 68.4ns, 7700X 64.2ns.
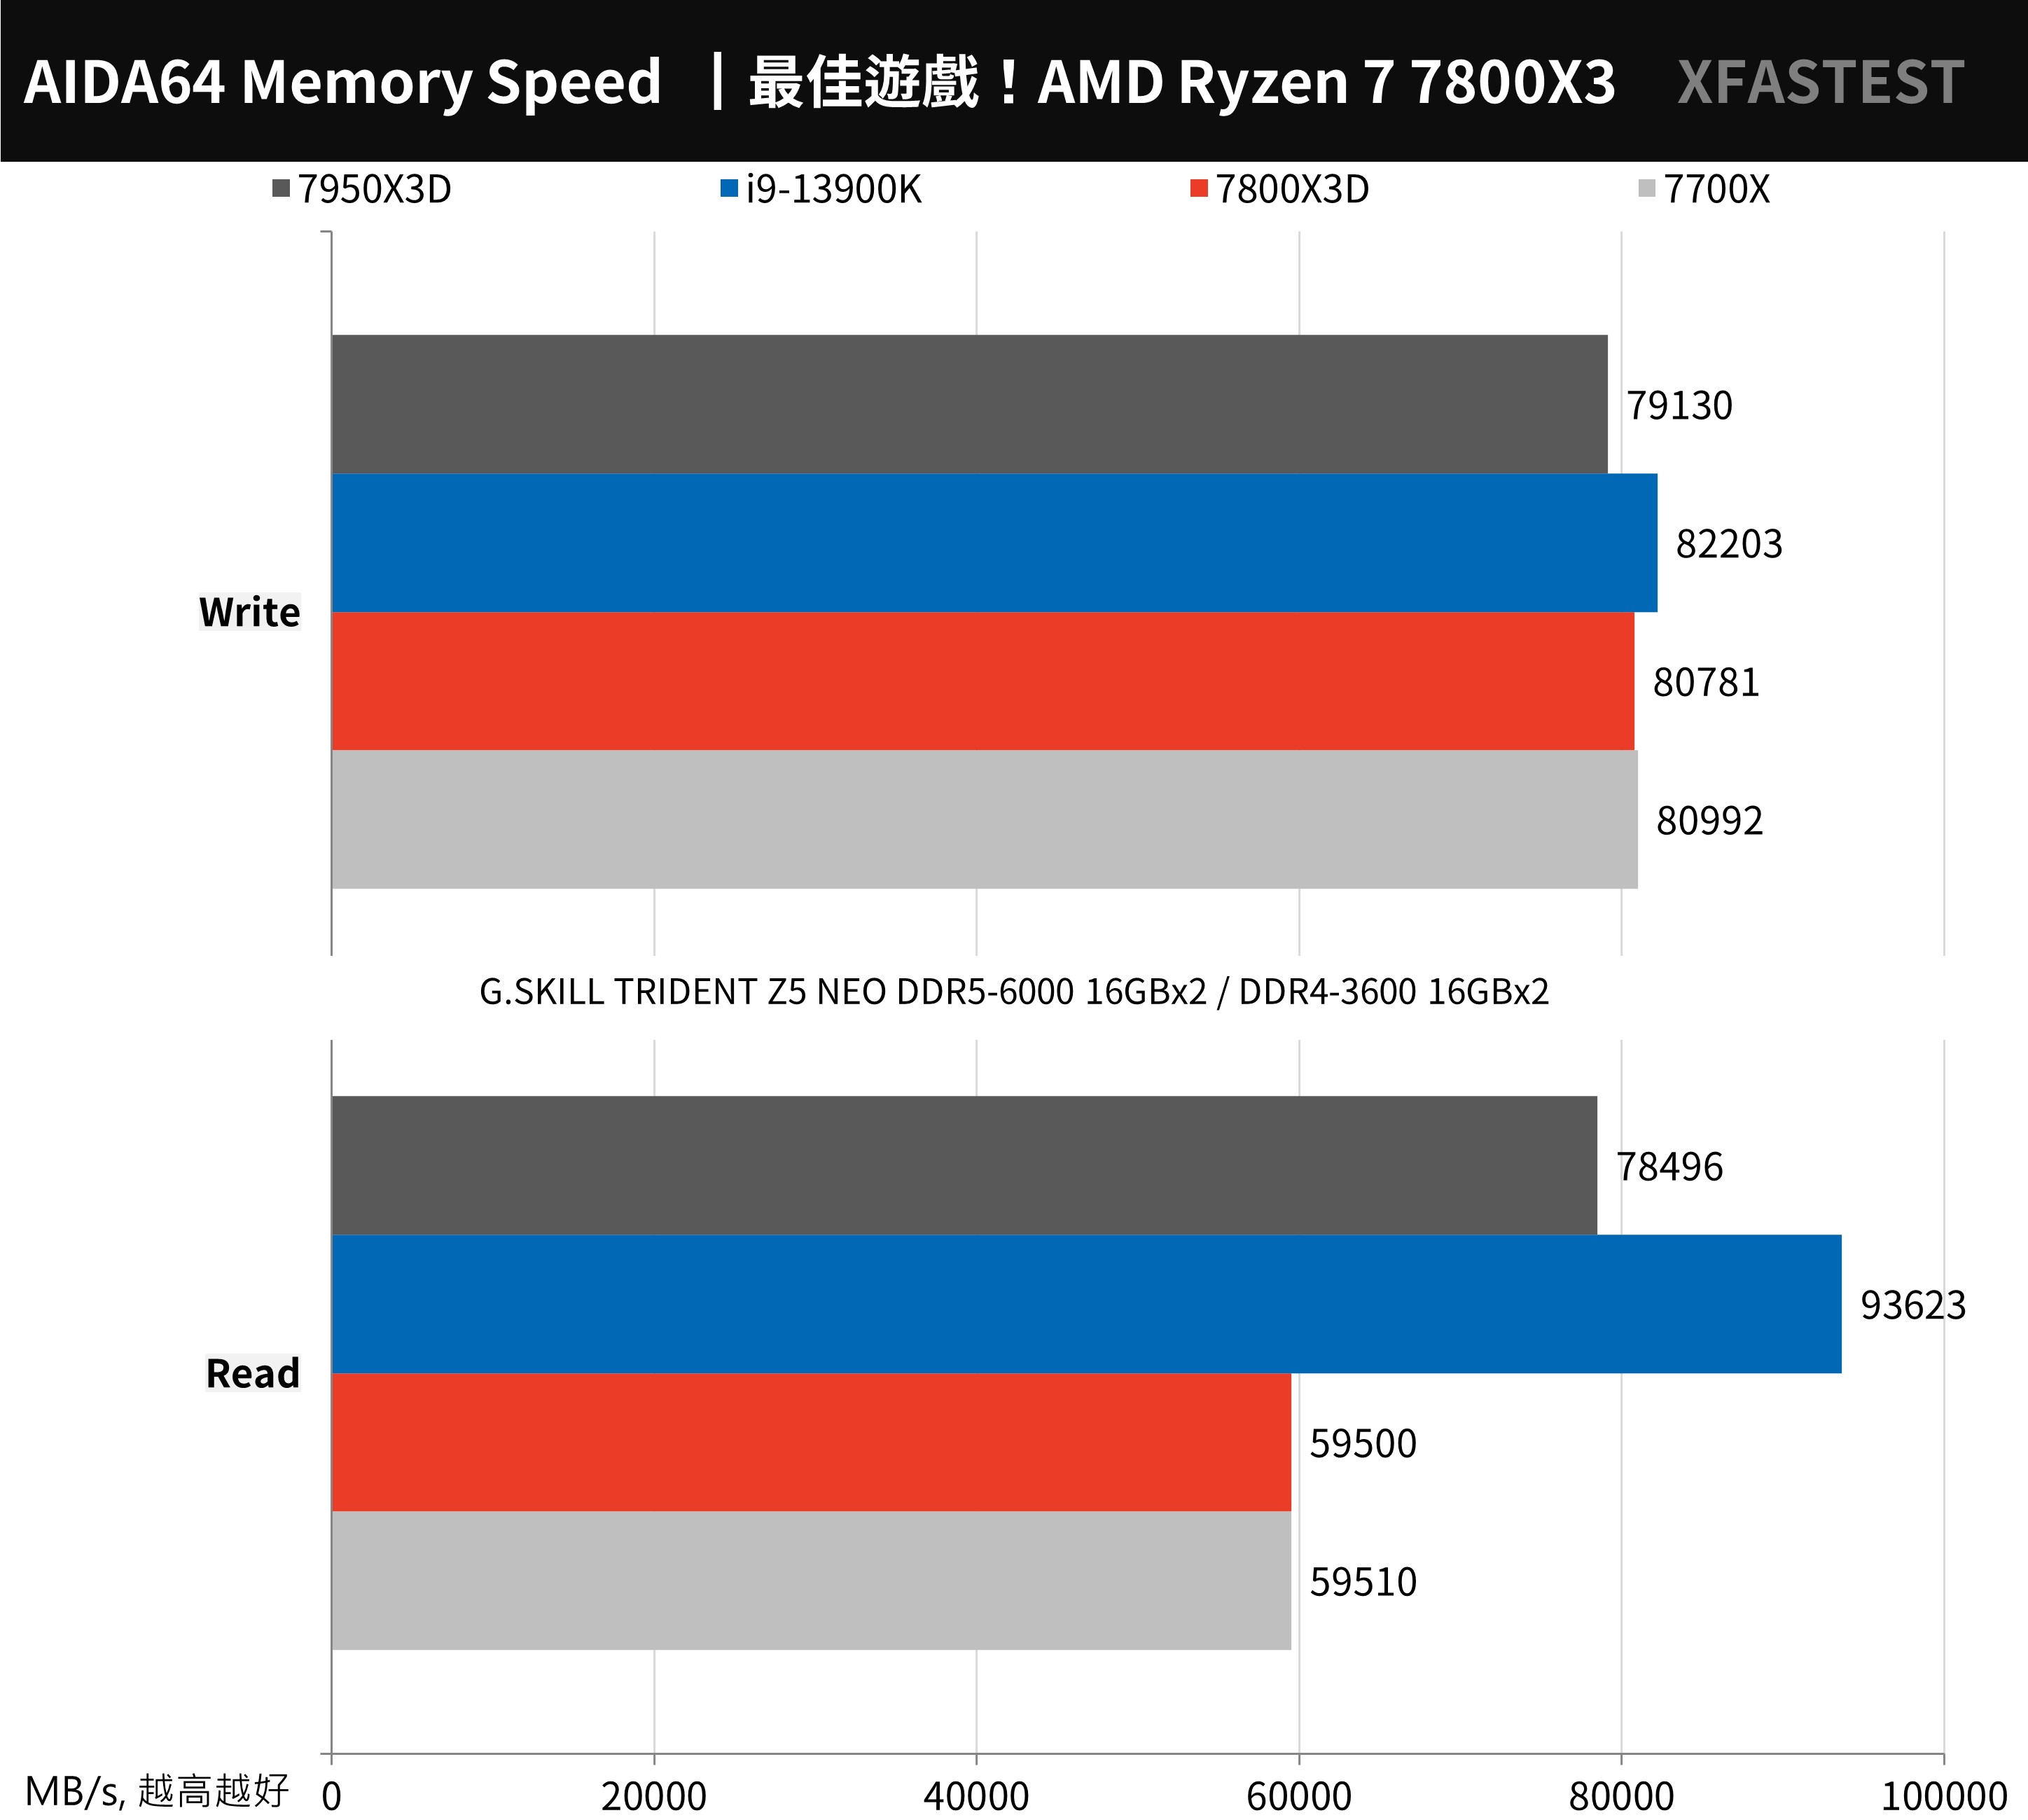
↑ AIDA64 memory bandwidth test.
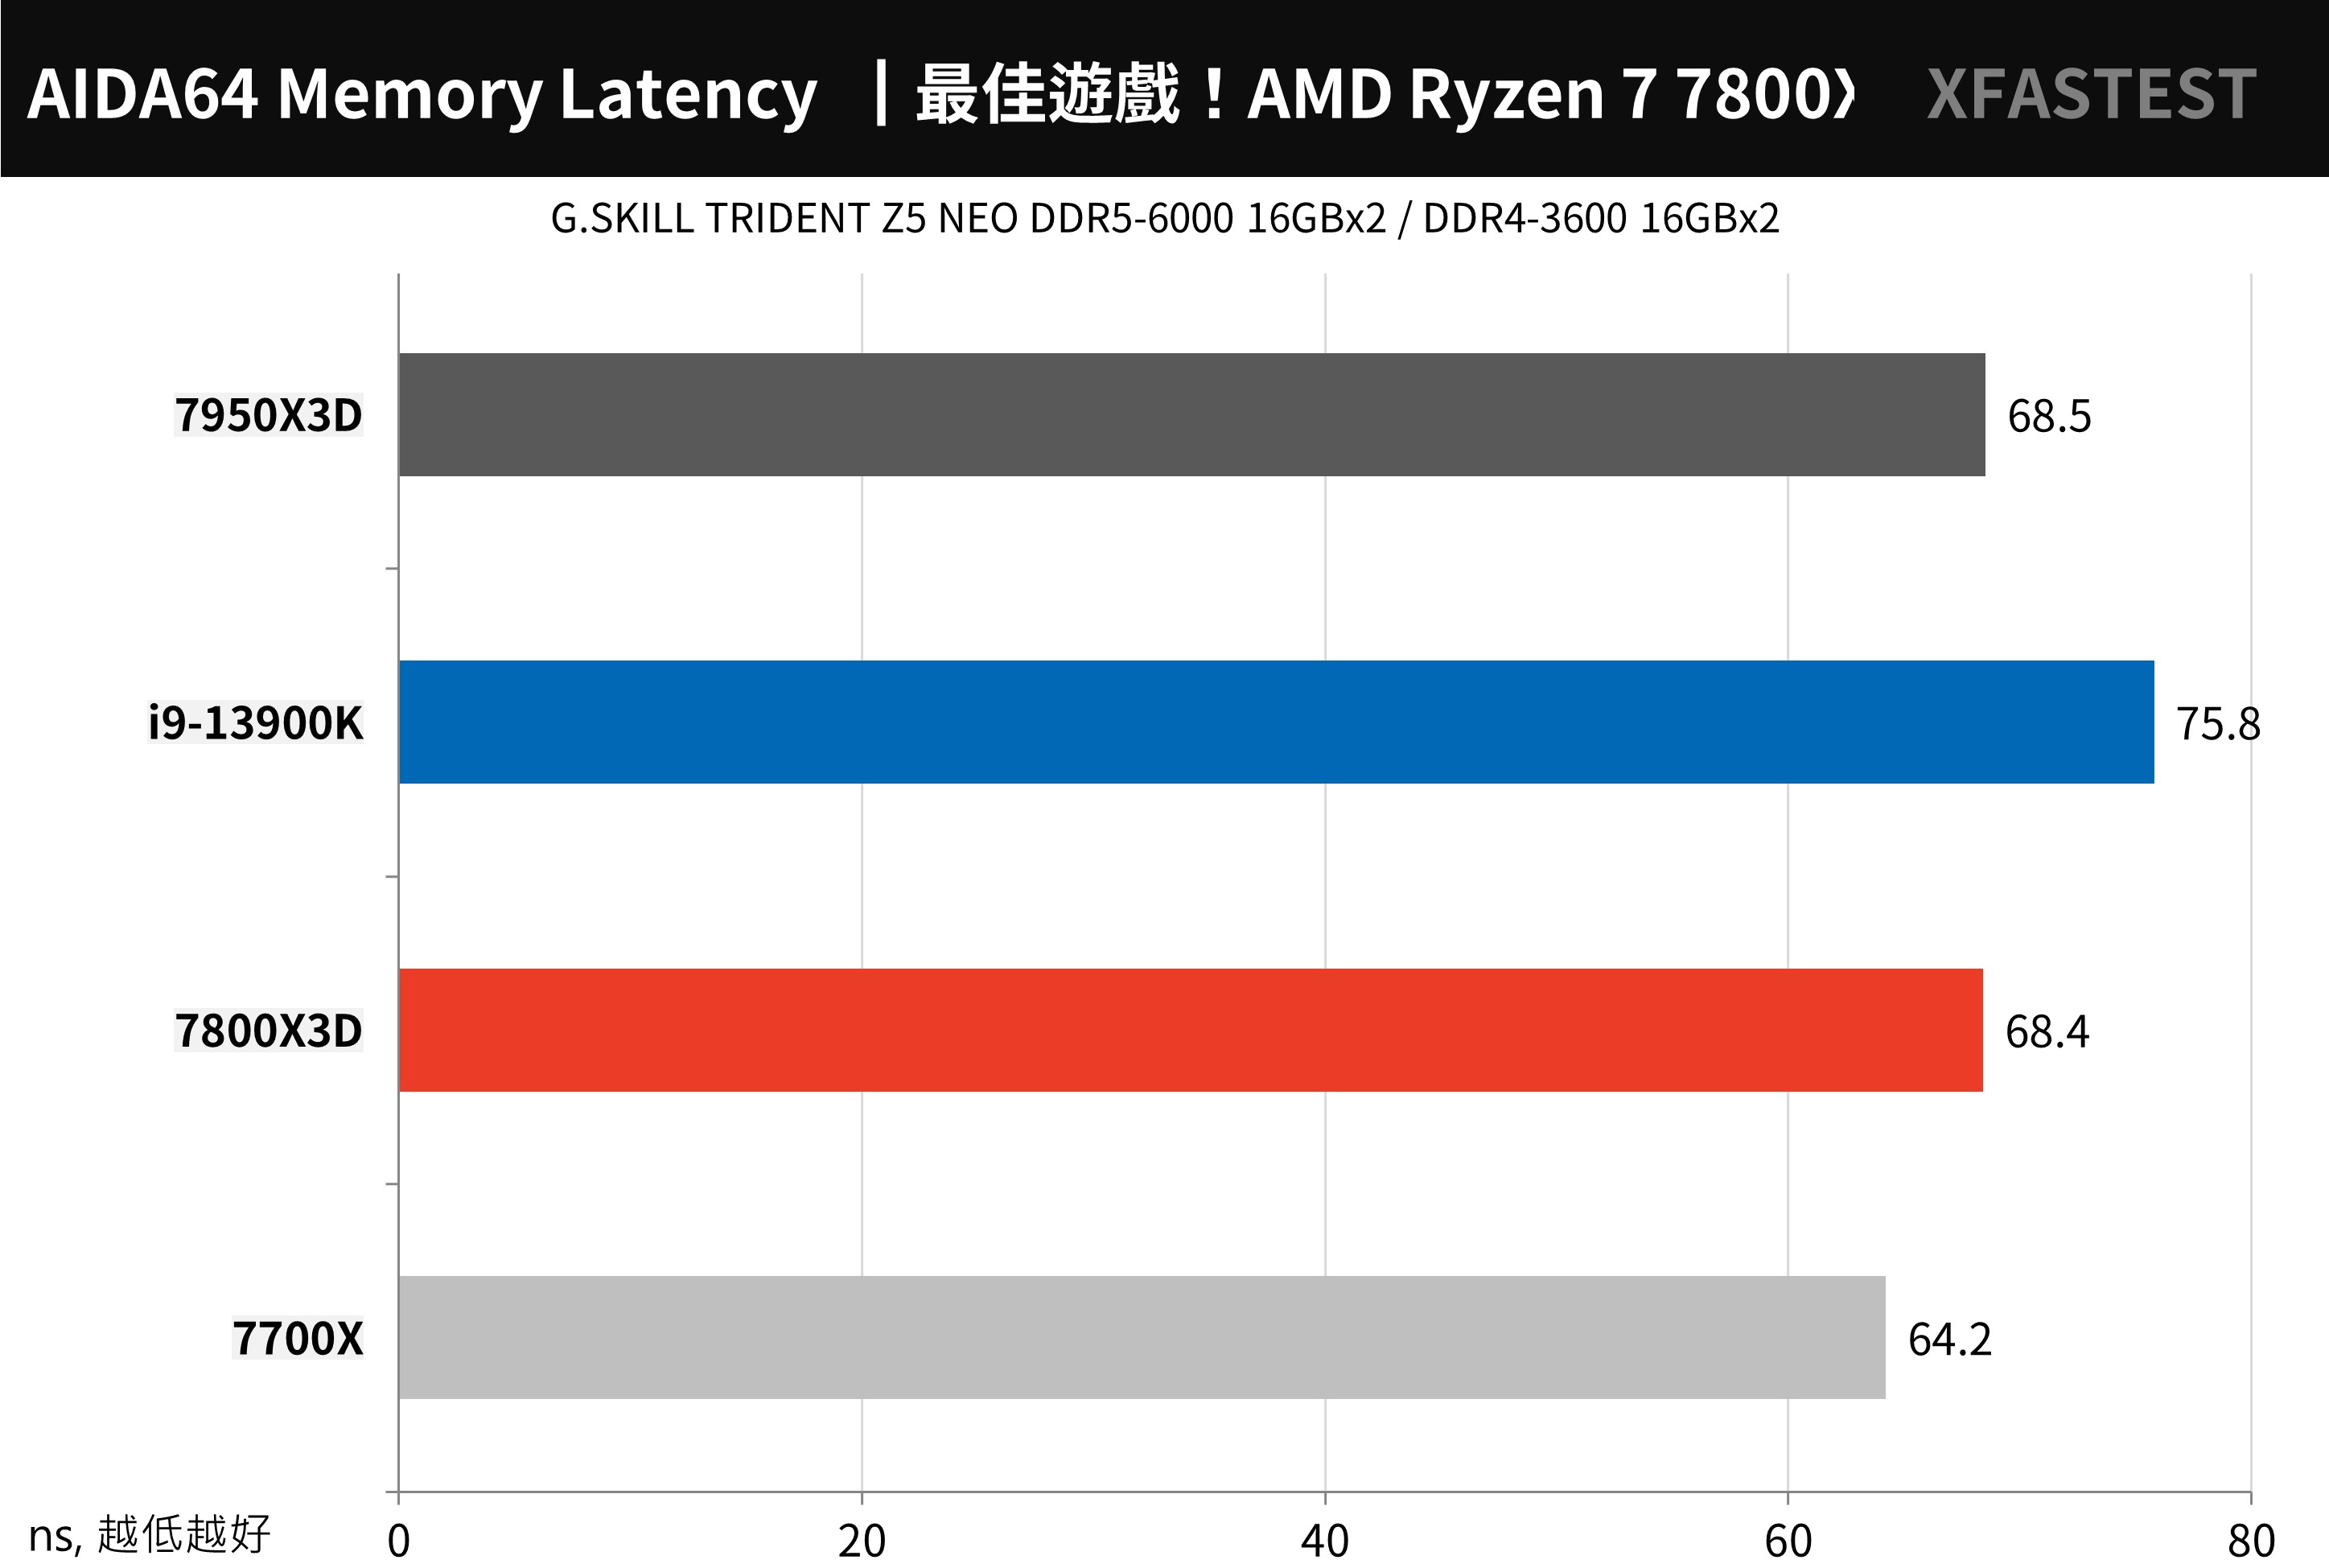
↑ AIDA64 memory latency test.
WinRAR The most commonly used compression tools should be one of the few programs that rely on L3 cache to speed up performance. The performance of 7800X3D reaches 52258 KB/s, which is 27.5% faster than that of 7700X. This is also an example of a small number of applications that benefit from L3 caching.
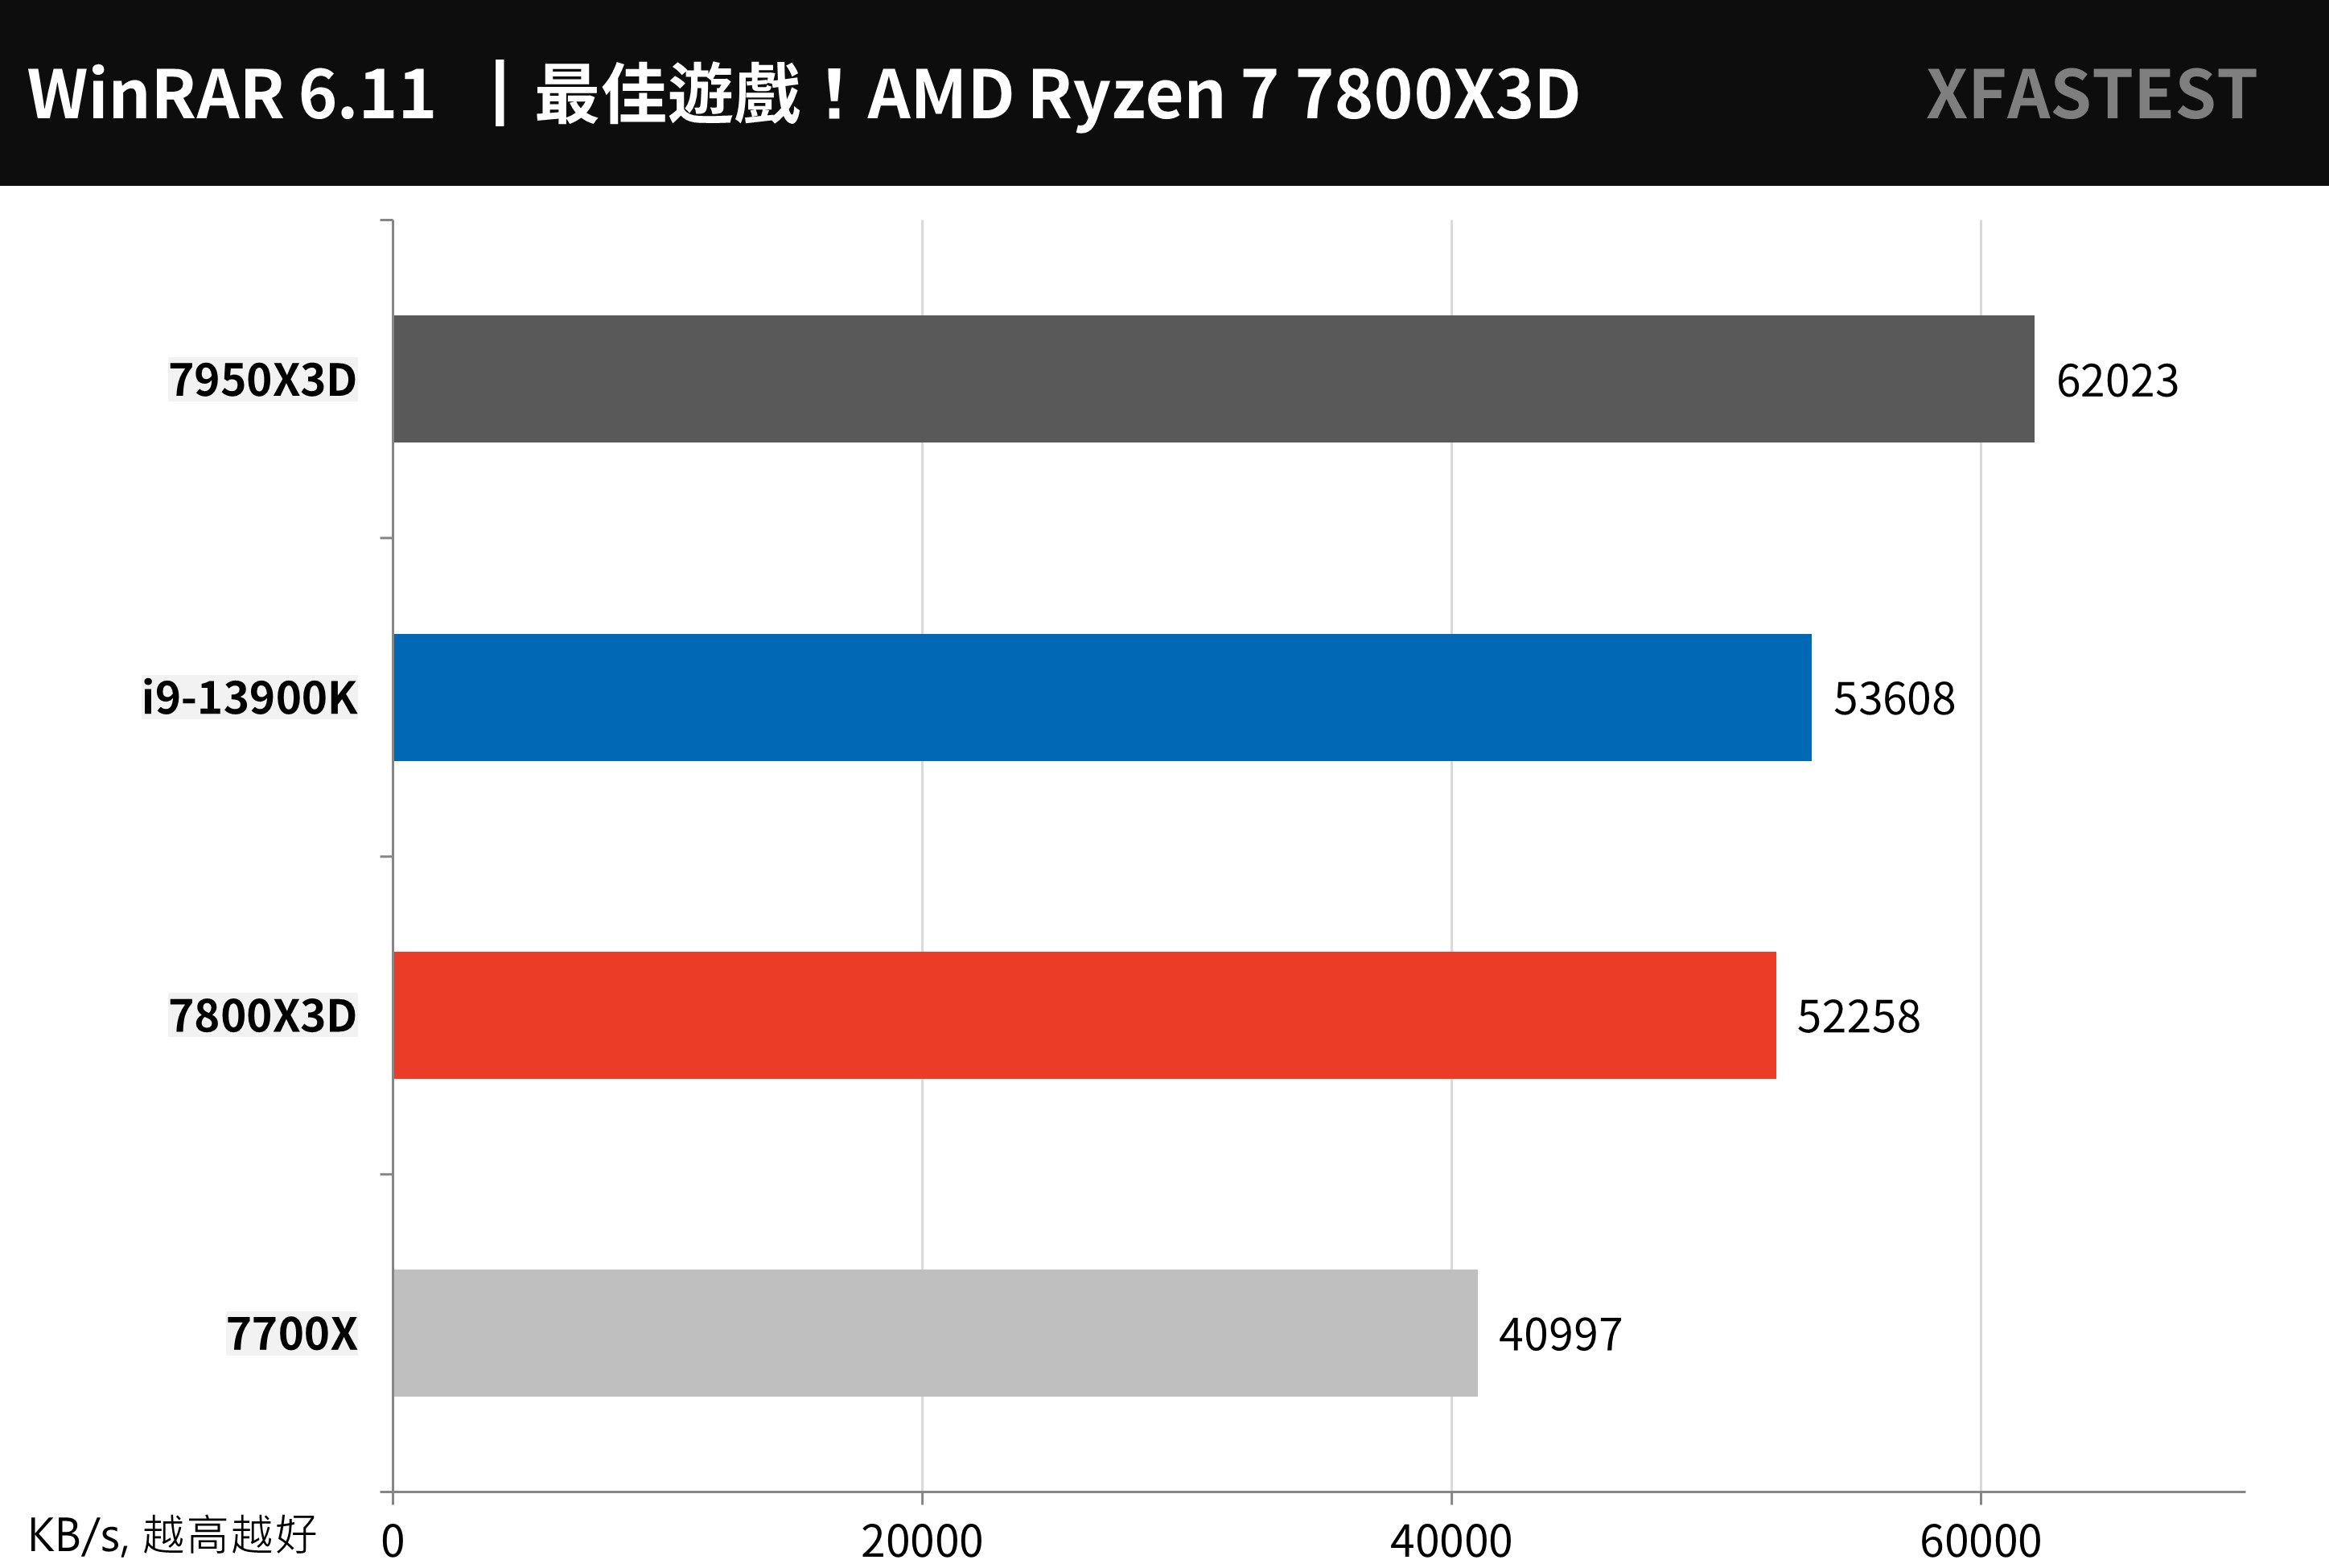
↑ WinRAR, the more performance the better.
7-Zip Another well-known and free compression tool can effectively utilize the performance of multiple cores. The 7800X3D compresses 120.017 GIPS and decompresses 132.042 GIPS. The performance is slightly lower than that of the 7700X.
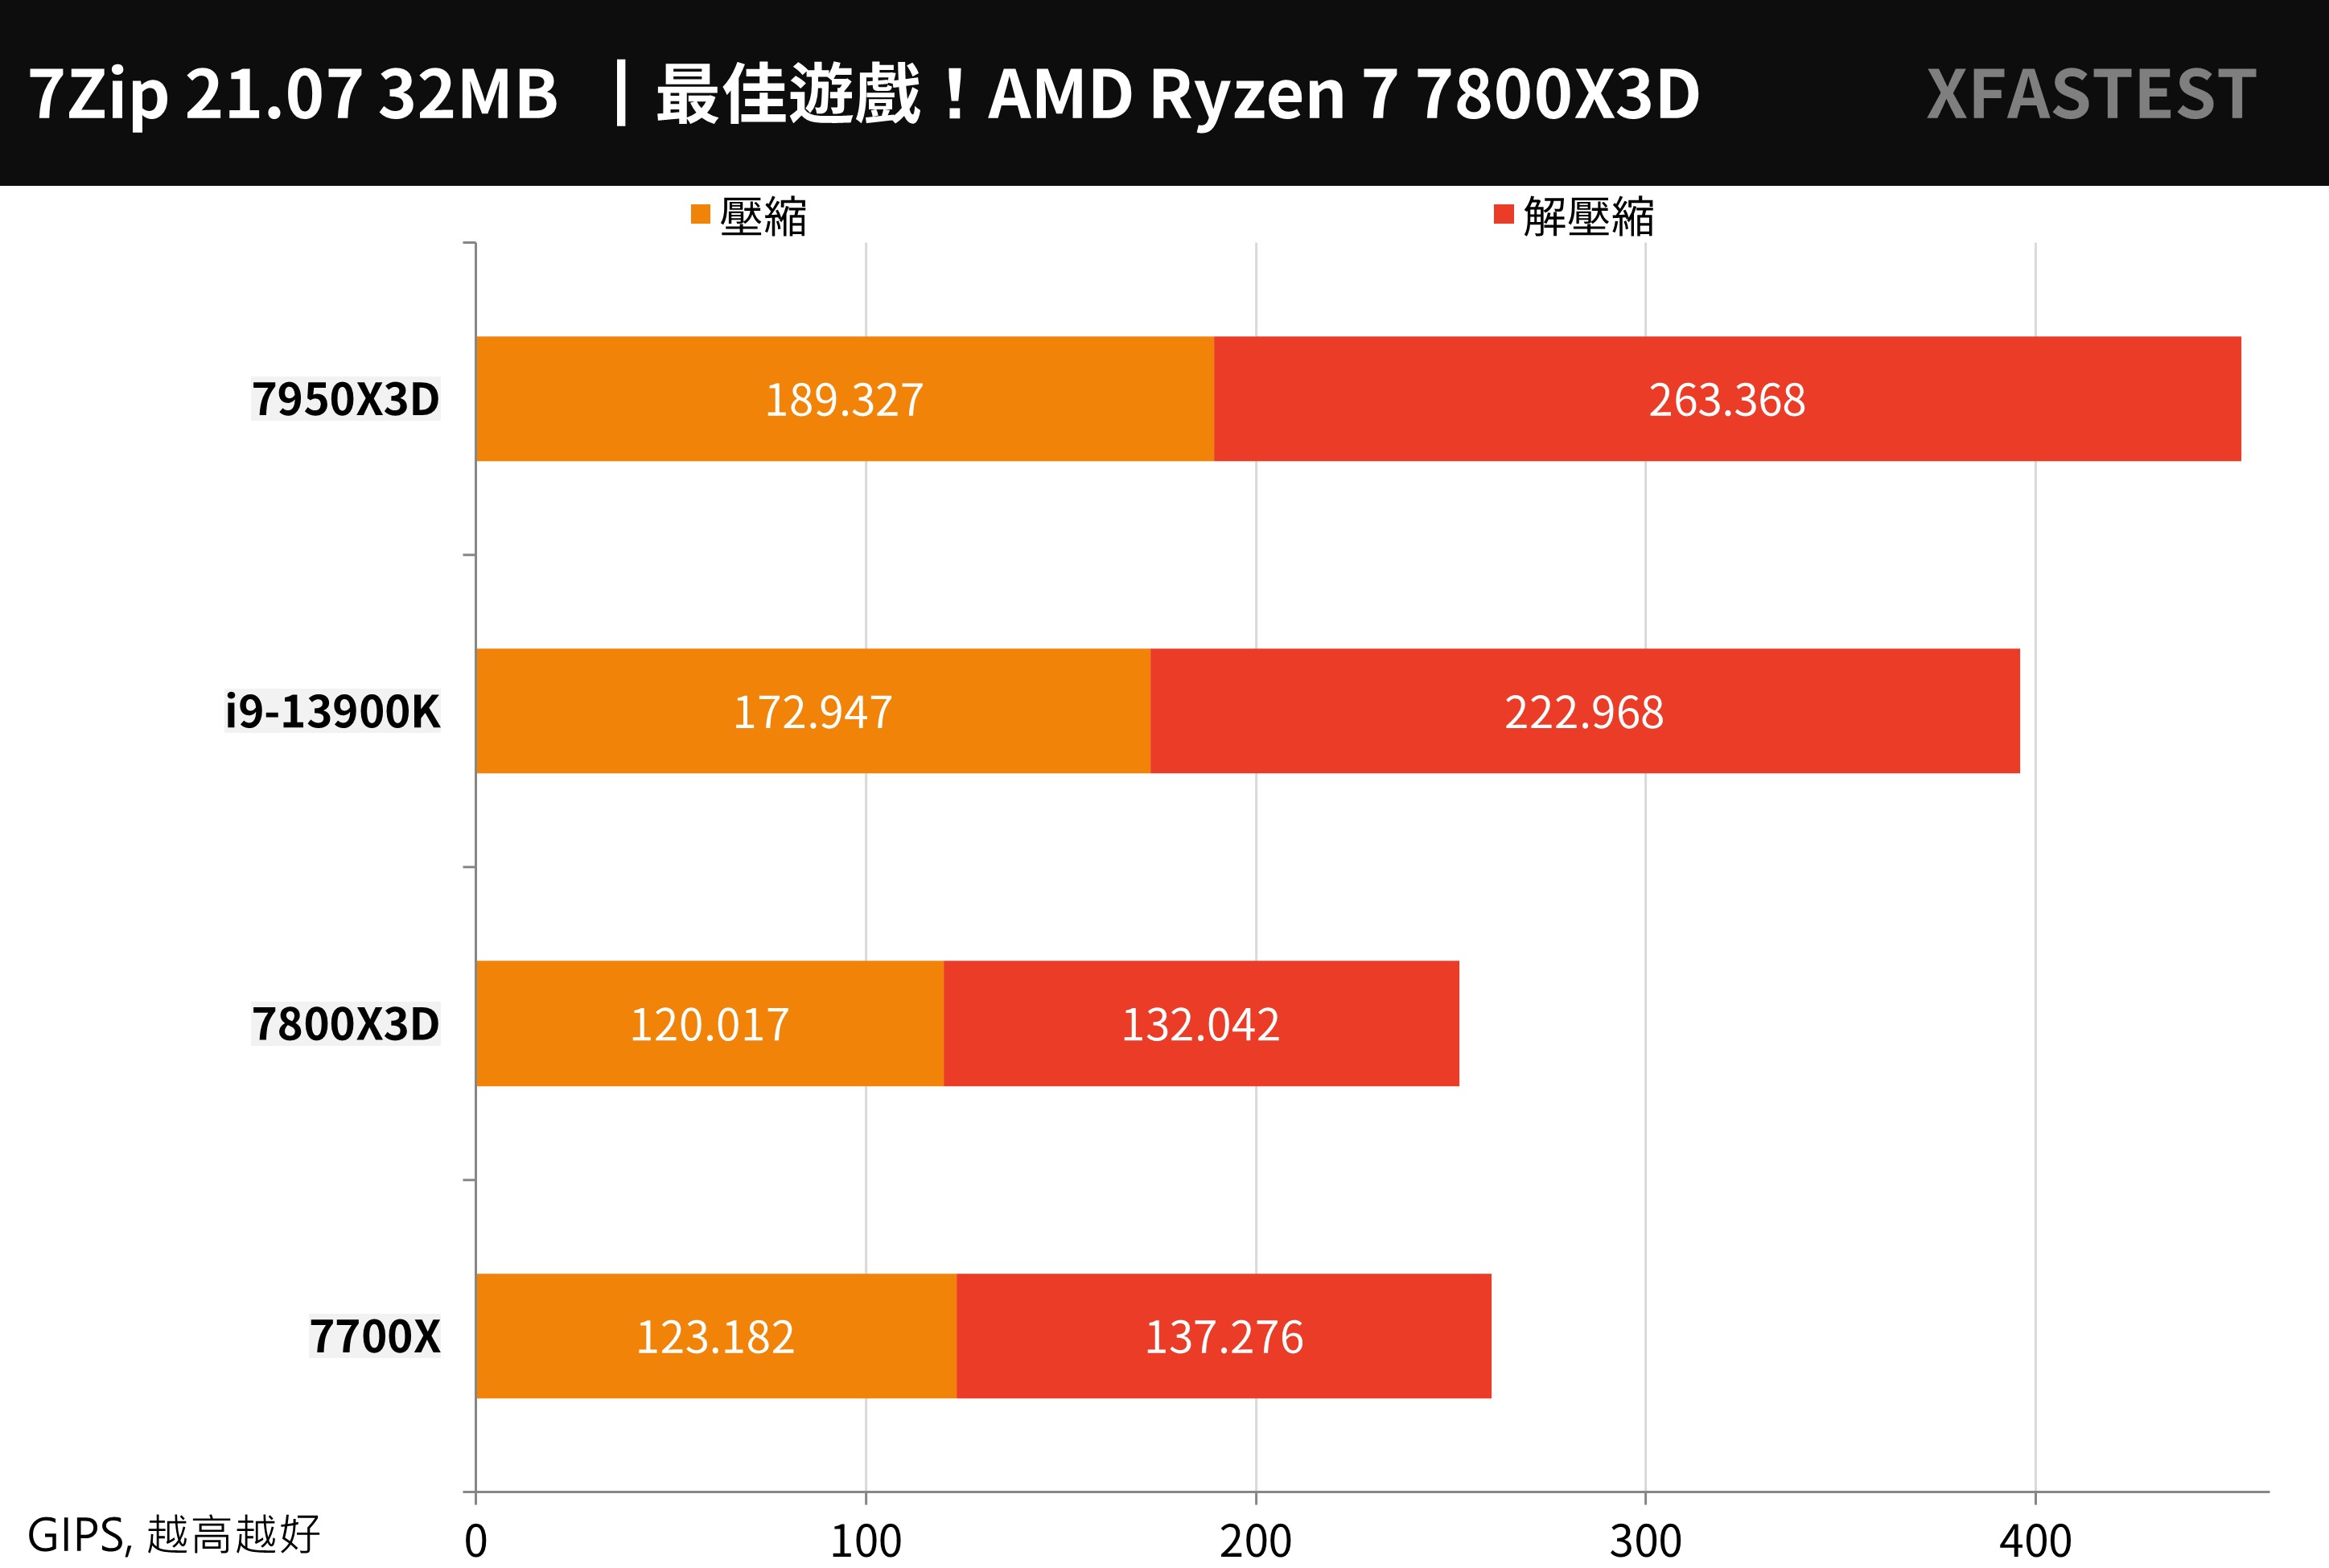
↑ 7-Zip, the more performance the better.
PCMark 10, CrossMark and Office PC Benchmarks
The overall performance of the computer is first PCMark 10 For the test, you can score the basic computer work of Essentials, such as App startup speed, video conferencing, and web browsing performance. The Productivity productivity test uses spreadsheets and paperwork as test items. Digital Content Creation video content creation, then Tested on photo/video editing, rendering and visualization.
7800X3D reached a total score of 9389 points, and the overall performance of the computer was slightly lost to 7700X by about -7%.
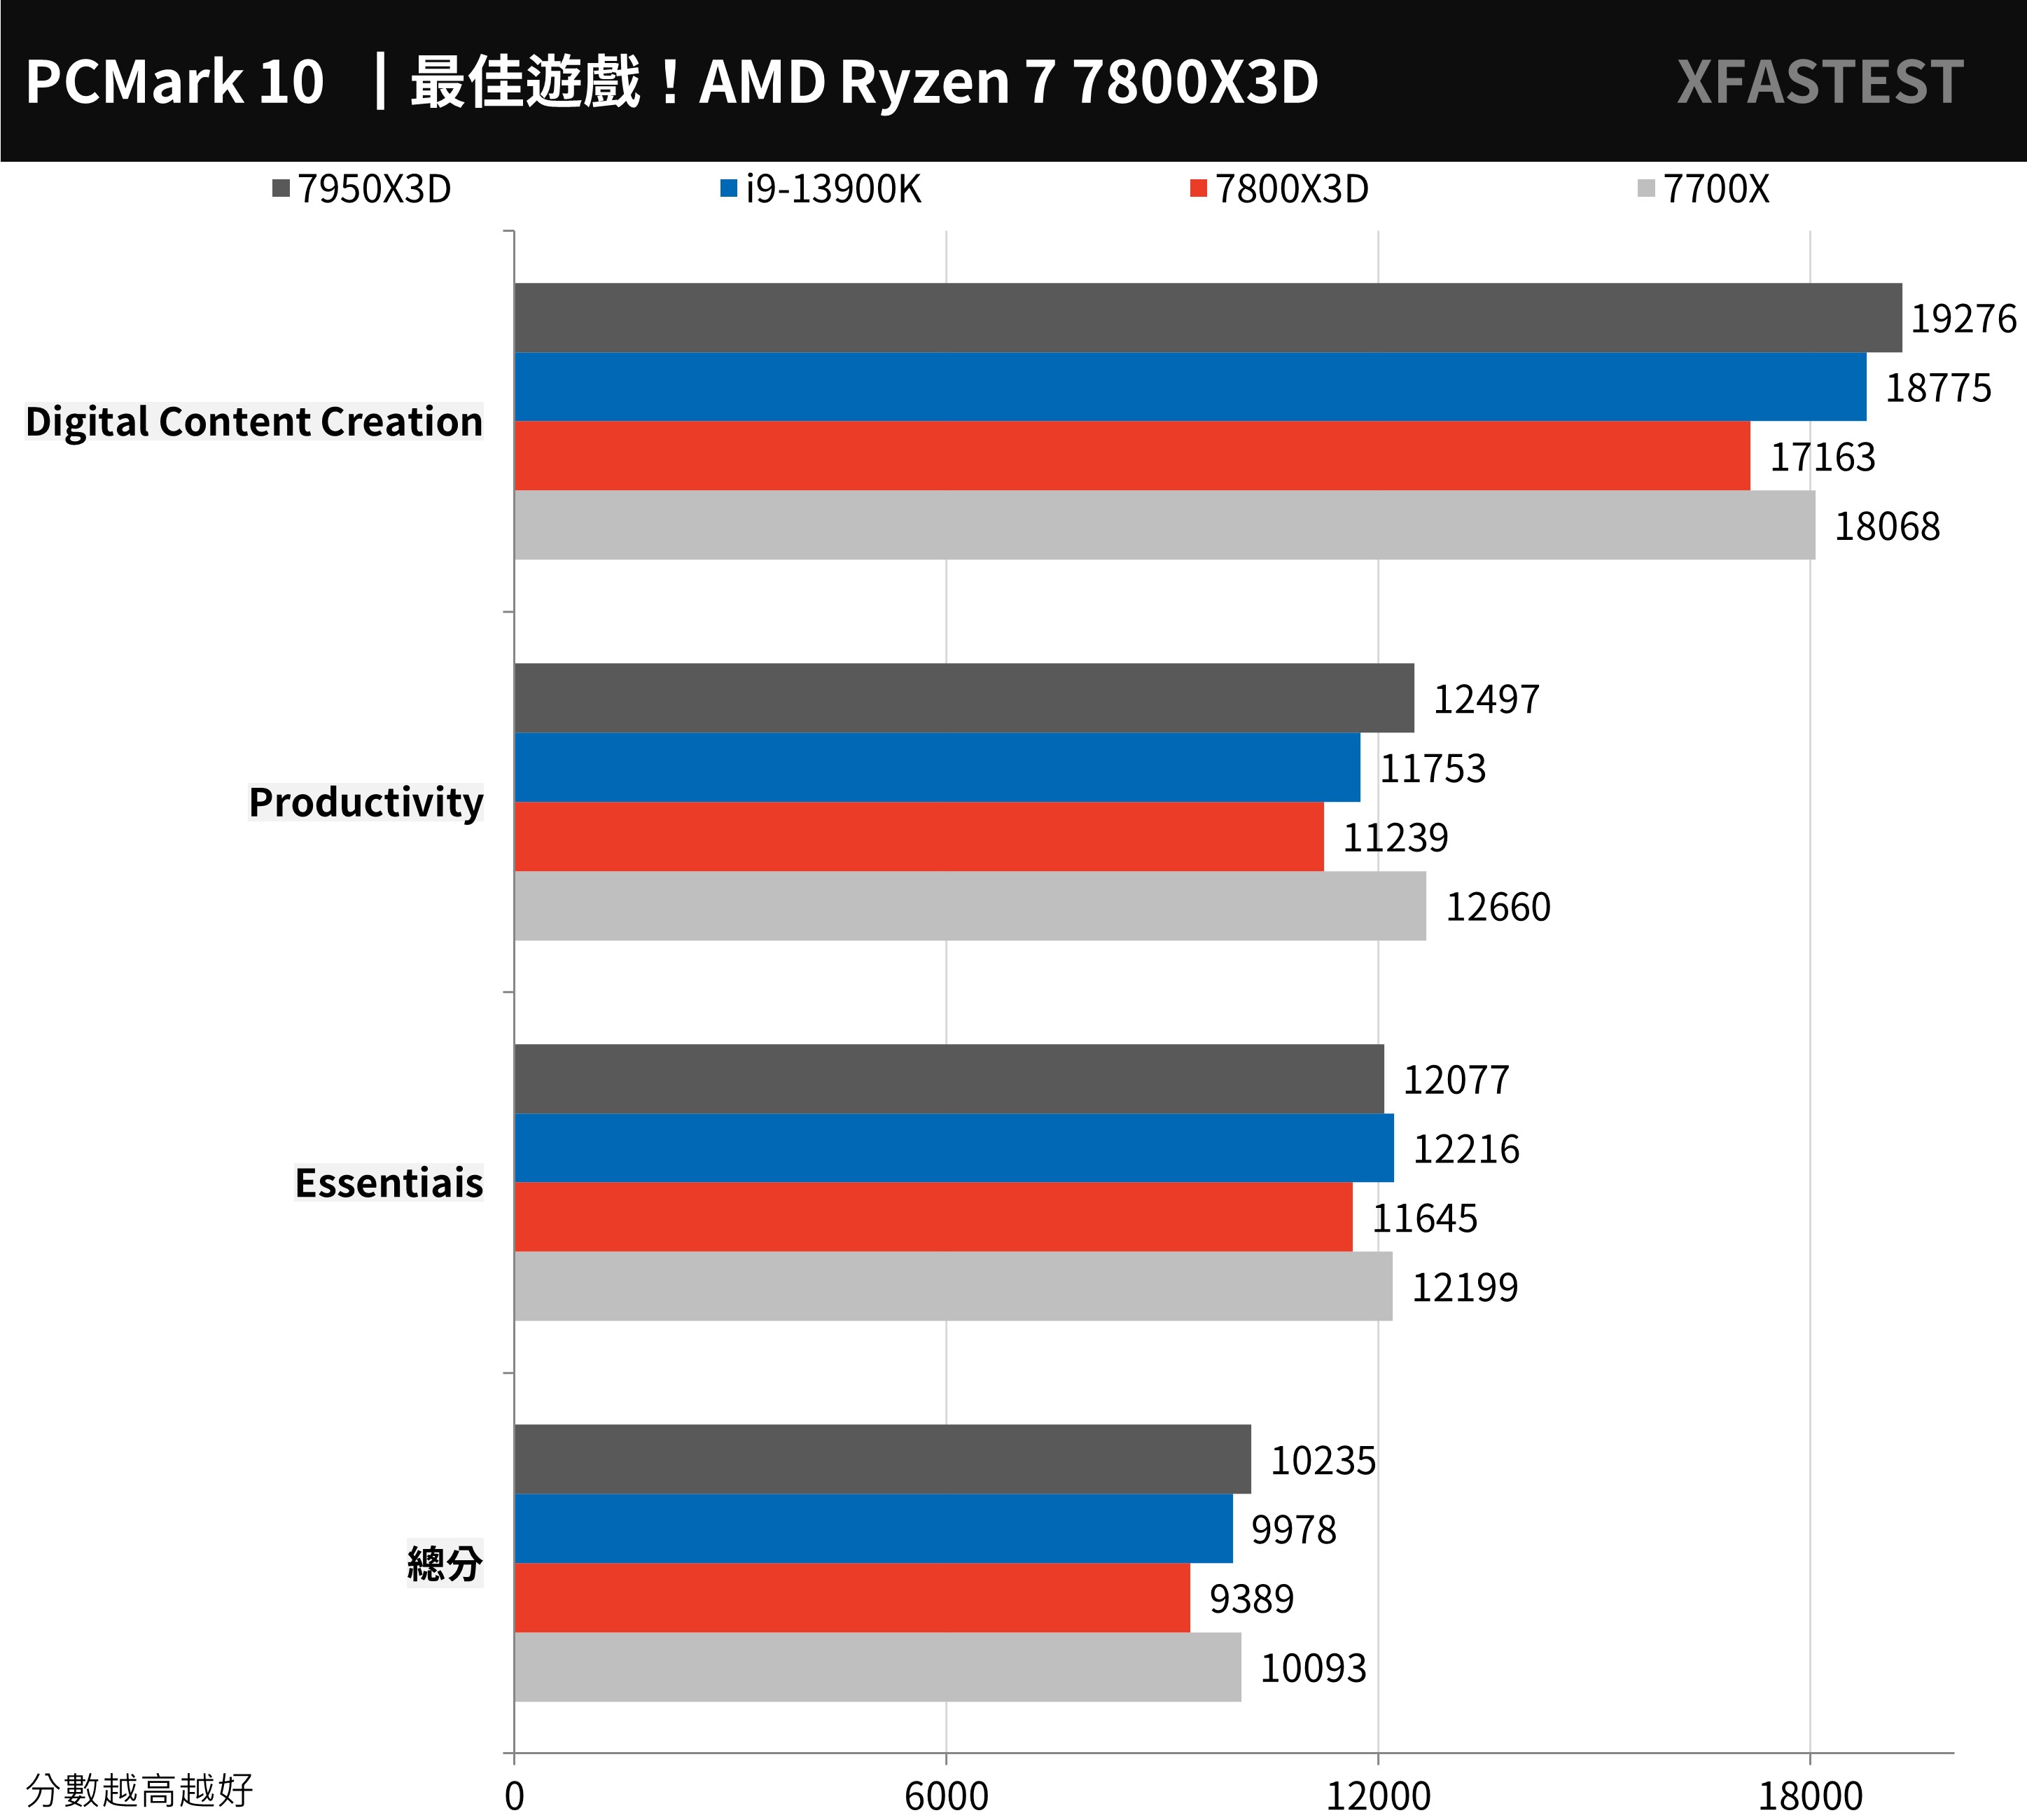
↑ PCMark 10, higher scores are better.
Cross-platform computer performance testing tool CrossMarkis a free test tool developed by BAPCo that supports platforms such as Windows, iOS/iPadOS, macOS, and Android, and is aimed at computer productivity, such as text editing, spreadsheets, web browsing, and creative photo editing, organizing, and Video editing and other work, plus computer response speed for testing.
The 7800X3D achieved the score of 2015, which is about -7.6% behind the 7700X.
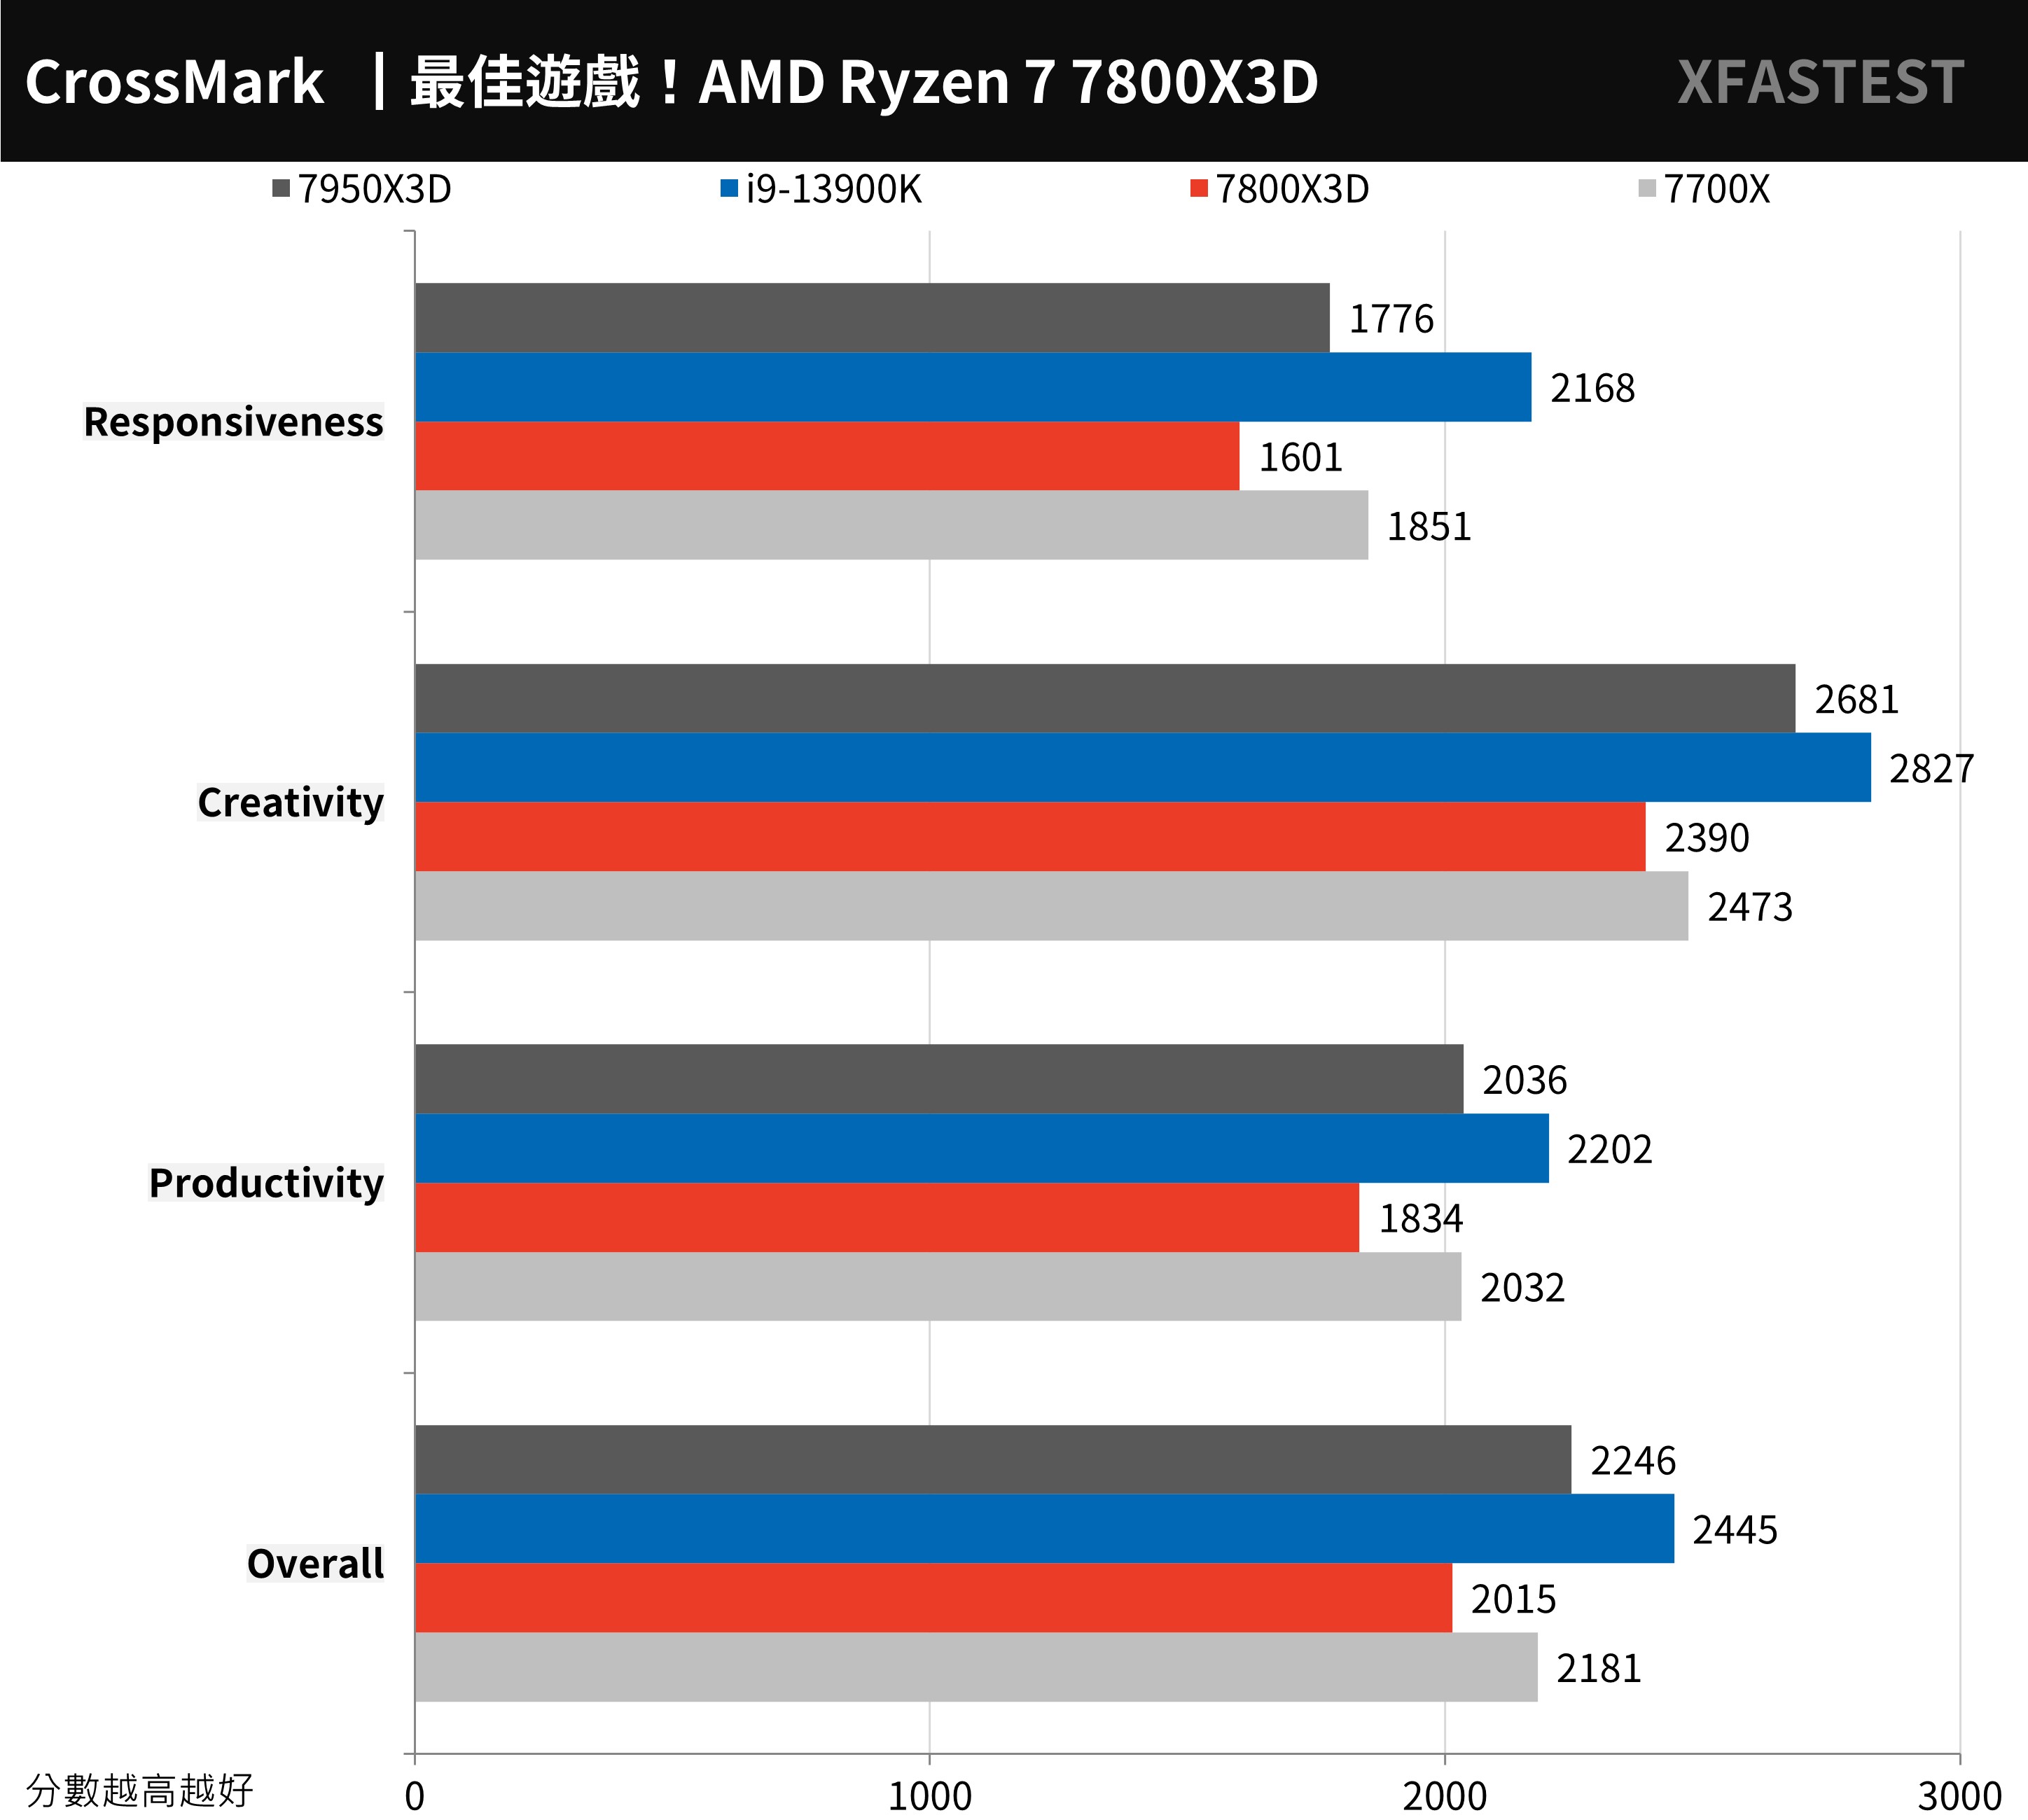
↑ CrossMark, the higher the score, the better.
UL Procyon The office productivity benchmark test uses Microsoft Word, Excel, PowerPoint and Outlook to test the practical and real performance of Windows computers in daily work, and uses common paperwork to design test situations, from document opening, copying, input, and spreadsheet Calculation, sorting, exporting, adding files, image files, videos, and sending and receiving emails to presentations.
7800X3D achieves 7944 points, which is about -8.7% less than 7700X.
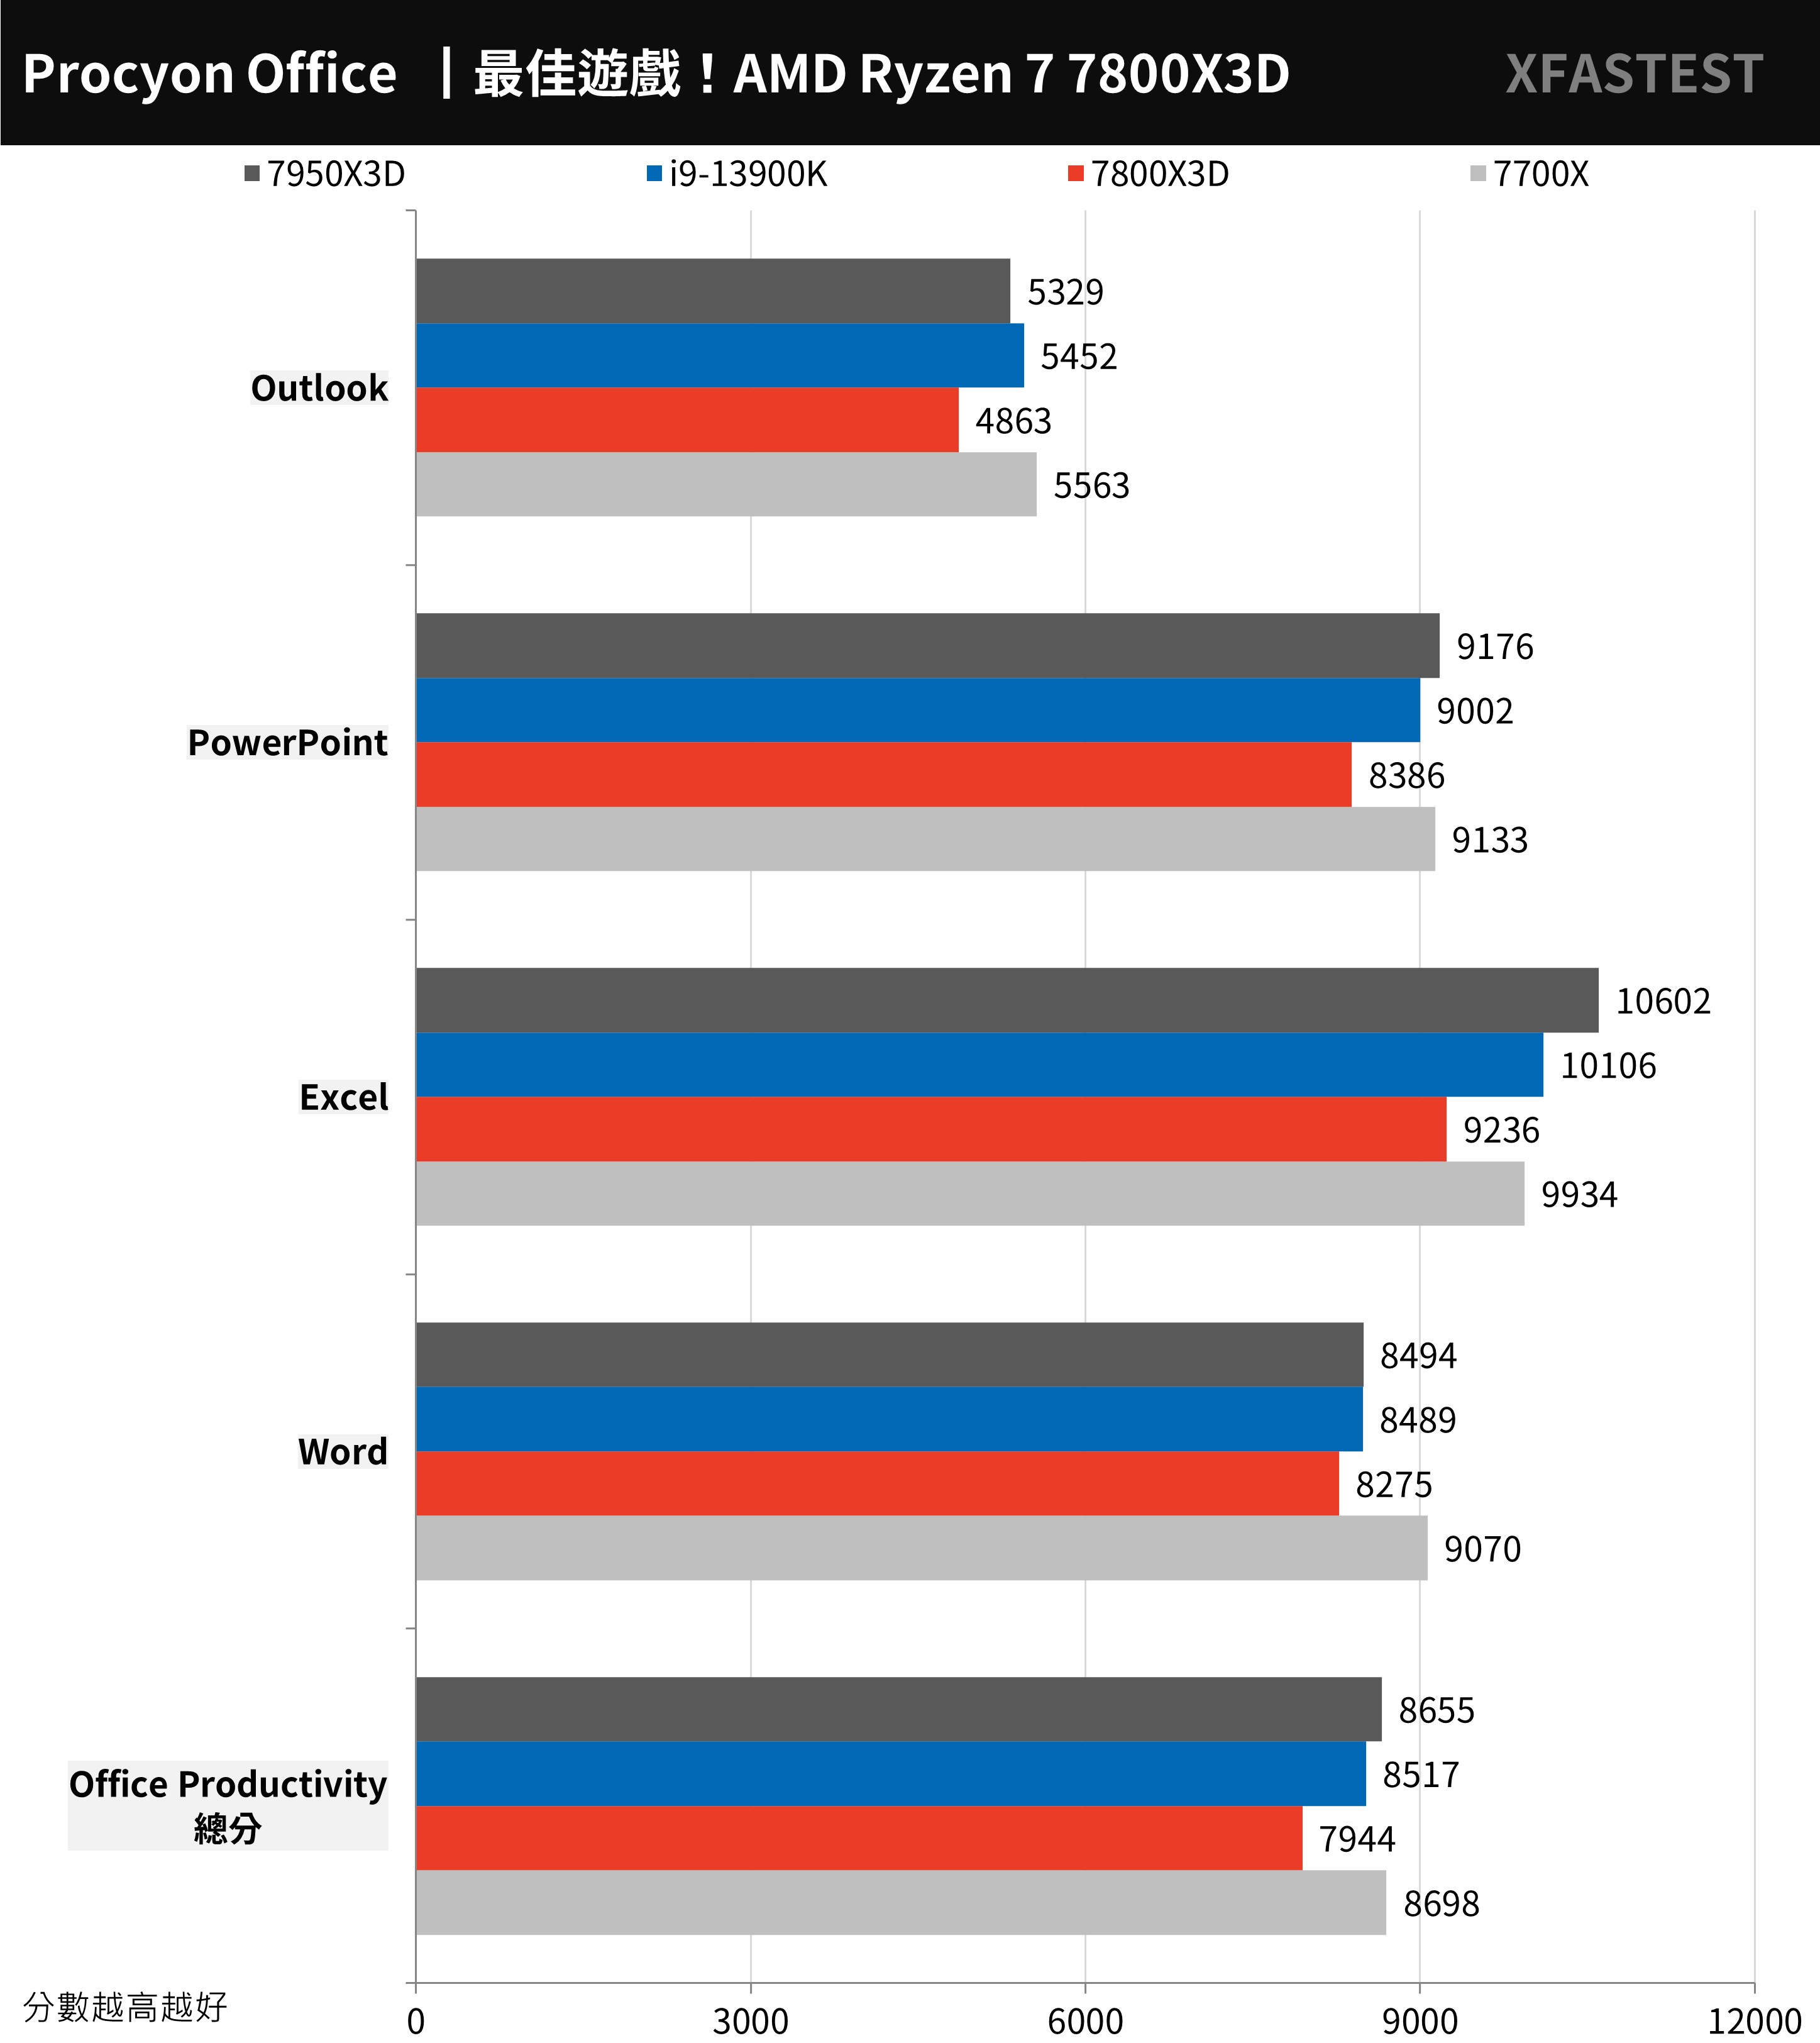
↑ UL Procyon, the higher the score the better.
3DMark CPU Performance and Fire Strike, Time Spy Benchmark Test
Computer graphics game performance testing tool 3DMarkthe mainstream Direct X11 test Fire Strike and Direct X12 Time Spy test.
Fire Strike Physics physical score 7800X3D reached 32784 points, compared with 7700X lost -7.8%. The Time Spy CPU score is 7800X3D reached 13637 points, compared with 7700X lost -4%.
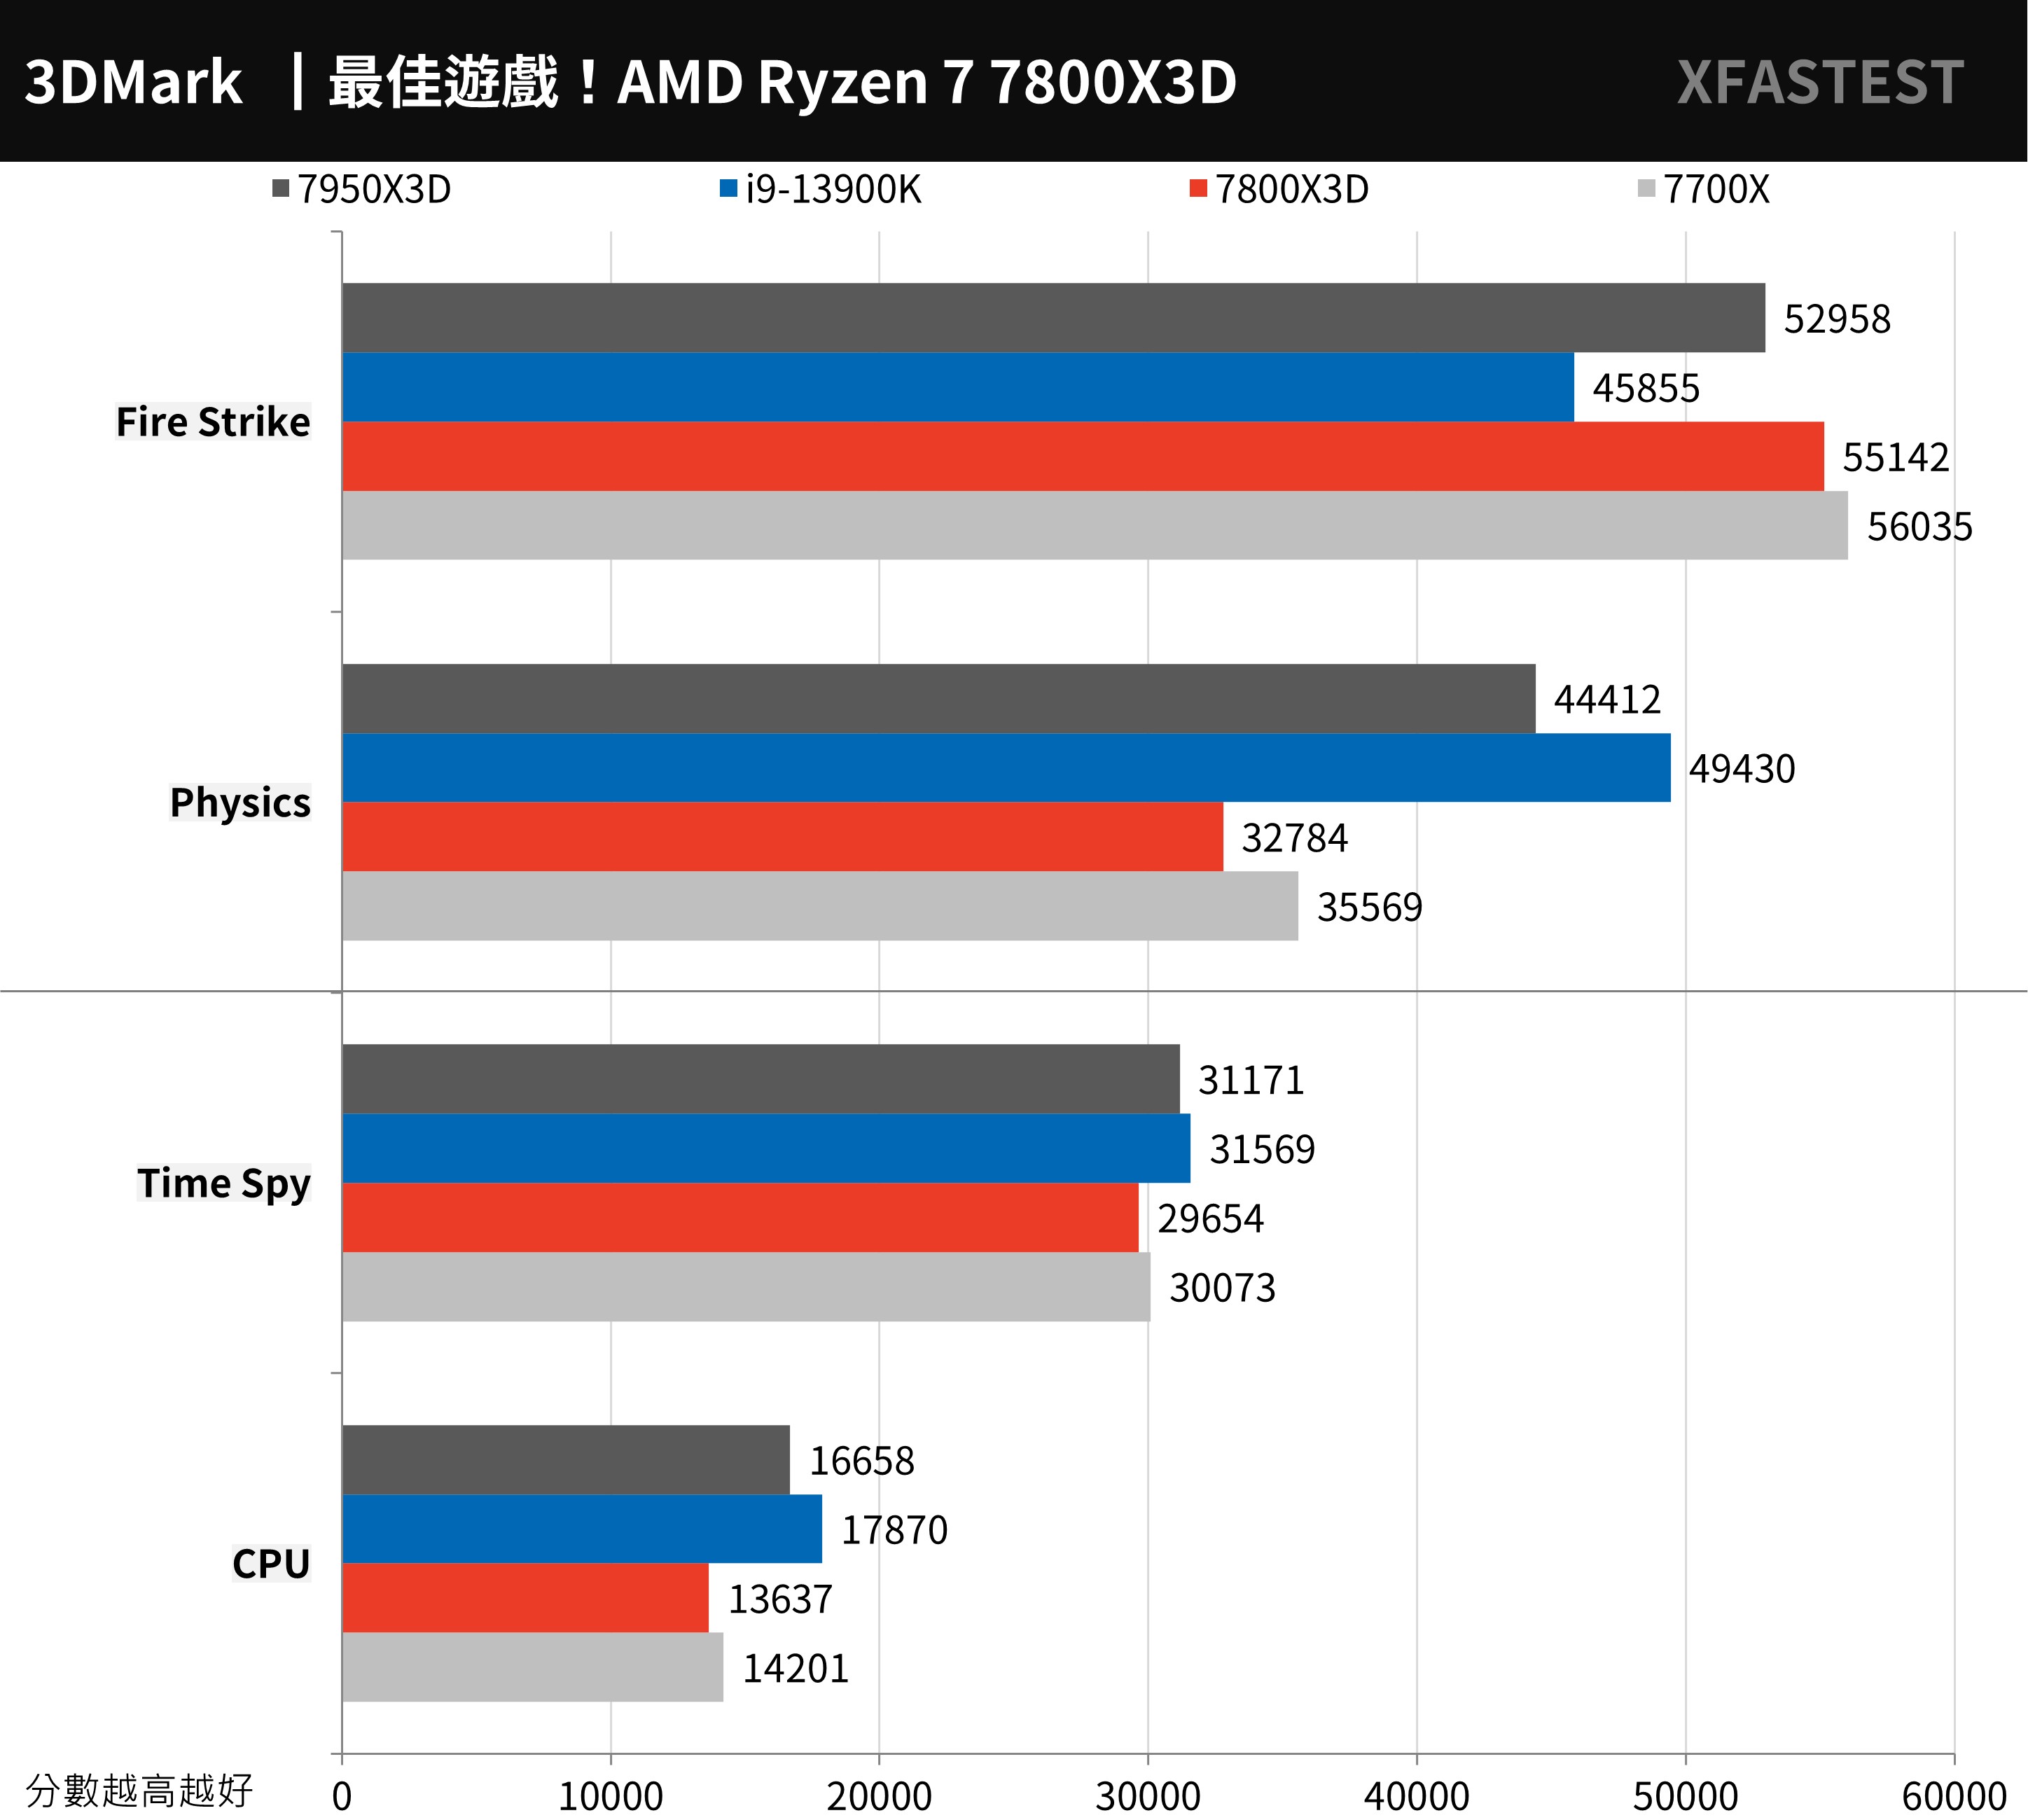
↑ 3DMark, the higher the score, the better.
3DMark CPU The test mainly tests the physical operation and custom simulation of the CPU, and tests the performance of 1, 2, 4, 8, 16 and the maximum execution threads of the processor respectively, and the performance above 16 execution threads will belong to 3D rendering, Audio and video output will be used. Generally, Direct X12 games prefer 8T execution threads, while the following execution threads are the preferences of old games.
In terms of overall performance, the 7800X3D with a lower clock rate loses slightly to the 7700X with a higher clock rate in different thread tests.
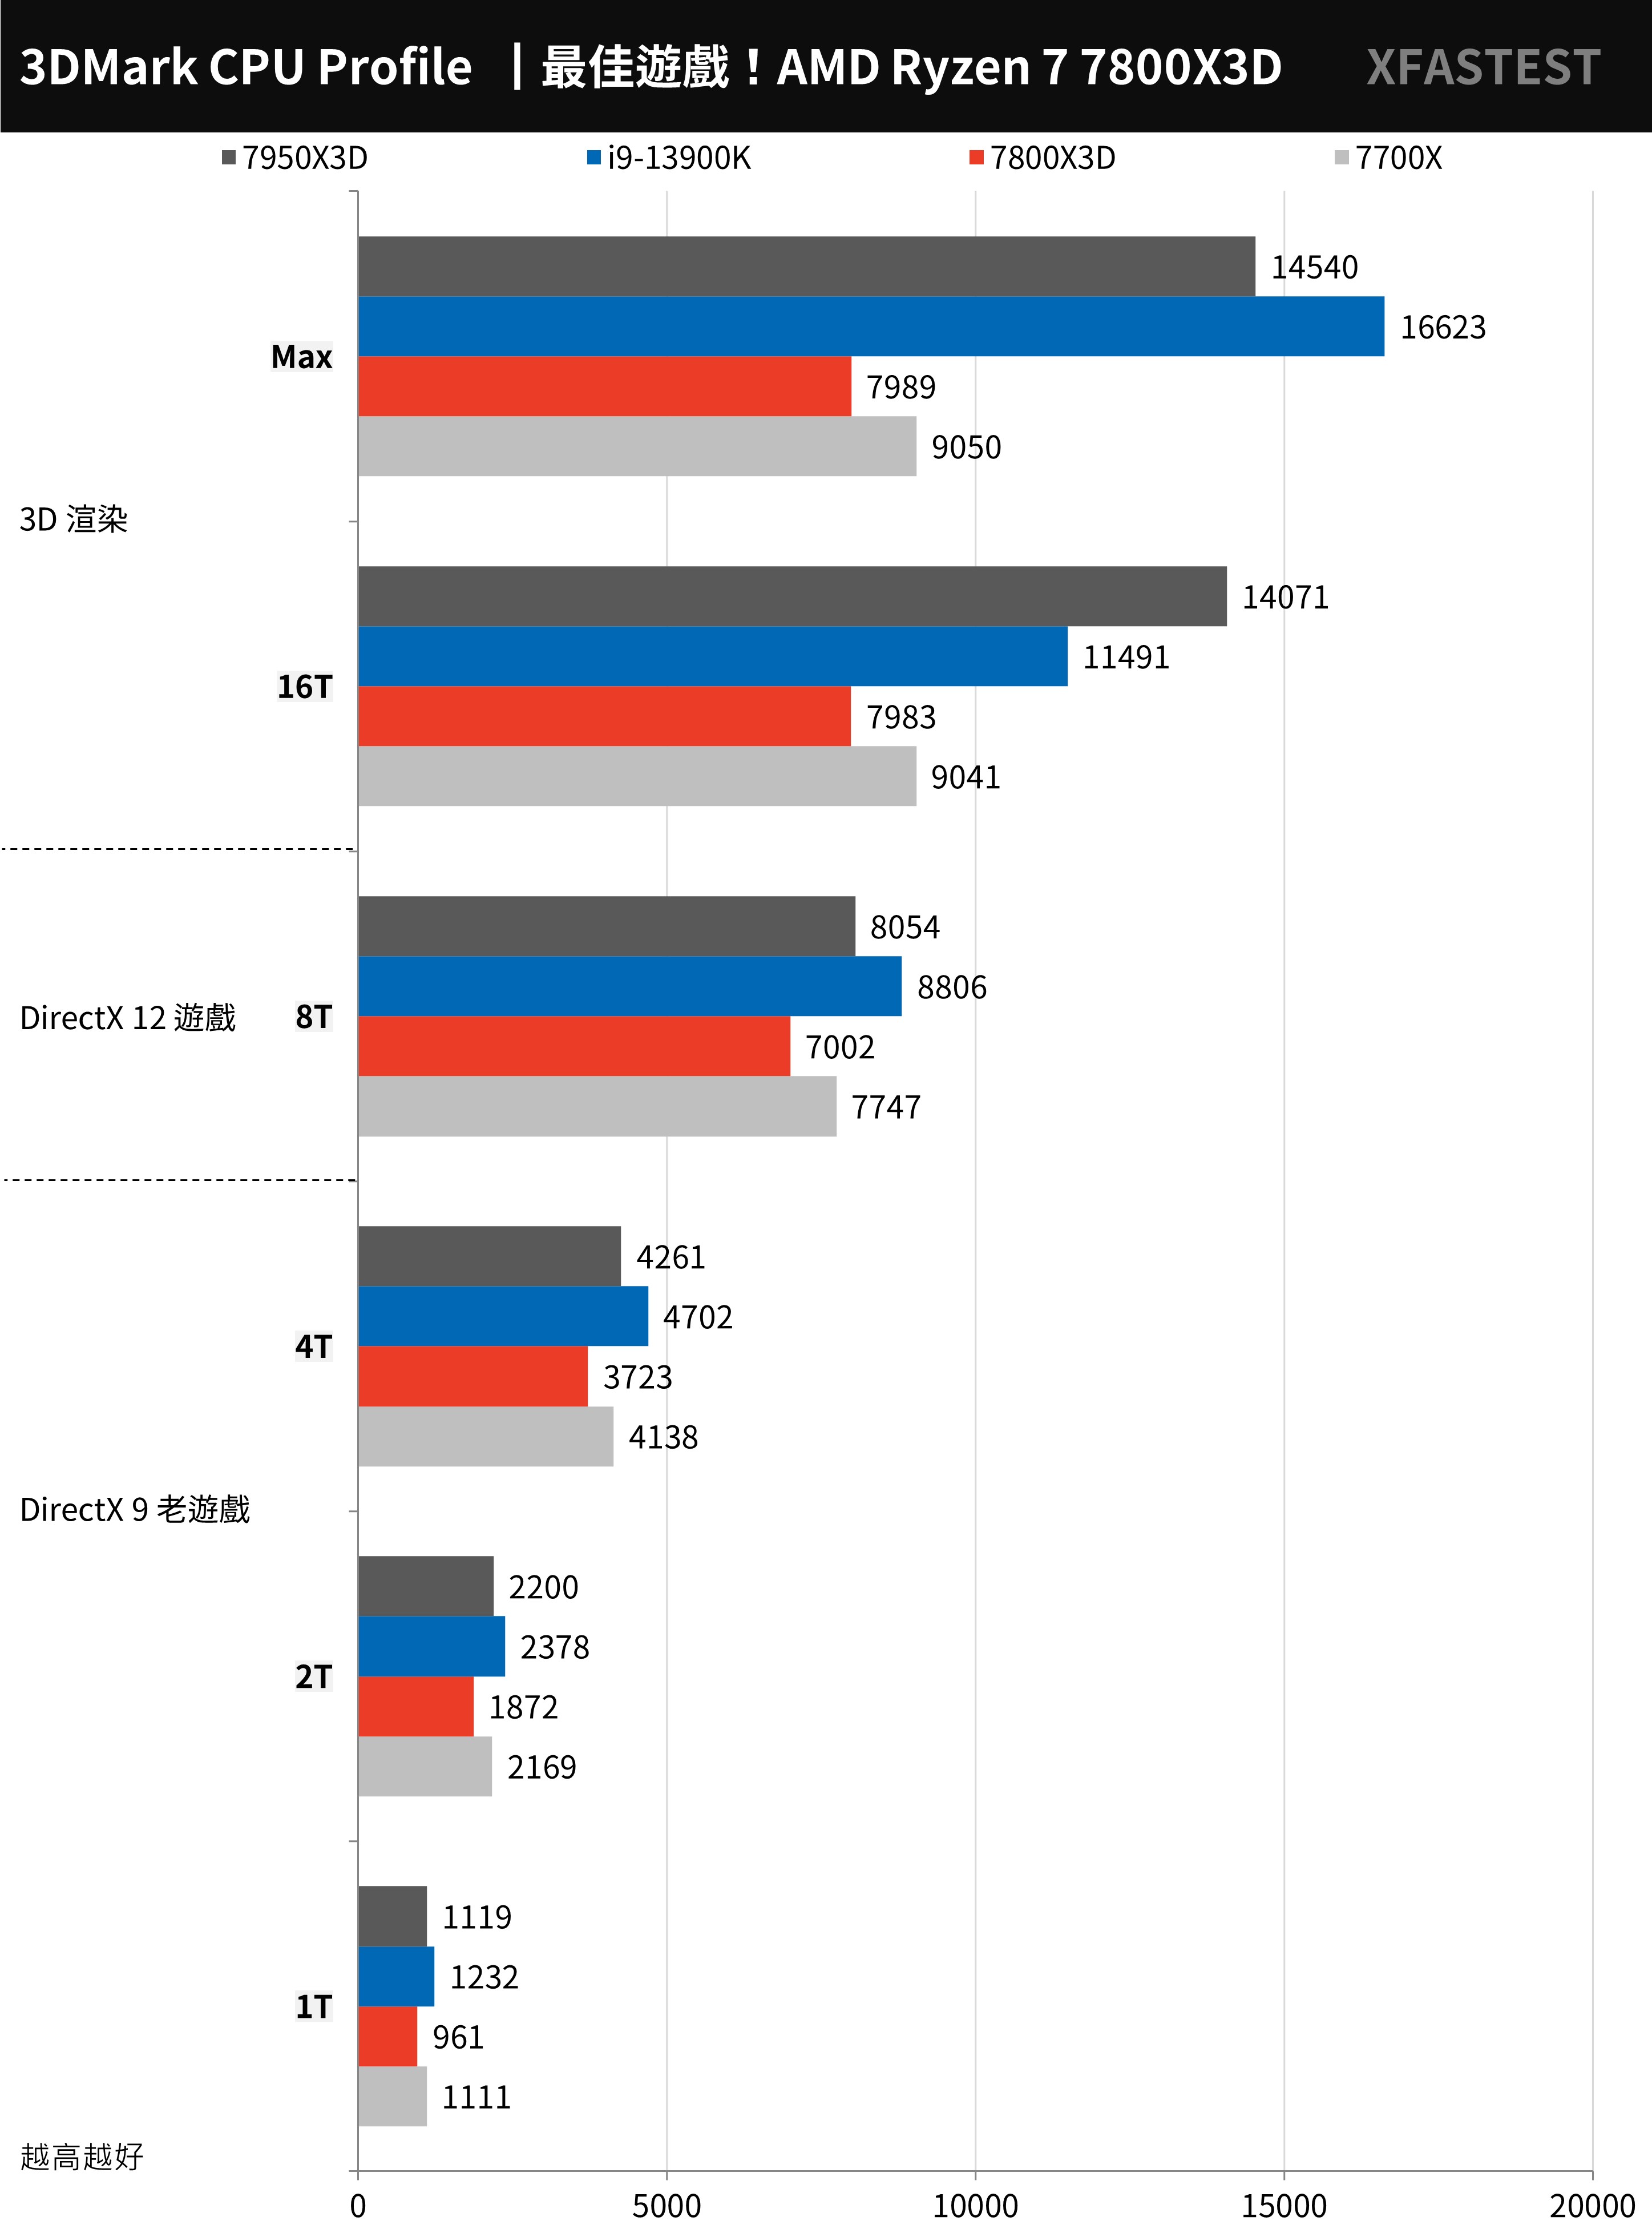
↑ 3DMark CPU, the higher the score, the better.
11+4 AAA e-sports games for processor performance test
11 AAA gamesPerformance test, the entry-level “F1® 22” racing game, the shooting game “Gears of War 5”, the adventurous “Tomb Raider: Shadow”, “Horizon: Waiting for Dawn”, and the performance-heavy “Borderlands 3”, “Assassin’s Creed: Viking Age”, as well as games such as “Polar Trenches 6”, “Marvel Interstellar Attack Team”, “Watch Dogs: Liberty Legion” and “Device 2077” that support ray pursuit.
In addition, the “Microsoft Flight Simulator”, which is heavy on CPU performance, is specially added. The tests are all conducted at 1080p resolution and the game’s highest default settings for the In Game Benchmark test, and the DLSS and FSR acceleration functions are turned off.
Among the 11 games, the 7800X3D achieved an average of 205.8 FPS, a 15.7% improvement in game performance compared to the 7700X, and only -4.3% behind the 7950X3D.
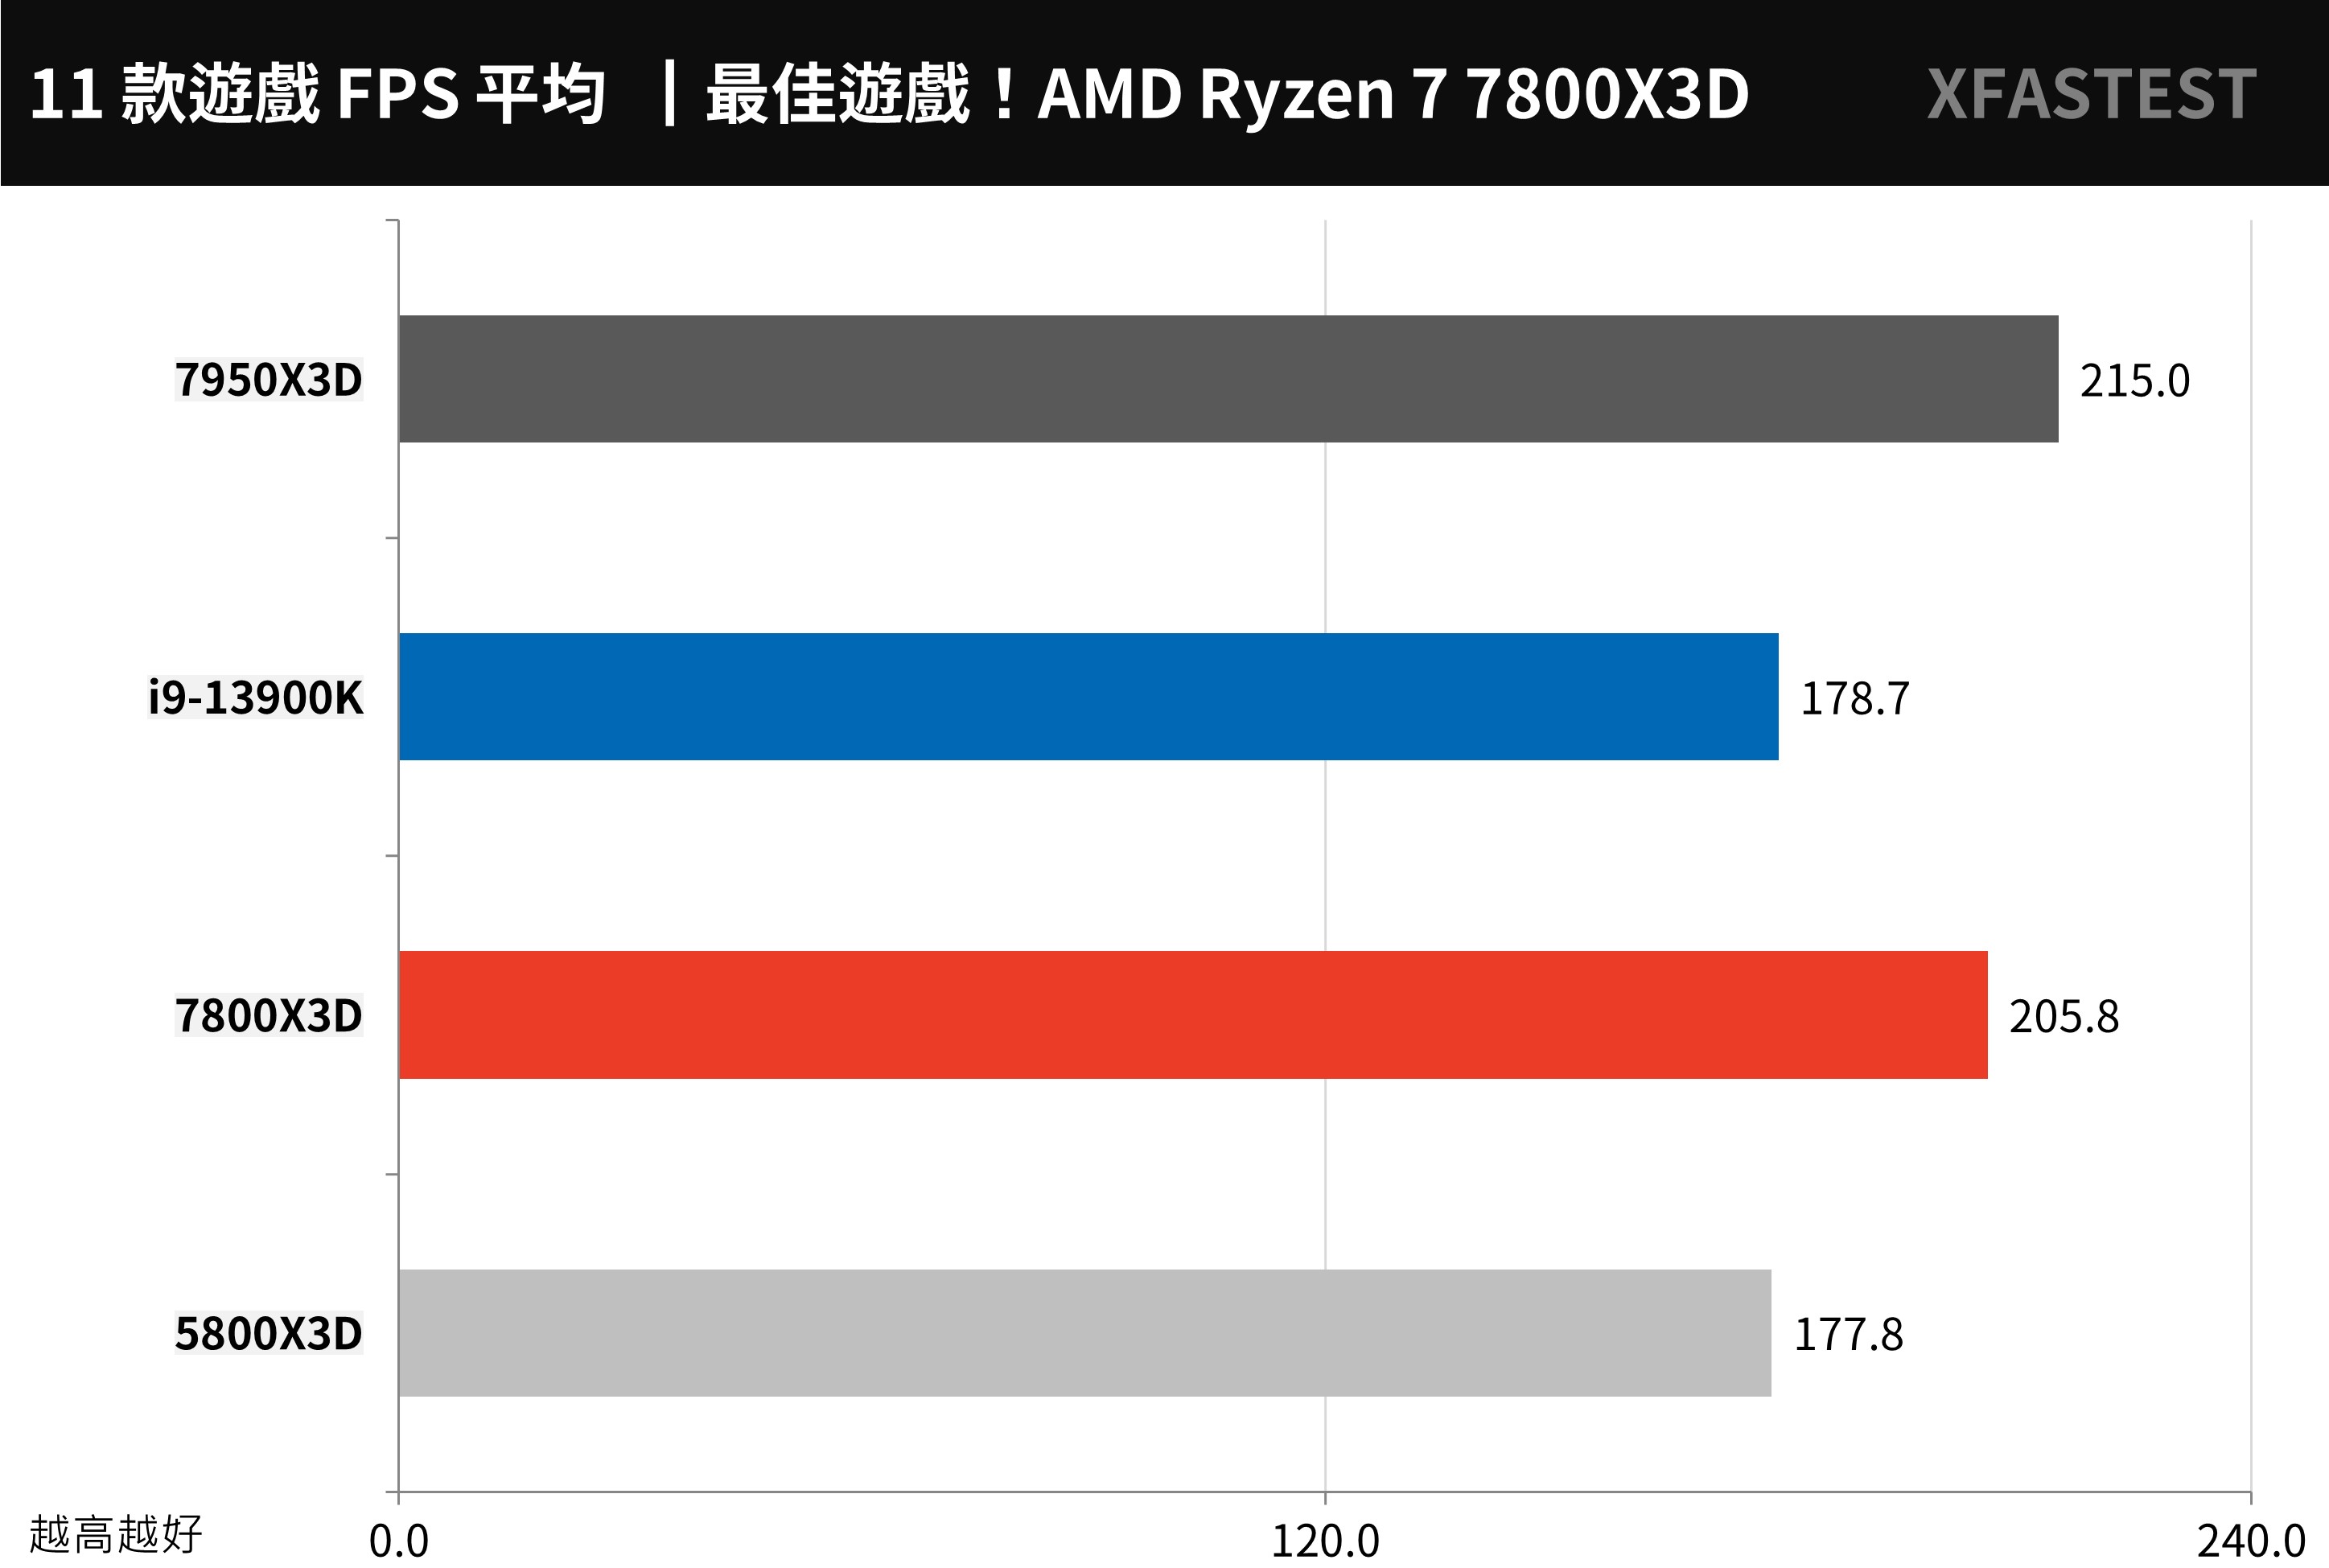
↑ Average of 11 games, the higher the FPS, the better.
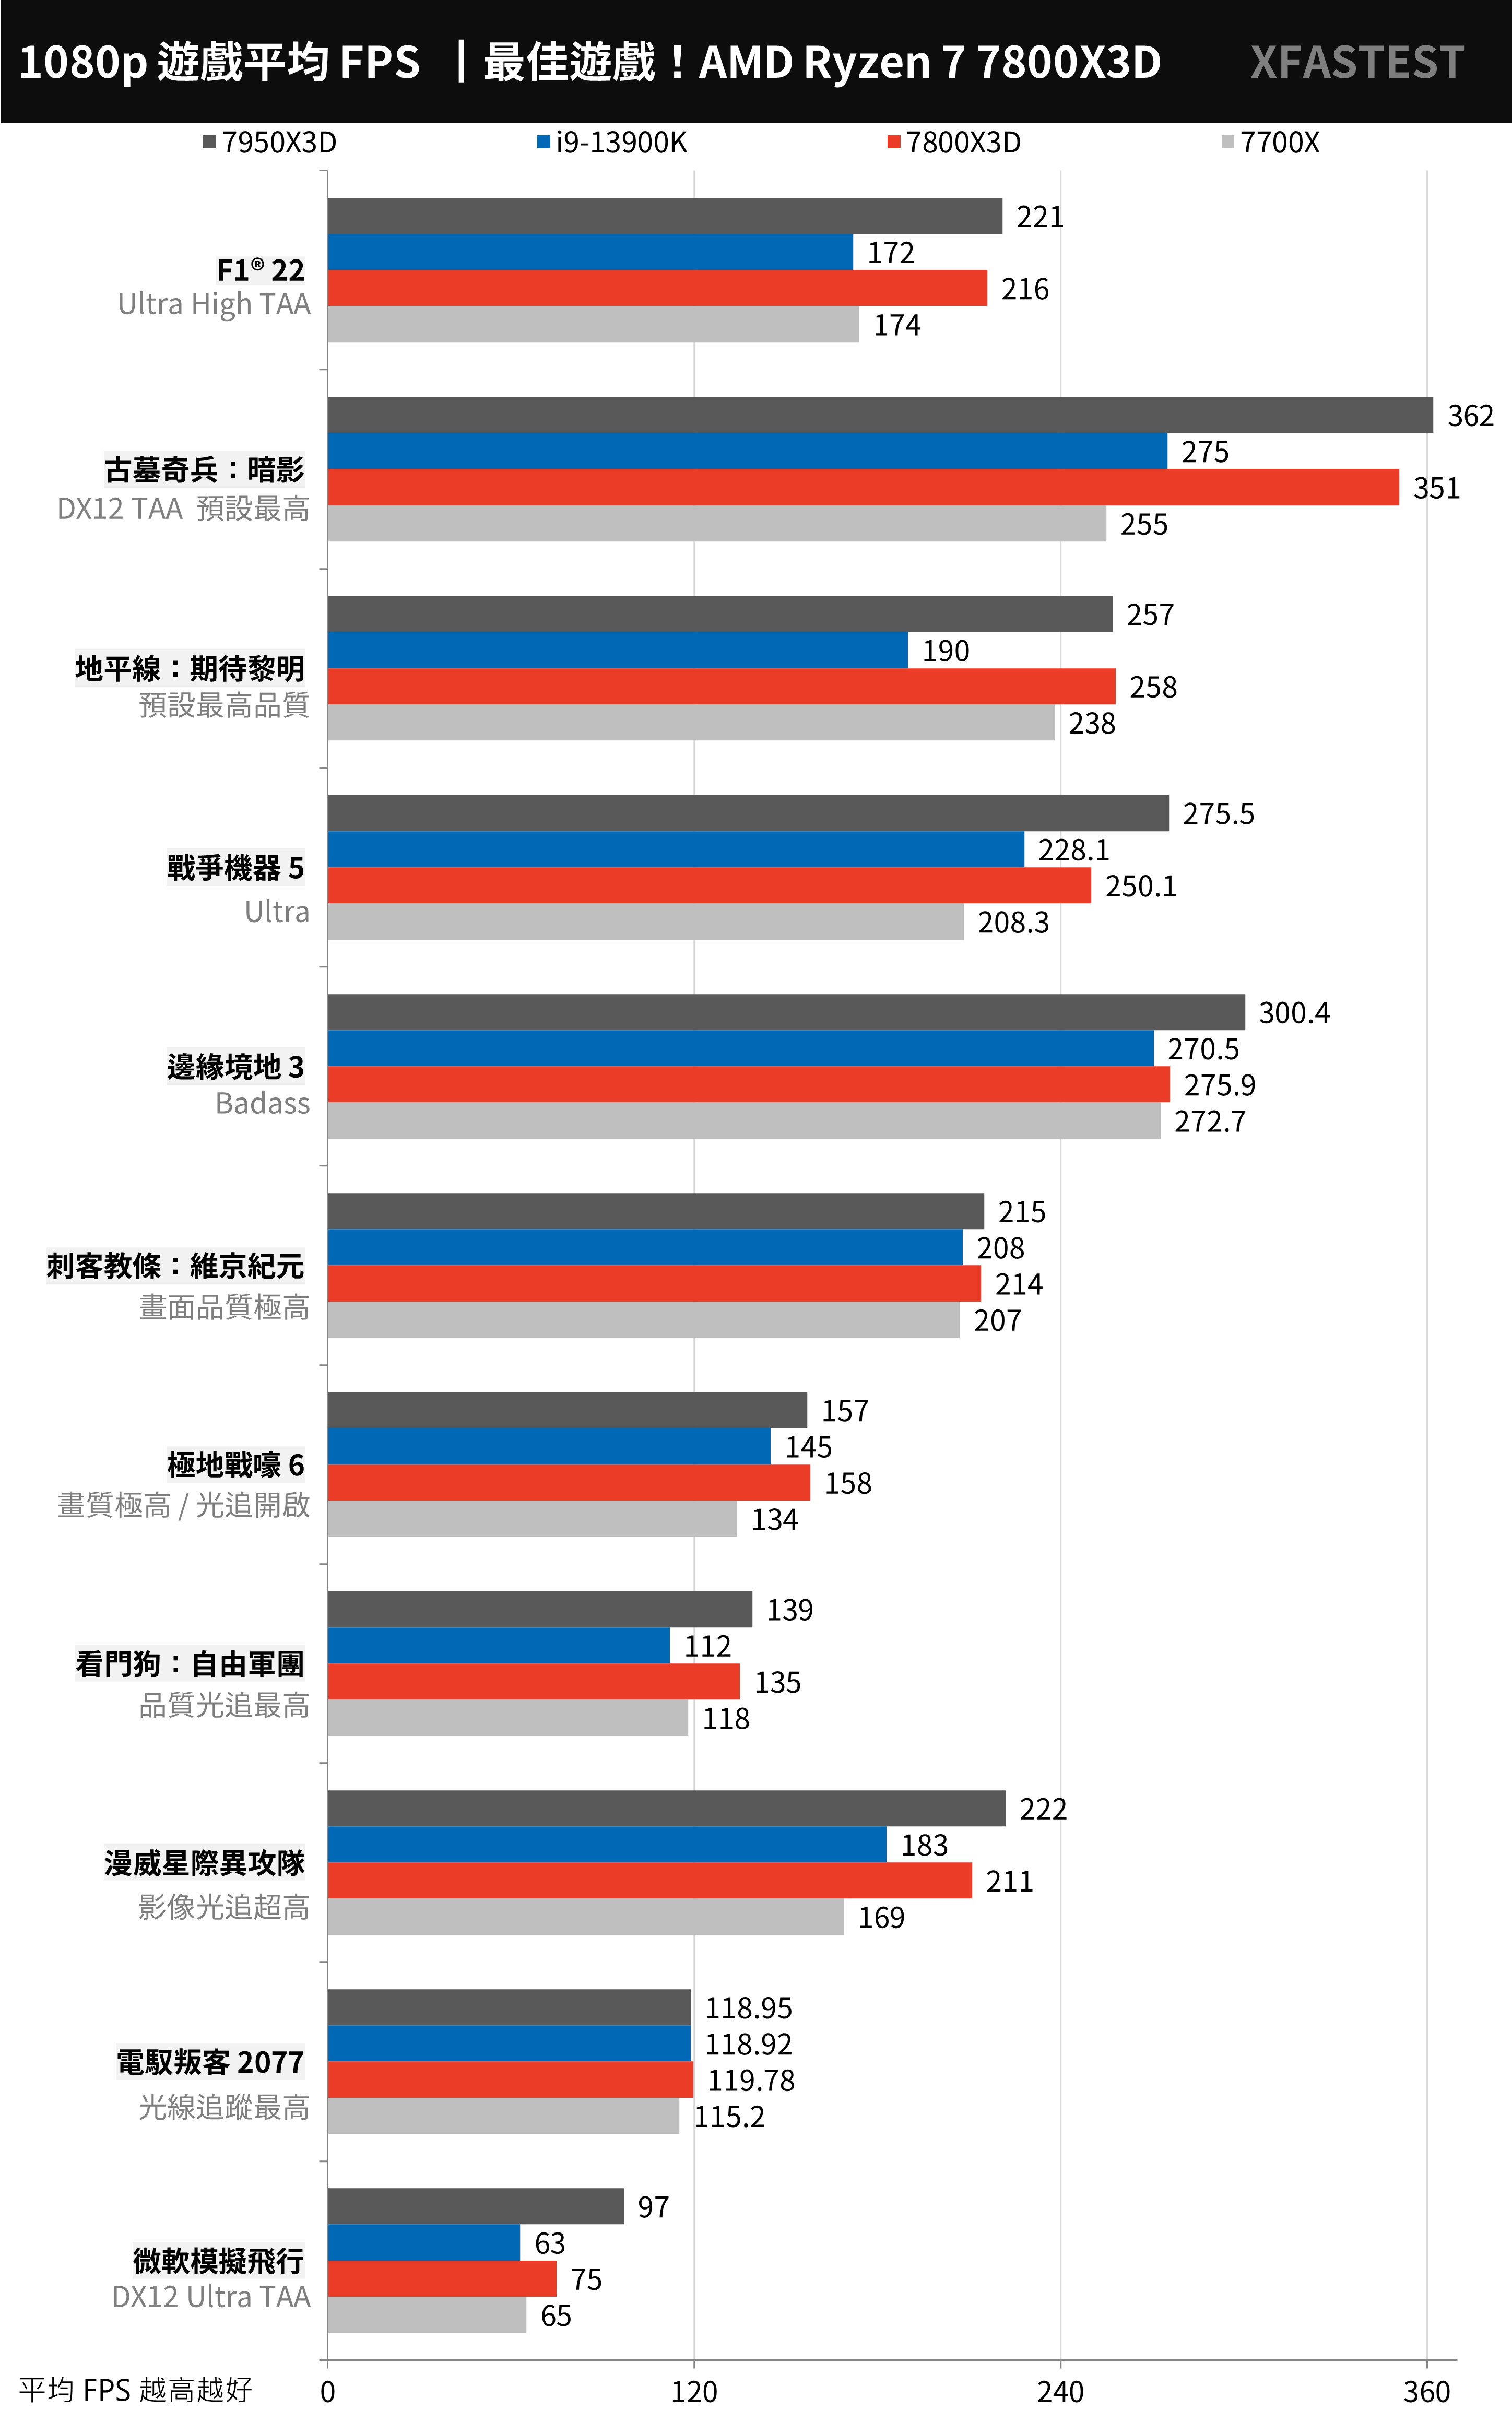
↑ 11 game tests, the higher the FPS, the better.
E-sports games focus on the tactical and technical competition between players and teams, so they don’t have high requirements for the image quality of the game. This also allows such games to have a very high average FPS performance on high-end CPUs and GPUs, especially in 1080p resolution. Under high speed, the improvement of CPU performance and clock can increase the FPS performance of the game.
7800X3D has 782.66 FPS in “CS:GO”, 783 FPS on average in R6 games, and 375 FPS in “League of Legends”. The controller does not get better performance in games such as “CS:GO” and “League of Legends”.
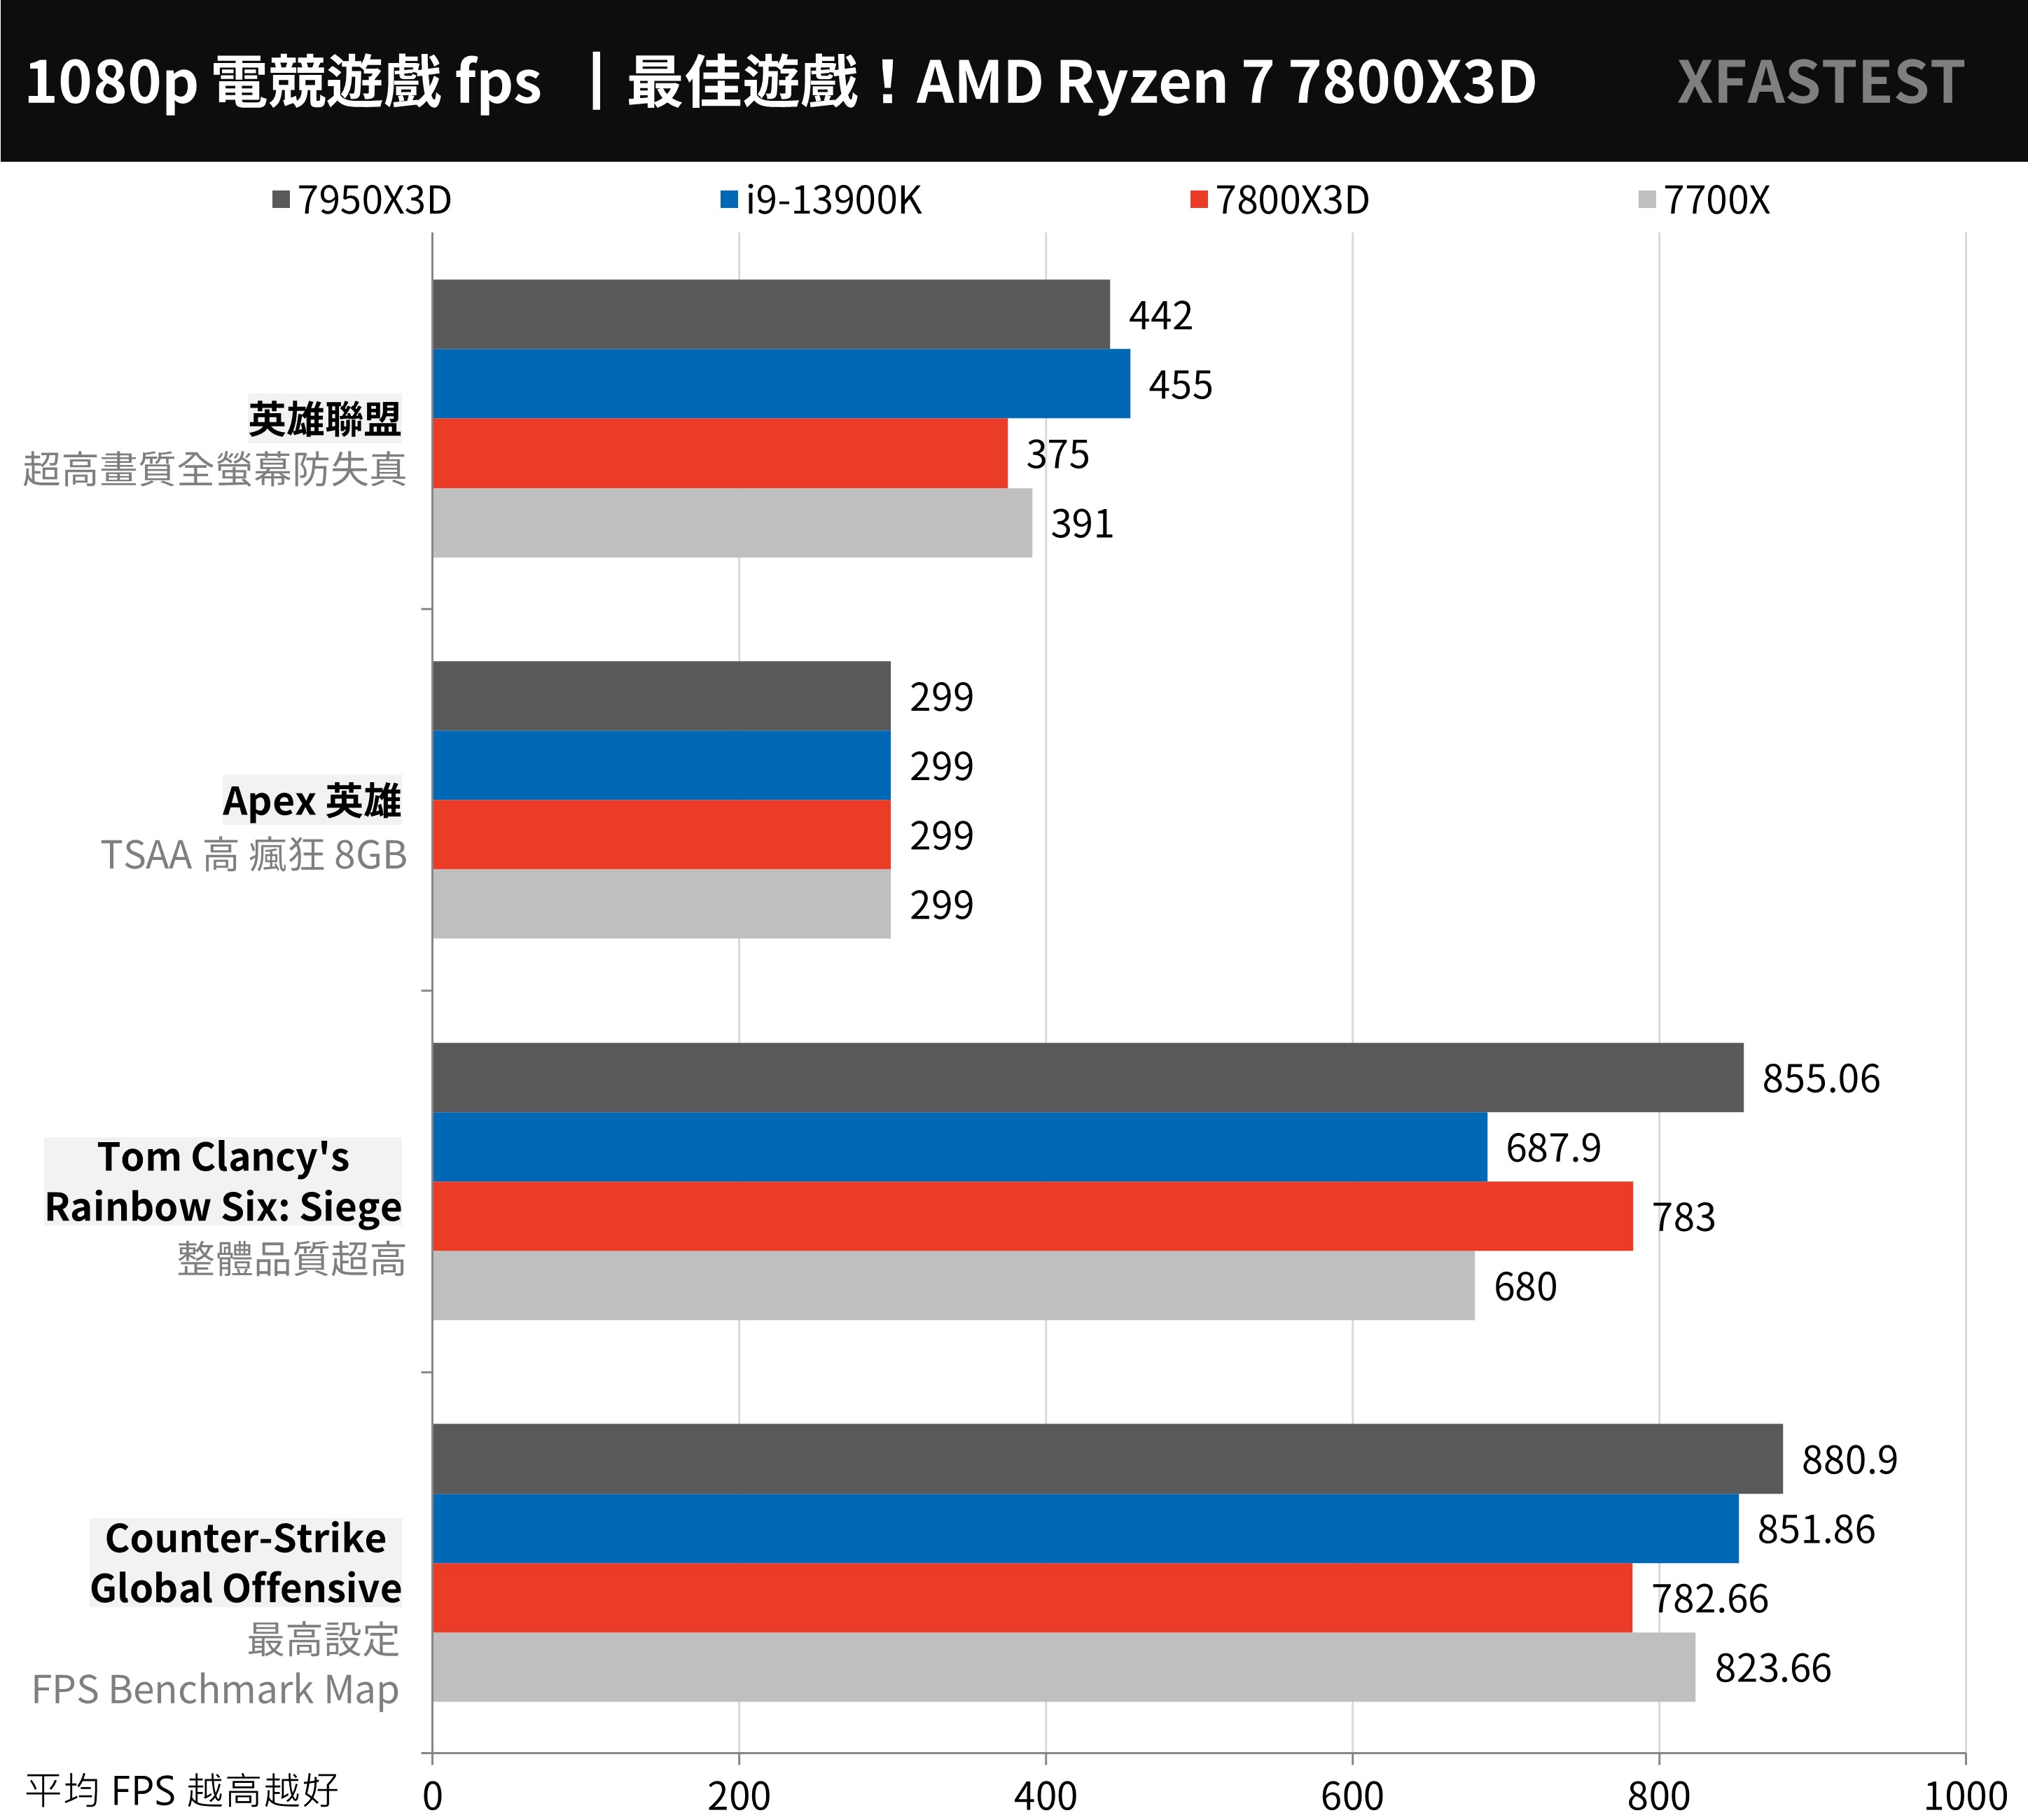
↑ E-sports game test, the higher the FPS, the better.
AMD Ryzen 9 7800X3D processor temperature and power consumption test
AMD specifically mentions this generation of 7000X3D processors, because the addition of 3D-Vcache adjusts the clock frequency and reduces it to 120W TDP, and optimizes the V/F curve of the processor, which also makes the temperature and power consumption of 7800X3D better than 7700X. The test uniformly uses 360mm AIO, fan and water pump at full speed setting, and compares AIDA64 CPU, FPU and Cinebench R23 burn-in respectively.
AIDA64 CPU stress test, 7800X3D full-core 5.0GHz pressure at 70.1°C, FPU test 4.21GHz, 68.9°C, Cinebench R23 test 4.78GHz, 84.9°C. Due to the low preset TjMax and 3D-Vcache optimization, the temperature of 7800X3D is relatively better suppressed.
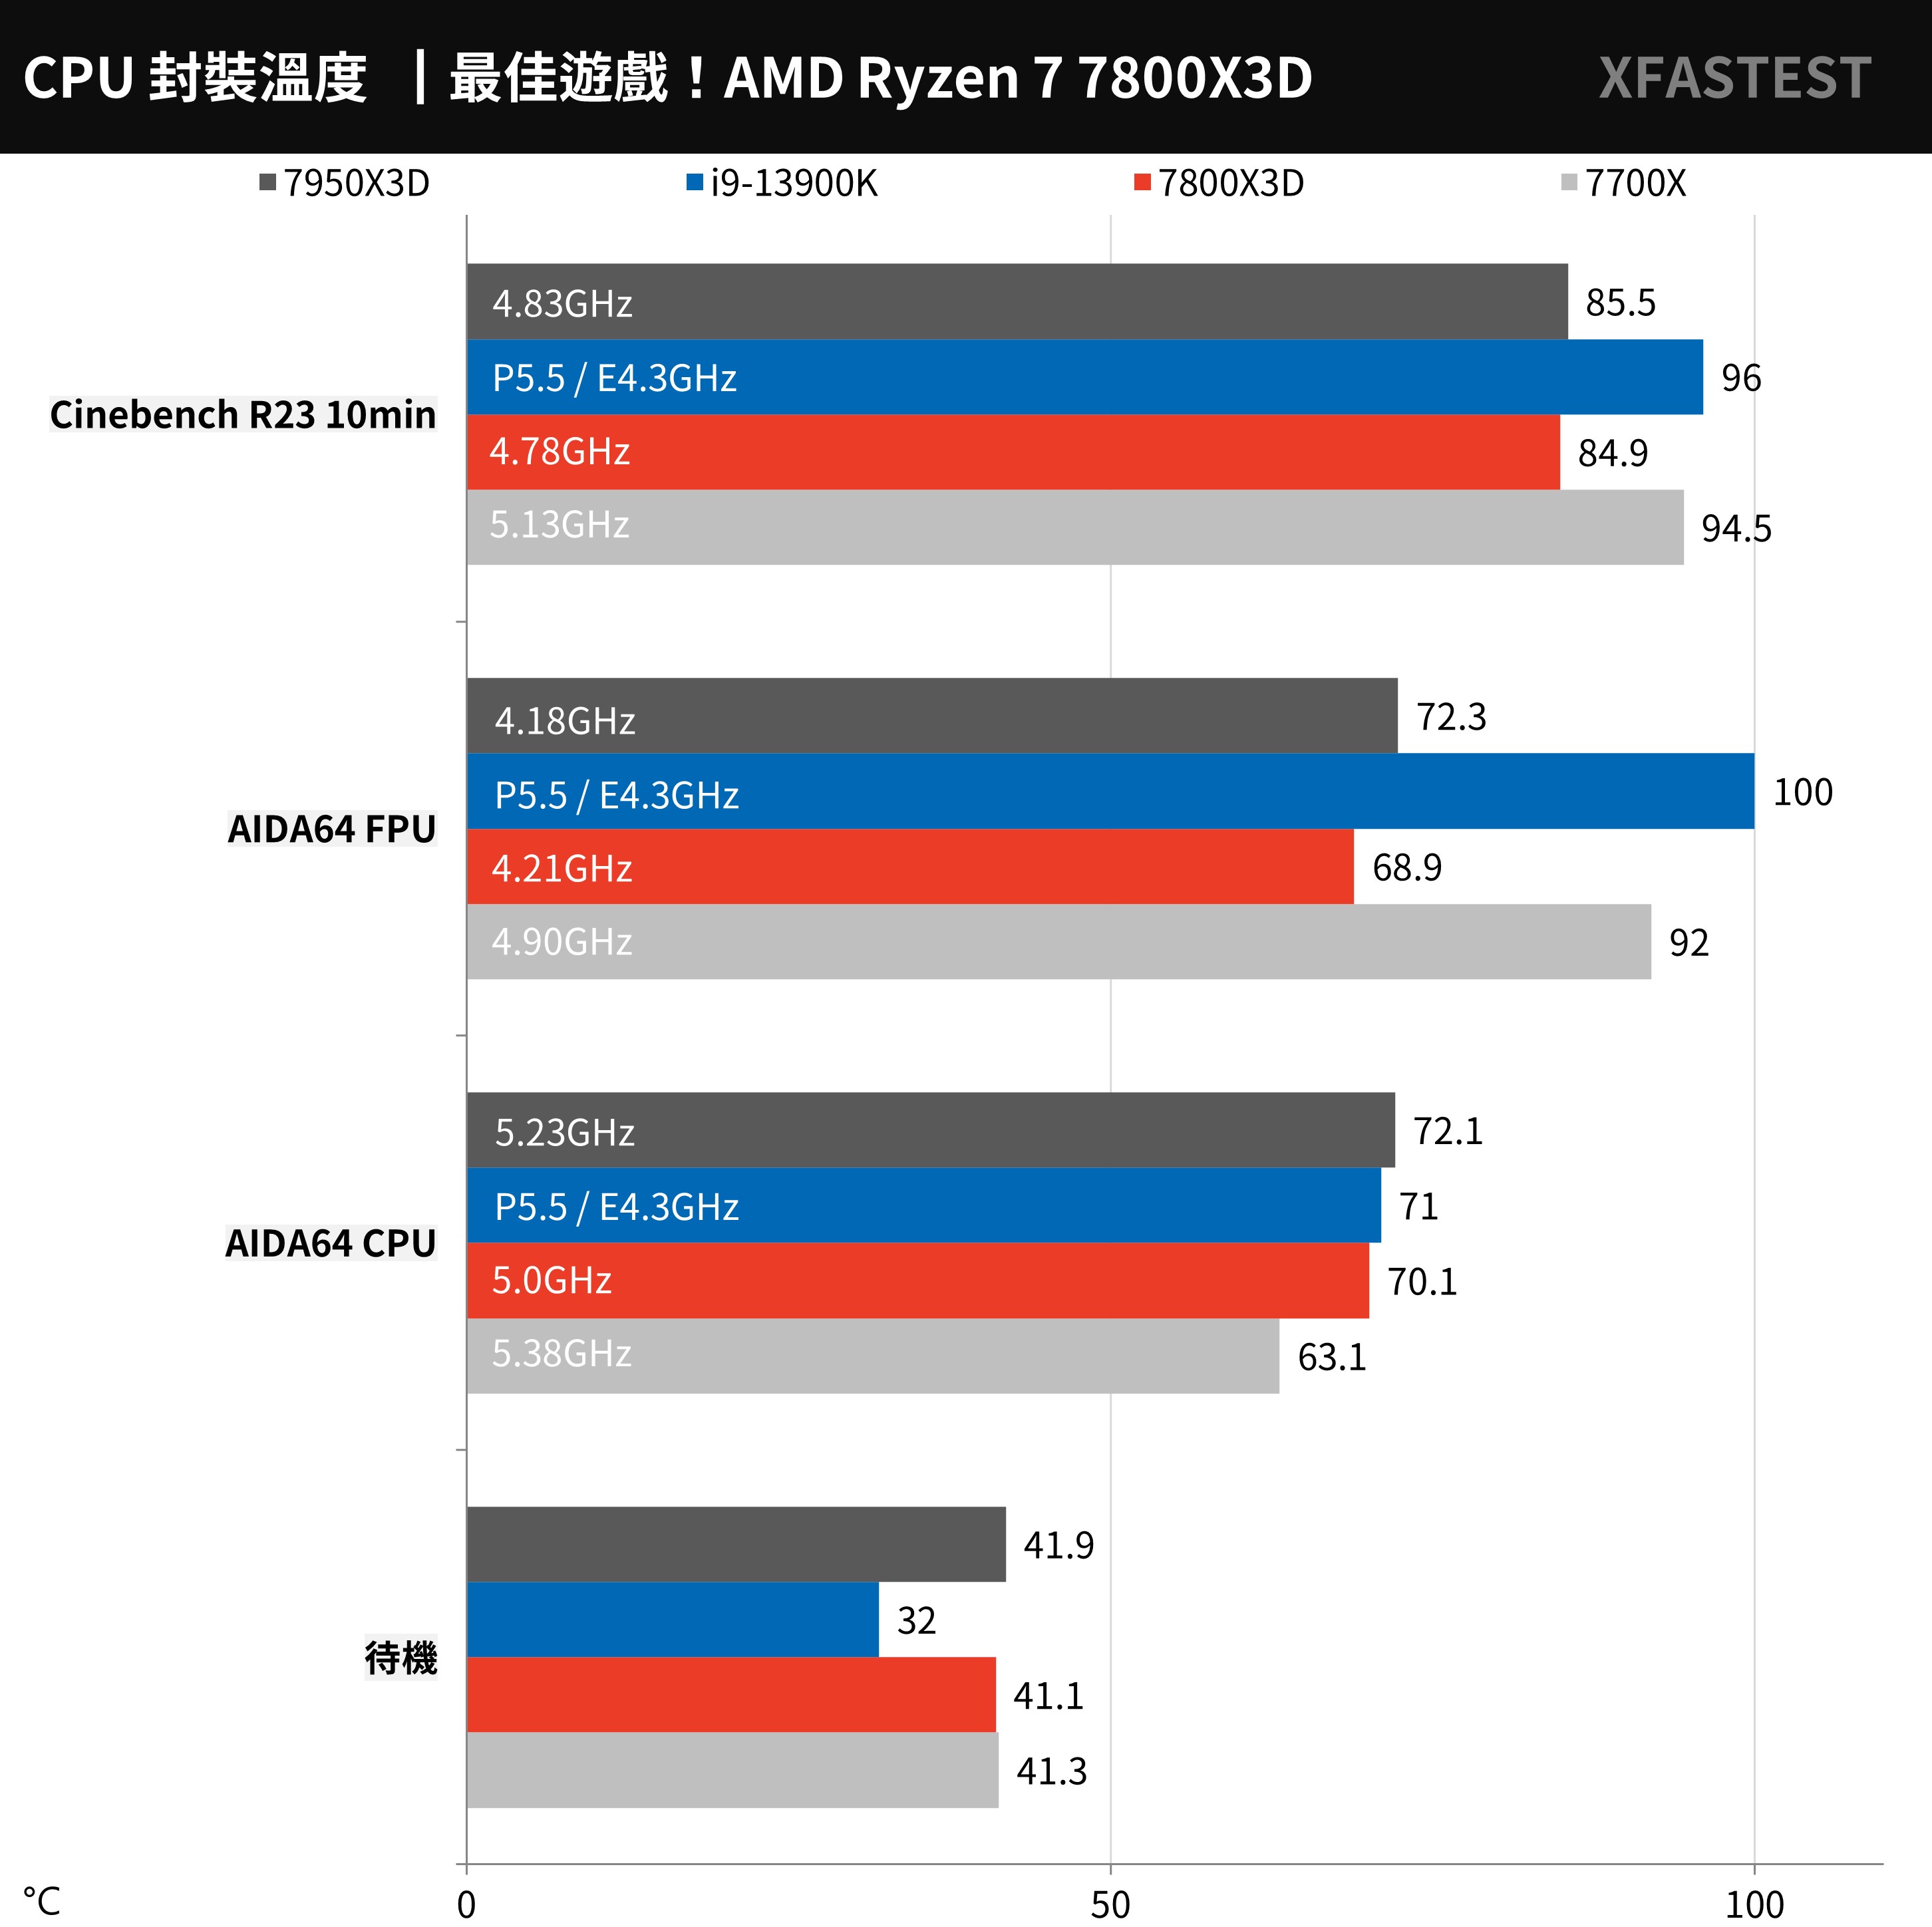
↑ Temperature test.
The clock frequency of 7800X3D stress test is lower than that of 7700X, but it has lower temperature and power consumption performance. AIDA64 CPU test is only 68.8W, FPU 85.1W, Cinebench R23 94.7W power consumption performance; calculated by Cinebench R23, 7800X3D Compared with 7700X, it saves 34% power consumption and has 41% higher performance per watt.
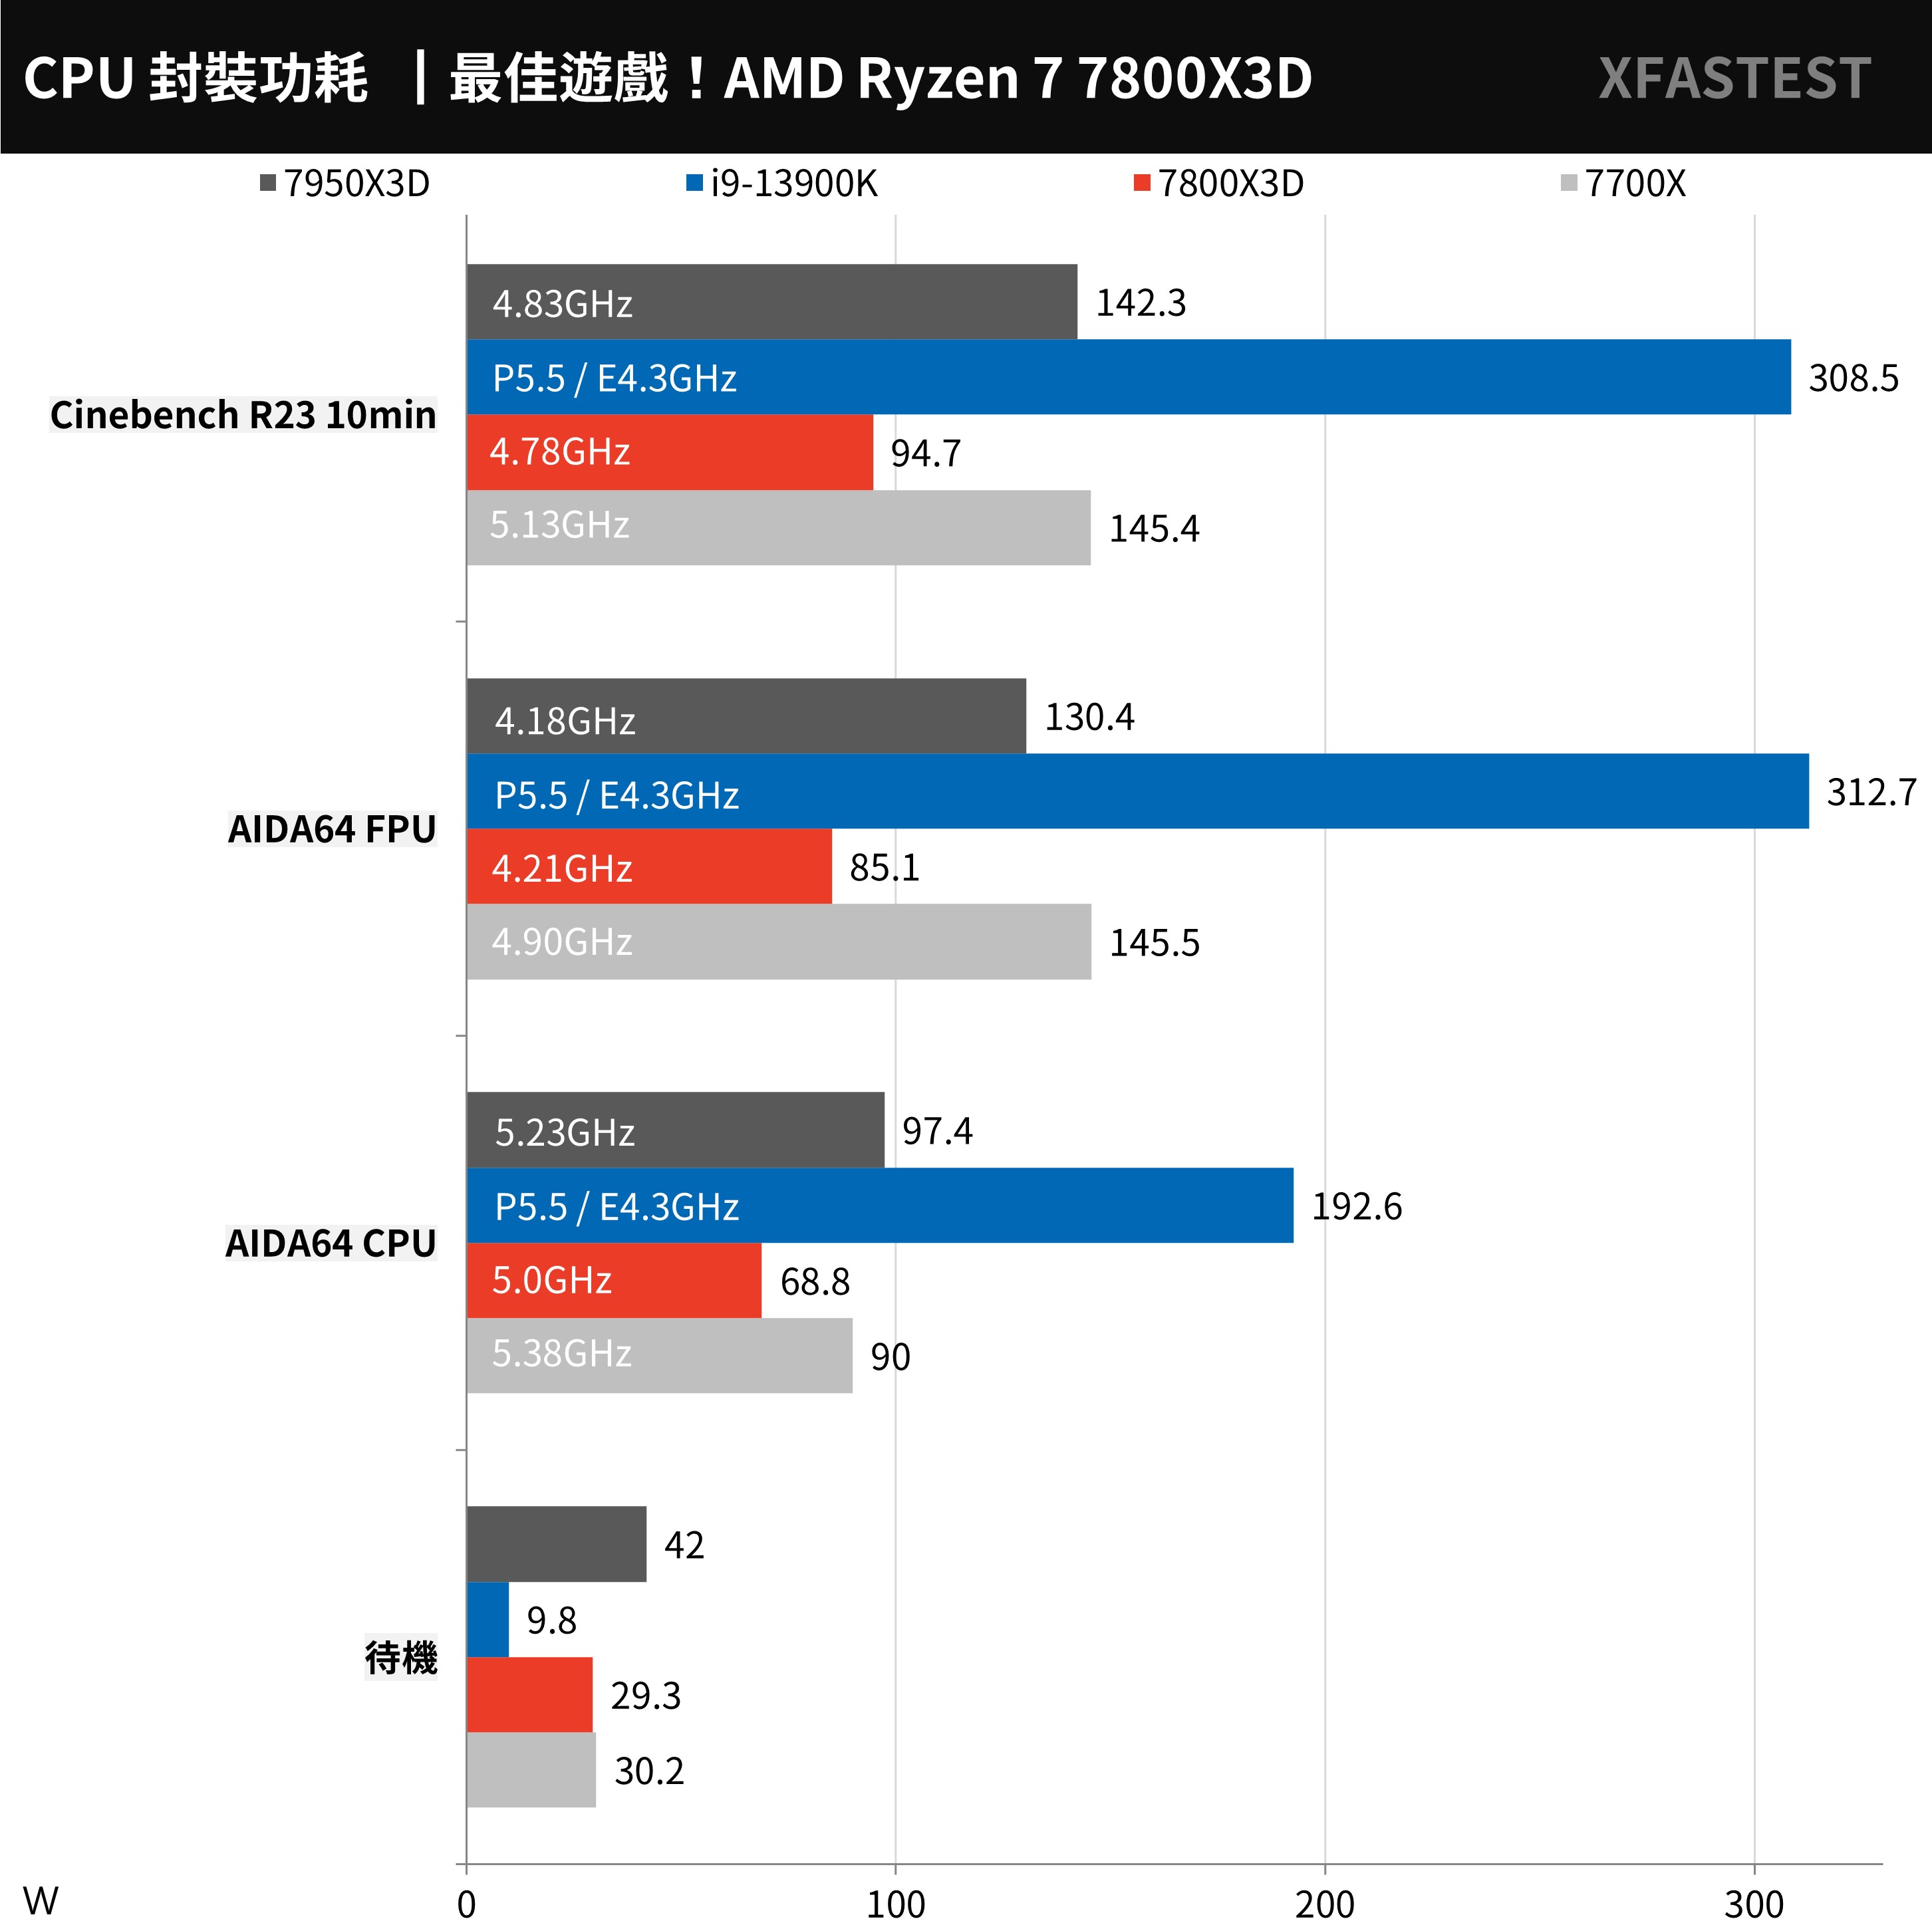
↑ Power consumption test.
Summarize
AMD Ryzen 7800X3D has a 15.7% improvement in game performance. Although it cannot match Ryzen 7950X3D, it also beats i9-13900K by about 15.2%. Moreover, the 7800X3D can save 34% power consumption under the same 8 cores, and the performance per watt has increased by 41%, but the multi-core, single-core, and overall performance of the computer have dropped by about -7%.
Although 7800X3D has a higher game performance per dollar ratio than 7700X and 7950X3D, according to the test data conversion 7800X3D: 0.458; 7700X: 0.445; It can be said to be quite close.
Meaning it’s hard to attract 1080p gamers if the price of the Ryzen 7800X3D isn’t a bargain. After all, 3D V-Cache increases the L3 cache capacity, but general applications cannot get performance improvement. Although 1080p games can get a good performance upgrade, and the improvement of 2K QHD resolution is quite challenging for games, but 4K UHD resolution The performance difference is negligible.
The 7800X3D will be released on the night of 4/6 after the ban is lifted, priced at $449 in US dollars, and the price in Taiwan should be between 7700X and 7900X, which is about 15,000 yuan. It would be embarrassing if the price is too high. After all, how much budget are you willing to spend on the processor for game performance?
Further reading: