
Every company is different. Every organization has its specific product or service, its unique culture, its own management style, its particular organizational structure, its unique composition of employees and teams with their working methods. And then there is the question of how far the digital and agile transformation has progressed.
Therefore, specific, individual data is important to identify trends and patterns and to recognize whether the company is on the road to success and where it is stuck. However, most large organizations collect and store their data from disparate sources in a variety of different formats, from decoupled spreadsheets to departmental systems. How can the company draw meaningful analyzes and insights from its vast amounts of data?
There are some standard reports that are useful for most companies – for example the ones in Yes and Jira Align. But in view of all the variables mentioned above, it becomes clear that a tailor-made reporting approach is necessary for targeted analyses. What can an organization do about it?
An inventory as a basis
Some organizations collect tons of data without any proactive plan or intention behind it. Reporting occurs either simply in response to management requests or by teams trying to guess what management wants to know. Without a reporting strategy, data overload risks stalling the business and not moving forward with the right initiatives.
Every organization wants reports that say exactly what the team wants to know, in a simple and understandable way. The basis for this is an honest and comprehensive inventory of the status quo, which should answer the following questions:
- Do the current reports contain the information and metrics that we really need?
- Do the reports pull data from all sources or just a few?
- Who decides which reports are necessary?
- Do the reports provide enough actionable insights?
- Are they presented in a usable format or as a mass of data?
Excel spreadsheets full of raw data from different departments are not effective for meaningful analysis, especially when using inconsistent data formats. What if a responsible person responsible for maintaining a specific spreadsheet leaves the company? When data is aggregated and synchronized, put in context and presented in the form of charts or graphs, life becomes a whole lot easier.
Understand the challenges of distributed data
Just as it takes adapters or nodes to connect computers and peripherals with different port configurations, tools and systems are needed to link the different data. In some organizations these links already exist, others still have work to do. Here, too, an inventory is necessary first:
- Where is the data stored? On a server, in a public cloud, in a private cloud or in a hybrid environment?
- Which formats, platforms and tools are used?
- Is the data linked and synchronized?
- Who are the owners of the different types of data and who controls them?
- How often is the data updated?
- What quality controls are in place to avoid “garbage in, garbage out”?
Once these questions are answered, the company likely has an idea of where there are reporting gaps and other issues. For example, during the inventory, the team may uncover previously undetected security risks—a useful side effect of such an assessment.
Assess which metrics are important and why
While competitors make targeted use of opportunities that open up, your own company misses them because the measured and used data was incomplete. What information would the teams in the organization need? In a large company there is a need for many different evaluations.
Which metrics are important and which are not? Are we looking at outputs, outcomes, or both? The amount of work measured should also be considered. Maybe we want to determine the time to market for features requested by customers? Do we include lead time and cycle time? If we measure time to market and ignore the time it took to secure funding, our metrics could be misleading.
Ultimately, it’s all about delivering quality results to clients and being able to make pivot-or-persevere decisions as the market changes. The organization needs to understand the entire flow from idea to delivery to see where initiatives are moving smoothly and where potholes and wasted resources are emerging.
End-to-end visibility across the organization enables the right things to be measured while teams build high-quality products or services quickly and confidently. People across the organization should be able to drill down to the granular level of data they need, rather than relying on reports compiled for someone else.
Understand how to interpret the data – and how this information can be used
Interpreting data and acting correctly on the basis of this interpretation is a team sport. Sometimes people are so deeply involved in day-to-day operations that they don’t see the big picture – which is why data visibility across the organization is so important.
A finance leader and a DevOps manager are likely to interpret metrics along a value stream differently: one looks at cost and the other at productivity, but both are working toward the same business goals and outcomes. When each person steps back and looks at the situation from a holistic perspective, everyone can work together towards a solution.
But nobody knows what data is available when teams work in silos and their information is not available to others. Enterprise companies need a tool that breaks down such silos and makes all data available in one central place.
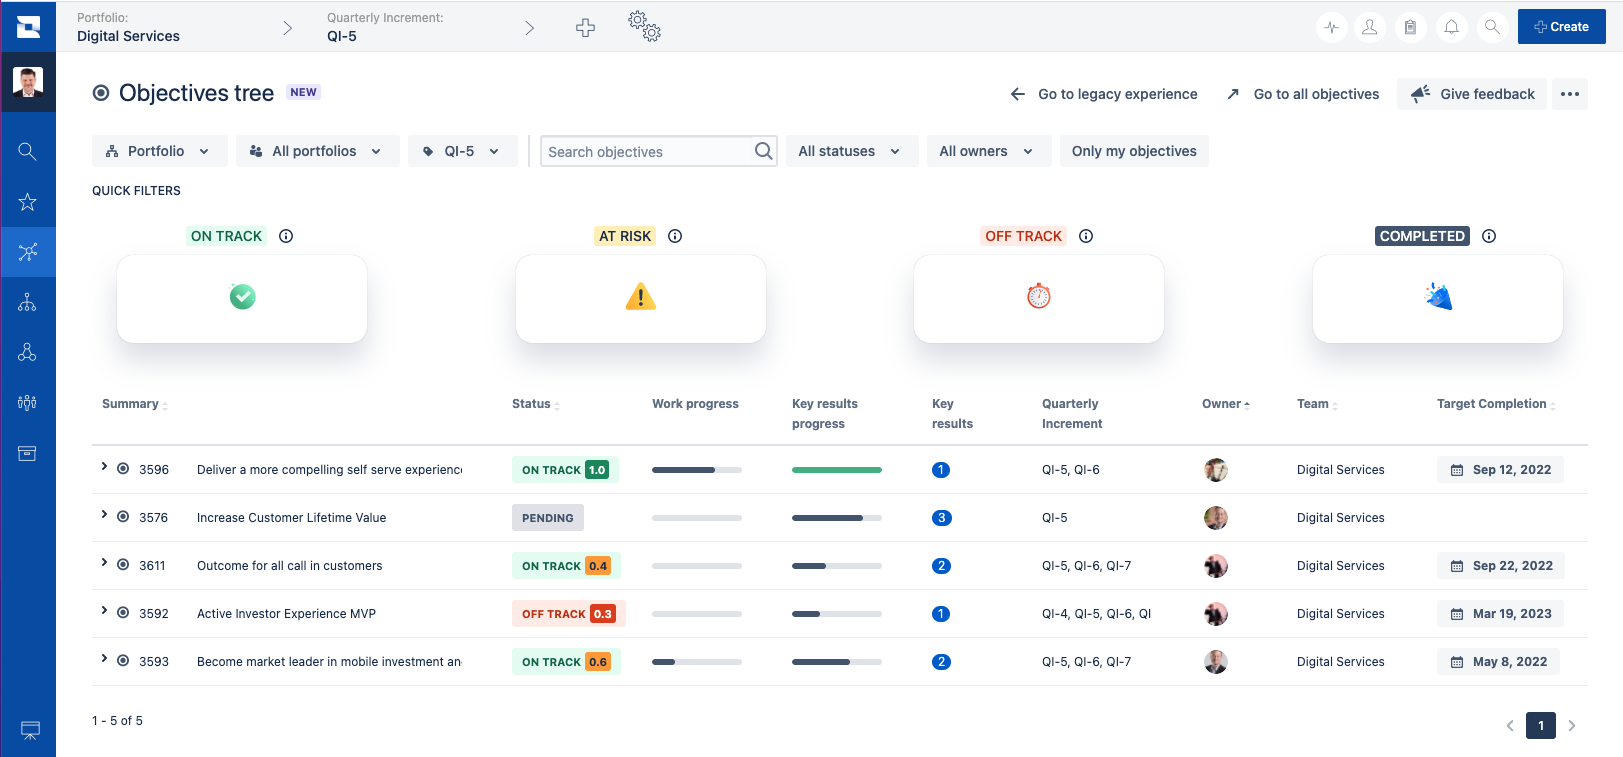
Jira Align establishes such a place across teams and helps ensure that all people in the company work together towards the same goals. You can see where activities are going as planned, where they are at risk, and where they are getting out of hand. Then they can dig deeper into the details.
By linking people, work and time across all company levels, processes can be improved and cross-team dependencies managed. For example, if it becomes apparent that all paths in software development lead to the same roadblock (like an understaffed department struggling with technical debt or doing manual work that could be automated), the teams can come together to develop a solution , so the lockdown doesn’t further prevent the company from delivering value to customers.
Tips for Success
Every organization must decide which metrics work best for them. Standard reports only help up to a certain point. And then specific information is needed. These tips can help you get the most out of your company’s data:
- Throughout the organization, the importance of accurate data should be clear.
- Teams should collect and analyze data on goals, outcomes and OKR.
- Visibility can be created with charts, dashboards and similar visualizations.
- The organization should establish metrics tied to customer value and other key areas.
- The company needs to be clear about how success is defined, so everyone knows what reports are needed.
- There is also an alignment of how the metrics and reports are to be interpreted.
- Metrics should be reviewed regularly to identify how internal and external factors influence success.
- Pivot-or-persevere decisions must be data-driven and based on resilient metrics.
Generate the reports the company needs
Insights based on specialized reports and visualizations lead to better and more informed decisions. Atlassian’s enterprise agility solution, Jira Align, comes with a set of standard reports that can be a first step in this journey. With the new Enterprise Insights feature set, a further reporting layer has now been added, which brings together the program and portfolio data and opens up the possibility of visualizing specific trends and patterns in real time with reduced expenditure of time.

Scaled Agile with Atlassian: Get to know Jira Align now!
Want to know more about software-assisted agile scaling in large organizations? We would be happy to discuss the requirements for a company-wide agile product development and product management system with you and demonstrate the possibilities of Jira Align in a personal session. Get in touch with us or arrange a demo appointment directly!
Further information